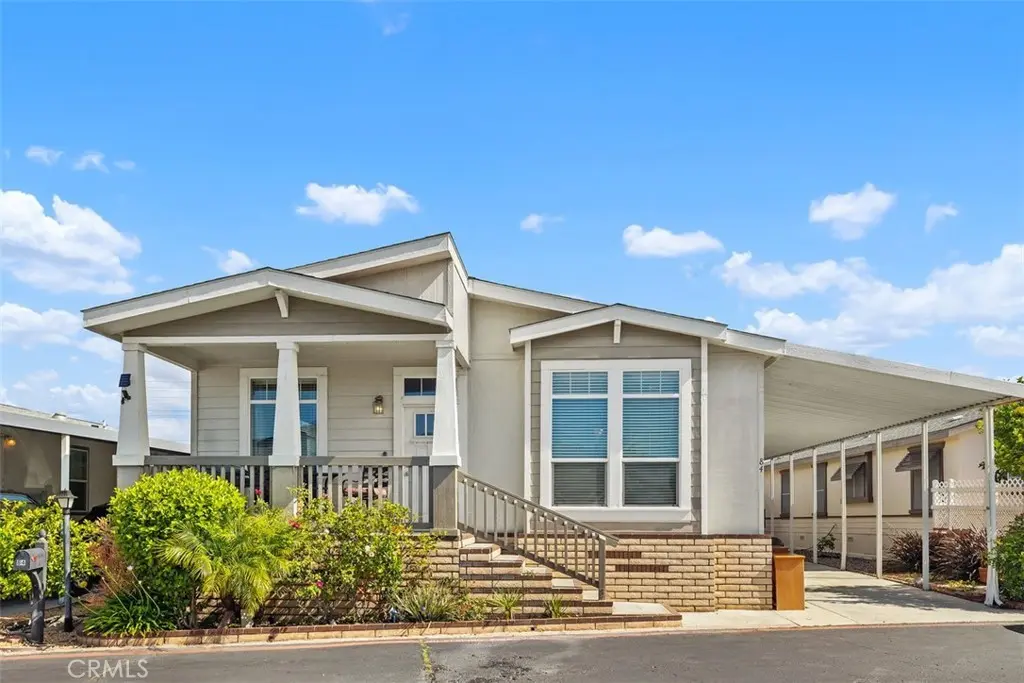
19361 Brookhurst St #84 · Huntington Beach, CA
Flood risk 5/10 · Moderate
- FEMA flood zone
- X
- Chance of flooding over 30 yrs
- 0.24%
- Est. flood insurance / yr
- $507 – $1,088
Fire risk 1/10 · Minimal
- Est. fire insurance / yr
- $659 – $1,223
Heat risk 5/10 · Moderate
- Hot days now (above 85°F)
- 7 days/yr
- Hot days in 30 yrs
- 23 days/yr
Wind risk 1/10 · Minimal
- Chance of severe wind over 30 yrs
- —
Air-quality risk 4/10 · Minor
- Unhealthy air days now
- 5 days/yr
- Unhealthy air days in 30 yrs
- 7 days/yr
Risk factors via First Street. Map © Google.
Why this score? — see what drove the B grade
The composite is a weighted blend of 9 inputs, each scored 0–100. Each bar is that input's sub-score; the figure is the points it added to the 100-point composite (weight × sub-score).
- Cash flow +30.0/30.0
- 1% rule +10.0/10.0
- DSCR +10.0/10.0
- ARV discount +9.3/15.0
- Schools +6.5/10.0
- Livability +3.4/5.0
- Rent growth +2.8/5.0
- Condition / age +2.5/5.0
- Appreciation +0.0/10.0
$275,000
🖨 Deal sheet 📄 Offer letter ✓ Due diligence
Listing remarks
Move-In Ready! Bright, spacious, and beautifully upgraded, this inviting manufactured home offers comfort and style in a welcoming, all-ages community. High Ceilings, Air Conditioned, Laundry Room, Upgrades throughout. Carport has room for 3 cars. Additional storage in the Shed. The community amenities include a pool, clubhouse, and Library—ideal for relaxing, socializing, and staying active. Ocean Breezes. .. .A wonderful place to call home!
Key facts
- Jet spa tub
- Community amenities
- Storage shed
Tags
Property features AI
Finance
- Other: Lot reported as 0–1 unit/acre; Lot size source: Landlord/Lessor/Owner; Elevation measured in feet; Builder: CMH Manufacturing West Inc.; Property condition listed as turnkey
- Financial info: Monthly land lease: $2,692
- HOA & community: Land lease community (Rancho Huntington)
Exterior
- Parking: Attached carport with space for 3 vehicles; Has parking
- Utilities: Public sewer; District/public water
- Home design: Single-story home; One-level entry; Turnkey condition; Has a view; Mobile home (30' x 61') — mobile home remains; Park name: Rancho Huntington; Community type: Urban
- Construction: Built (year source: public records)
- Exterior features: Front porch; Community pool; Shed
Interior
- Kitchen: Remodeled kitchen; Microwave; Refrigerator; Gas range; Granite counters
- Bedrooms: All bedrooms on the ground floor; Main floor primary bedroom; Main floor bedroom; Walk-in closet; Primary bathroom
- Flooring: Laminate flooring
- Bathrooms: 2 full bathrooms; Jetted tub; Remodeled bathrooms
- Heating & cooling: Central furnace heating; Central air conditioning
- Interior features: Ceiling fan; Open floor plan; Coffered ceilings; Cathedral/vaulted ceilings; Granite counters
- Laundry & utility: Dedicated laundry room; Washer included; Dryer included
Neighborhood map
What this means for you Summary
Snapshot
- This is a 3-bed/2.0-bath manufactured listed at $275k.
Deal economics
- At list price, monthly cash flow is $2k ($21k/yr) — positive.
- The deal already cash-flows at list — no discount required.
- Meets the 1% rule at list price ($4k rent vs $275k).
- Recommended offer: $258k (6.0% below list) — sets the bar for market timing.
- Cap rate 14.0% vs local median 1.6% in Huntington Beach — top-decile yield for the area; either an underpriced asset or a hidden risk that comps aren't pricing in. Stress-test before assuming the spread holds.
Location & tenants
- Location reads 67/100 on livability (#306 in CA) — a middle-class / working-renter tenant base. Strengths: employment A+, commute A-, schools B+; Watch: amenities C-, cost of living F, health & safety F.
- Huntington Beach Union High (suburban): math 65% / reading 82% proficiency, ranked #39 of 517 in CA (top 8%) — strong family-tenant draw, lease renewals of 3-5y typical.
- Market conditions: Rents rising (+1.2%/yr); 116 active listings in the ZIP; 26 comparable units currently listed for rent nearby; rentals leasing fast (median 3d on market — plan ~1-2 weeks tenant-placement turnaround); high-income renter base; 6,974 units permitted in Orange County in 2024 (3,839 in 5+ unit buildings).
- This rent runs 40% of the median local income ($131k/yr) — at the standard rent-burdened threshold; future hikes will face affordability resistance.
Forward outlook
- Local home prices are declining (-3.0%/yr); year-one equity from $2k of loan paydown is wiped out by about $8k of value loss. Plan a longer hold.
- Orange County population projected at +14% by 2050 — modest demand growth; plan on rents tracking national, not racing it.
- At projected returns (-3.0% appreciation + 1.2% rent growth), your $77k cash investment doubles in ~5 years — after that, you're playing with house money.
Negotiation context
- It's been on market 61 days — a 6% lower offer ($258k) is reasonable based on typical stale-listing flexibility.
- 2 sale attempts; this cycle's ask has dropped $25k (8%) from the opening price — seller is motivated, your offer sets the floor, not the list.
Risks & watch-outs
- Climate carrying-cost: moderate flood risk; extreme-heat days projected 7→23/yr by 2055 (HVAC capex compounding) — expect insurance premiums to compound above CPI over the hold.
Questions for the listing agent
- It's been on market 61 days. Have you received any prior offers? Is the seller open to a 6% concession, seller financing, or rate buy-down credit?
- Why hasn't it sold? Are there any deal-killer items the seller is aware of (foundation, flood, title, zoning, code violations)?
- Is there a deadline driving the sale (1031 exchange, divorce, estate, relocation)? That informs how much negotiation room exists.
- Schools are B-rated — typically a magnet for longer-tenancy family renters. What's the average tenant stay here, and is there a school-zone premium baked into asking?
- What's the average days-on-market for RENTAL listings here right now (not sales)? A rising rental-DOM trend means longer vacancies and softer asking-rent achievability than the comps imply.
- What's the recent tenant-quality profile in this submarket — average credit score on applications, eviction rate, late-payment / NSF rate, and stable-employment percentage? A property-management company in the area should have these aggregated.
- How much new for-sale + rental construction is in the pipeline within 1–3 miles? Heavy new supply typically softens prices + rents 12–24 months out; constrained supply supports both.
Investment metrics
- 1% rule
- 1.57% ✓
- Cap rate
- 14.05%
- Cash-on-cash
- 27.69%
- DSCR
- 2.23
- GRM
- 5.3
CMA / ARV
- ARV (on-the-fly)
- $286,605
- Comps found
- 12
Show comp detail 12 sales within ~0.75 mi
| Address | Dist | Beds/Ba | Sqft | Sold | Price | $/sf | Match |
|---|---|---|---|---|---|---|---|
| 19361 Brookhurst St #33 | 0.00mi | 3/2.0 | 1,680 (-3%) | 4mo | $277,365 | $165 | 91 |
| 9850 Garfield Ave #74 | 0.30mi | 3/2.0 | 1,750 (+1%) | 1mo | $312,500 | $179 | 84 |
| 19361 Brookhurst St #12 | 0.00mi | 3/2.0 | 1,651 (-5%) | 12mo | $215,000 | $130 | 82 |
| 19361 Brookhurst St #62 | 0.00mi | 3/2.0 | 1,638 (-6%) | 14mo | $249,000 | $152 | 79 |
| 9850 Garfield #35 | 0.30mi | 3/2.0 | 1,831 (+5%) | 0mo | $250,000 | $137 | 77 |
| 9850 Garfield Ave #130 | 0.30mi | 3/2.0 | 1,800 (+4%) | 8mo | $335,000 | $186 | 74 |
| 19361 Brookhurst St #51 | 0.00mi | 3/2.0 | 1,536 (-12%) | 12mo | $161,000 | $105 | 71 |
| 9850 Garfield #129 | 0.30mi | 3/2.0 | 1,560 (-10%) | 2mo | $285,000 | $183 | 67 |
| 19251 Brookhurst St #71 | 0.20mi | 2/2.0 (-1) | 1,608 (-7%) | 10mo | $125,000 | $78 | 65 |
| 19361 Brookhurst St #120 | 0.00mi | 2/2.0 (-1) | 1,500 (-14%) | 11mo | $138,000 | $92 | 63 |
| 9850 Garfield Ave #63 | 0.30mi | 3/2.0 | 1,593 (-8%) | 12mo | $295,000 | $185 | 62 |
| 19350 Ward St #57 | 0.67mi | 3/2.0 | 1,548 (-11%) | 6mo | $319,500 | $206 | 46 |
Match score weights: distance 35% · size 25% · config 20% · recency 20%. Top-matched comps best support the ARV.
Projected returns pro-forma
-3.0% appreciation · 1.2% rent growth · sell at horizon
- IRR
- 19.8%
- Equity multiple
- 1.79×
- Total profit
- $60,817
- Equity at exit
- $41,003
- IRR
- 26.9%
- Equity multiple
- 3.18×
- Total profit
- $167,843
- Equity at exit
- $23,777
Cash invested: $77,000 (down + closing). Projections, not guarantees.
Landlord ↔ Tenant lean methodology
- Overall (STATE)
- 18 Strongly Tenant-Friendly
- State California
- 18 Strongly Tenant-Friendly · D+13
- County
- — inherits STATE
- City
- — inherits STATE
ZIP-level market 92646
- Rents YoY
- 1.2%
- Active inventory
- 116
- Price-to-rent
- 5.3×
Monthly cashflow live
- Estimated rent
- $4,324 high interval (Pro) →
- Mortgage (P&I)
- −$1,442
- Tax from tax record
- −$83 /mo · $991/yr
- Insurance
- −$115
- HOA
- −$0
- Vacancy / Maint / Mgmt
- −$908
- Net cashflow
- $1,777
Break-even live
UW: 25.0% down · 7.5% · 30yr · 1.5% tax · 5.0% vac · 8.0% maint · 8.0% mgmt
Financing live
Cash to close
- Down payment
- $68,750
- Closing costs
- $8,250
- Reserves months
- —
- Total cash needed
- —
Loan-product check · same deal, 3 products live
Conventional
25% down · 7.5% · 30yr
- Down + closing
- —
- Monthly P&I
- —
- Monthly cashflow
- —
- DSCR
- —
- Eligible?
- —
Personal DTI + credit; lowest rate.
DSCR
20% down · 8.5% · 30yr
- Down + closing
- —
- Monthly P&I
- —
- Monthly cashflow
- —
- DSCR
- —
- Eligible?
- —
No personal income docs; deal must DSCR.
Hard money
10% down · 12.0% · 12mo
- Down + closing
- —
- Monthly P&I
- —
- Monthly cashflow
- —
- DSCR
- —
- Eligible?
- —
Short-term bridge; refi at stabilization.
Rent comps 26 comps
| Address | Beds | Baths | Sqft | Rent | $/sqft | DOM | Units | Dist |
|---|---|---|---|---|---|---|---|---|
| 19754 Kingswood Ln Huntington Beach, CA | 4.0 | 1.5 | 1254 | $3,595 | $2.87 | 1d | 1 | 0.36mi |
| 19775 Cambridge Ln Huntington Beach, CA | 3.0 | 2.5 | 1122 | $3,495 | $3.11 | 1d | 1 | 0.38mi |
| 19844 Inverness Ln Huntington Beach, CA | 4.0 | 1.5 | 1254 | $3,675 | $2.93 | 1d | 1 | 0.46mi |
| 10107 Holburn Dr Huntington Beach, CA | 3.0 | 1.5 | 1122 | $3,500 | $3.12 | 1d | 1 | 0.47mi |
| 9552 Bickley Dr #7 Huntington Beach, CA | 3.0 | 1.5 | 1100 | $3,500 | $3.18 | 1d | 1 | 0.47mi |
| 9582 Pettswood Dr Huntington Beach, CA | 3.0 | 1.5 | 1178 | $3,700 | $3.14 | 19d | 1 | 0.53mi |
| 9582 Pettswood Dr Huntington Beach, CA | 3.0 | 1.5 | 1174 | $3,700 | $3.15 | 17d | 1 | 0.53mi |
| 9727 Adams Ave Huntington Beach, CA | 3.0 | 2.5 | 1122 | $3,300 | $2.94 | 1d | 1 | 0.58mi |
| 19901 Sheffield Ln Huntington Beach, CA | 4.0 | 1.5 | 1254 | $3,795 | $3.03 | 17d | 1 | 0.60mi |
| 10172 Ascot Cir Huntington Beach, CA | 3.0 | 1.5 | 1122 | $4,500 | $4.01 | 1d | 1 | 0.63mi |
| 9111 Warfield Dr Huntington Beach, CA | 4.0 | 2.5 | 1812 | $5,500 | $3.04 | 24d | 1 | 0.79mi |
| 19343 McLaren Ln Huntington Beach, CA | 3.0 | 2.0 | 1654 | $4,000 | $2.42 | 24d | 1 | 0.87mi |
| 9022 Hyde Park Dr Huntington Beach, CA | 4.0 | 2.5 | 1868 | $4,995 | $2.67 | 25d | 1 | 0.88mi |
| 9021 Hyde Park Dr Huntington Beach, CA | 4.0 | 2.5 | 1818 | $5,750 | $3.16 | 1d | 1 | 0.89mi |
| 9704 Lark Cir Fountain Valley, CA | 4.0 | 2.5 | 1528 | $4,600 | $3.01 | 22d | 1 | 0.97mi |
| 9891 Hot Springs Dr Huntington Beach, CA | 3.0 | 2.0 | 1494 | $7,000 | $4.69 | 1d | 1 | 1.05mi |
| 8831 Sailport Dr Huntington Beach, CA | 4.0 | 2.5 | 2224 | $6,095 | $2.74 | 18d | 1 | 1.07mi |
| 8831 Sailport Dr Huntington Beach, CA | 4.0 | 3.0 | 2224 | $6,095 | $2.74 | 1d | 1 | 1.07mi |
| 9595 Toucan Ave Fountain Valley, CA | 3.0 | 2.5 | 1548 | $4,200 | $2.71 | 17d | 1 | 1.18mi |
| 18236 Sanmian Ct Fountain Valley, CA | 3.0 | 3.0 | 1690 | $4,100 | $2.43 | 22d | 1 | 1.20mi |
| 18229 Olympic Ct Fountain Valley, CA | 3.0 | 2.0 | 1144 | $4,300 | $3.76 | 1d | 1 | 1.27mi |
| 2932 Pemba Dr Costa Mesa, CA | 4.0 | 2.0 | 1775 | $7,500 | $4.23 | 11d | 1 | 1.44mi |
| 9272 Sunridge Dr Huntington Beach, CA | 4.0 | 2.0 | 1684 | $6,000 | $3.56 | 1d | 1 | 1.46mi |
| 8521 Afton Cir Huntington Beach, CA | 4.0 | 3.0 | 1950 | $5,500 | $2.82 | 3d | 1 | 1.49mi |
| 8933 Modesto Cir Unit 1215B Huntington Beach, CA | 2.0 | 2.0 | 1091 | $3,200 | $2.93 | 1d | 1 | 1.49mi |
| 8933 Modesto Cir Unit 1215B Huntington Beach, CA | 2.0 | 2.0 | 1091 | $3,200 | $2.93 | 18d | 1 | 1.49mi |
Listing history 18 events
-
2026-06-18days on market $275,000 Active 61 DOM
-
2026-06-17days on market $275,000 Active 60 DOM
-
2026-06-16days on market $275,000 Active 59 DOM
-
2026-06-15days on market $275,000 Active 58 DOM
-
2026-06-13days on market $275,000 Active 56 DOM
-
2026-06-13days on market $275,000 Active 55 DOM
-
2026-06-09days on market $275,000 Active 52 DOM
-
2026-06-08days on market $275,000 Active 51 DOM
-
2026-06-07days on market $275,000 Active 50 DOM
-
2026-06-04days on market $275,000 Active 47 DOM
-
2026-06-03days on market $275,000 Active 46 DOM
-
2026-06-02days on market $275,000 Active 45 DOM
-
2026-06-01days on market $275,000 Active 44 DOM
-
2026-05-31days on market $275,000 Active 43 DOM
-
2026-04-20historical
-
2026-04-18$300,000 Active
-
2026-04-15$300,000 Active
-
2026-04-10historical
ⓘ Source: listings_history table (triggers on properties + properties_extension) + one-shot
backfill from property_details.listing_events for pre-trigger history.
Tax reassessment forecast CA · Resets to sale price
- Current annual tax
- $991 · $83/mo
- Projected year-2 tax
- $2,090 · $174/mo
- Expected delta
- +$1,099/yr (+$92/mo · 110.9%)
ⓘ Screening estimate from a state-policy table — verify with the county assessor before closing.
Climate risk First Street
- Flood 5/10 Major FEMA zone X · 24% chance over 30 yrs
- Wildfire 1/10 Low
- Heat 5/10 Major 7 d/yr ≥85°F today · 23 d/yr by 30 yrs out
- Wind 1/10 Low
- Air quality 4/10 Moderate 5 unhealthy d/yr today · 7 by 30 yrs out
Nearby sold comps map
Loading sold comps map…
Walkable amenities ~0.75 mi
Loading nearby amenities…
Taxation est. · year 1
- Rental income
- $51,890
- − Mortgage interest
- −$15,404
- − Property taxes
- −$991
- − Insurance
- −$1,375
- − Repairs & maintenance
- −$4,151
- − Management
- −$4,151
- − Depreciation
- −$8,000
- Taxable income
- $17,818
- Est. tax owed @ 24.0%
- −$4,276
- After-tax cash flow
- $17,046/yr
For passive investors: Depreciation is non-cash, so a rental often shows a tax loss while cash-flowing — sheltering income. Rental losses are passive: they offset passive income freely, and up to $25,000/yr can offset ordinary (W-2) income if you actively participate and your MAGI is under $100k (phasing out to $0 by $150k); unused losses carry forward. On sale, claimed depreciation is recaptured at up to 25%, and gains may owe capital-gains tax (a 1031 exchange can defer both). Figures are a year-1 estimate at your 24.0% rate — not tax advice; consult a CPA.
Schools (NCES district)
- District
- Huntington Beach Union High
- NCES district ID
- 0618060
- Math proficiency
- 65% ▲ 17.00%
- Reading proficiency
- 82% ▲ 8.00%
- Median HH income
- $78,159
- Composite
- 64.9/100
- National rank
- #511
- State rank
- #39 of 517 in CA
Livability — Huntington Beach
- Score
- 67/100
- State rank
- #306
- US rank
- #10298
Category grades
Schools grade is shown separately in the Schools card above.
Census & demographics
- Census place
- Huntington Beach, CA
- County
- Orange County · 3,096,323 people
- City population
- 194,835
- Metro
- Los Angeles-Long Beach-Anaheim, CA
- Population (ZIP)
- 54,615
- Household income
- $130,672
- Rent vs Own
- Severe rent burden
- 1226.0
Population outlook (Orange County) Hauer SSP2
- Today (2025)
- 3,477,456 people
- By 2030
- 3,613,117 · +3.9%
- By 2040
- 3,835,945 · +10.3%
- By 2050
- 3,968,736 · +14.1%
- By 2075
- 4,097,053 · +17.8%
- By 2100
- 3,903,633 · +12.3%
Race, ethnicity, and origin ACS 2023
- Neighborhood character
- Diverse neighborhood (Simpson 0.56)
- Race & ethnicity
- White 63% Hispanic / Latino 16% Asian 13% Two or more races 13%
- Hispanic origin (detail)
- Mexican 11%
- Common ancestry
- Italian 3% Romanian 2% Lithuanian 2%
- Foreign-born
- 15% · Vietnam, Canada, China
- Languages at home
- 80% English-only · Spanish 7% Vietnamese 5% Chinese 2%
Political lean MEDSL · Orange
- 2024 margin
- Toss-up / Even · D 49.7% · R 47.1% · Other 3.2%
- 2008→2024 swing
- +5.2pp toward D · 2008: -2.6pp · 2024: 2.6pp
- All cycles
- 2024: D+2.6 2020: D+9.0 2016: D+7.7 2012: R+8.3 2008: R+2.6
Not yet ingested
- Civics
- —
Market trends
- HPI YoY
- ▼ -1082.92%
- Current HPI
- 459.3987
- Rent YoY
- ▲ 1.20%
- Metro
- Los Angeles-Long Beach-Anaheim, CA
- State GDP YoY
- ▲ 3.21%
- F500 in state
- 116
Industry mix (Fortune 500 HQ in CA)
| Industry | F500 HQs | Revenue |
|---|---|---|
| Technology | 27 | $1,492B |
|
||
| Financial Services | 3 | $174B |
|
||
| Retail | 3 | $44B |
|
||
| Insurance | 3 | $26B |
|
||
| Media / Entertainment | 2 | $115B |
|
||
| Pharmaceuticals / Biotech | 2 | $62B |
|
||
Price history
+0.0% since first listed4 events — show timeline
- 2026-04-20 Listing Removed — CRMLS
- 2026-04-18 Listed $300,000 CRMLS
- 2026-04-15 Listed $300,000 CRMLS
- 2026-04-10 Coming Soon — CRMLS
Property tax history
-3.8%/yrLatest (2025): $991 · -0.4% YoY. Source: county tax records.
Cash-flow waterfall
monthlySold comps — $/sqft
last 12 mo · ≤1 miLoading sold comps…