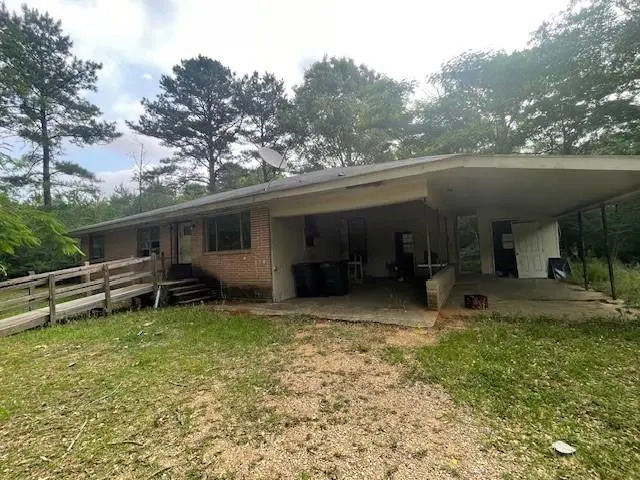
3068 Hall And Lindsey Rd · Greensburg, LA
Flood risk No data
- FEMA flood zone
- —
- Chance of flooding over 30 yrs
- —
- Est. flood insurance / yr
- —
Fire risk No data
- Est. fire insurance / yr
- —
Heat risk No data
- Hot days now (above threshold)
- —
- Hot days in 30 yrs
- —
Wind risk No data
- Chance of severe wind over 30 yrs
- —
Air-quality risk No data
- Unhealthy air days now
- —
- Unhealthy air days in 30 yrs
- —
Risk factors via First Street. Map © Google.
Why this score? — see what drove the B grade
The composite is a weighted blend of 9 inputs, each scored 0–100. Each bar is that input's sub-score; the figure is the points it added to the 100-point composite (weight × sub-score).
- Cash flow +30.0/30.0
- 1% rule +10.0/10.0
- DSCR +10.0/10.0
- ARV discount +7.5/15.0
- Appreciation +5.0/10.0
- Livability +3.2/5.0
- Rent growth +2.5/5.0
- Condition / age +2.5/5.0
- Schools +0.7/10.0
$44,900
🖨 Deal sheet 📄 Offer letter ✓ Due diligence
Listing remarks MLS
Longing to get away from the hustle and bustle then try something different. This 3 bedroom 1 bath offers a quiet lifestyle shady by trees just outside Greensburg. Older home needing some tender care, but lots of potential. Large lot in Zone X.
Key facts
- 0.9 acre lot
- 2 parking spots
- Built 1965
Property features AI
Exterior
- Parking: Attached carport with two spaces
- Utilities: Public water; Septic tank sewer
- Home design: Single-story home; Raised foundation
- Construction: Brick and frame construction; Asphalt shingle roof
- Exterior features: Shed(s); Rectangular lot; Outside city limits
Interior
- Bathrooms: 1 full bathroom
- Interior features: Wood-burning fireplace; 6 total rooms; Average condition
- Laundry & utility: Washer hookup; Dryer hookup
Neighborhood map
What this means for you Summary
Snapshot
- This is a 3-bed/1.0-bath single-family listed at $45k.
Deal economics
- At list price, monthly cash flow is $511 ($6k/yr) — positive.
- The deal already cash-flows at list — no discount required.
- Meets the 1% rule at list price ($1k rent vs $45k).
- Recommended offer: $44k (3.0% below list) — sets the bar for market timing.
Location & tenants
- Location reads 63/100 on livability (#185 in LA) — a middle-class / working-renter tenant base. Strengths: cost of living A+, housing A+, health & safety A+; Watch: schools F, amenities F, commute F.
- St. Helena Parish (rural): math 5% / reading 11% proficiency, ranked #95 of 98 in LA (top 97%) — low school quality limits family demand, transient renter base, plan for 1-2y turnover; 88% free/reduced lunch — lower-income household profile, screen leases tightly.
- Market conditions: 29 active listings in the ZIP; 12 units permitted in St. Helena Parish in 2024 (0 in 5+ unit buildings).
Forward outlook
- In year one you build about $2k of equity ($310 loan paydown + $1k appreciation (3.0% local appreciation)).
- St. Helena County population projected at -27% by 2050 — secular population decline; favor cash flow + early exit over multi-decade hold.
- At projected returns (3.0% appreciation + 3.0% rent growth), your $13k cash investment doubles in ~2 years — after that, you're playing with house money.
Negotiation context
- It's been on market 50 days — a 3% lower offer ($44k) is reasonable based on typical stale-listing flexibility.
- 2 sale attempts with the ask held roughly flat each time — persistent listings suggest the price (not the market) is what's stuck; bring a comps-based counter.
Questions for the listing agent
- It's been on market 50 days. Have you received any prior offers? Is the seller open to a 3% concession, seller financing, or rate buy-down credit?
- Built in 1965 — when were the roof, HVAC, electrical panel, plumbing, and water heater last replaced?
- Is there a deadline driving the sale (1031 exchange, divorce, estate, relocation)? That informs how much negotiation room exists.
- Schools are F-rated, which usually means shorter tenancies and higher turnover. Who's the typical renter profile here, and what's been the actual vacancy rate?
- What's the average days-on-market for RENTAL listings here right now (not sales)? A rising rental-DOM trend means longer vacancies and softer asking-rent achievability than the comps imply.
- What's the recent tenant-quality profile in this submarket — average credit score on applications, eviction rate, late-payment / NSF rate, and stable-employment percentage? A property-management company in the area should have these aggregated.
- How much new for-sale + rental construction is in the pipeline within 1–3 miles? Heavy new supply typically softens prices + rents 12–24 months out; constrained supply supports both.
Investment metrics
- 1% rule
- 2.29% ✓
- Cap rate
- 19.96%
- Cash-on-cash
- 48.82%
- DSCR
- 3.17
- GRM
- 3.6
CMA / ARV
No comps found within radius.
Projected returns pro-forma
3.0% appreciation · 3.0% rent growth · sell at horizon
- IRR
- 54.0%
- Equity multiple
- 4.02×
- Total profit
- $37,995
- Equity at exit
- $20,189
- IRR
- 53.6%
- Equity multiple
- 8.13×
- Total profit
- $89,622
- Equity at exit
- $31,114
Cash invested: $12,572 (down + closing). Projections, not guarantees.
Landlord ↔ Tenant lean methodology
- Overall (STATE)
- 90 Strongly Landlord-Friendly
- State Louisiana
- 90 Strongly Landlord-Friendly · R+12
- County
- — inherits STATE
- City
- — inherits STATE
ZIP-level market 70441
- Active inventory
- 29
- Price-to-rent
- 3.6×
Monthly cashflow live
- Estimated rent
- $1,027 medium interval (Pro) →
- Mortgage (P&I)
- −$235
- Tax from tax record
- −$46 /mo · $546/yr
- Insurance
- −$19
- HOA
- −$0
- Vacancy / Maint / Mgmt
- −$216
- Net cashflow
- $511
Break-even live
UW: 25.0% down · 7.5% · 30yr · 1.5% tax · 5.0% vac · 8.0% maint · 8.0% mgmt
Financing live
Cash to close
- Down payment
- $11,225
- Closing costs
- $1,347
- Reserves months
- —
- Total cash needed
- —
Loan-product check · same deal, 3 products live
Conventional
25% down · 7.5% · 30yr
- Down + closing
- —
- Monthly P&I
- —
- Monthly cashflow
- —
- DSCR
- —
- Eligible?
- —
Personal DTI + credit; lowest rate.
DSCR
20% down · 8.5% · 30yr
- Down + closing
- —
- Monthly P&I
- —
- Monthly cashflow
- —
- DSCR
- —
- Eligible?
- —
No personal income docs; deal must DSCR.
Hard money
10% down · 12.0% · 12mo
- Down + closing
- —
- Monthly P&I
- —
- Monthly cashflow
- —
- DSCR
- —
- Eligible?
- —
Short-term bridge; refi at stabilization.
Listing history 17 events
-
2026-06-18days on market $44,900 Active 50 DOM
-
2026-06-17days on market $44,900 Active 49 DOM
-
2026-06-16days on market $44,900 Active 48 DOM
-
2026-06-15days on market $44,900 Active 47 DOM
-
2026-06-14days on market $44,900 Active 45 DOM
-
2026-06-10days on market $44,900 Active 42 DOM
-
2026-06-09days on market $44,900 Active 41 DOM
-
2026-06-08days on market $44,900 Active 40 DOM
-
2026-06-07days on market $44,900 Active 39 DOM
-
2026-06-05days on market $44,900 Active 36 DOM
-
2026-06-03days on market $44,900 Active 35 DOM
-
2026-06-02days on market $44,900 Active 34 DOM
-
2026-06-01days on market $44,900 Active 33 DOM
-
2026-05-31days on market $44,900 Active 32 DOM
-
2026-05-31days on market $44,900 Active 31 DOM
-
2026-04-28$44,900 Active 244-char remark
Show marketing remark (244 chars)
Longing to get away from the hustle and bustle then try something different. This 3 bedroom 1 bath offers a quiet lifestyle shady by trees just outside Greensburg. Older home needing some tender care, but lots of potential. Large lot in Zone X.
ⓘ Source: listings_history table (triggers on properties + properties_extension) + one-shot
backfill from property_details.listing_events for pre-trigger history.
Tax reassessment forecast LA · Resets to sale price
- Current annual tax
- $546 · $46/mo
- Projected year-2 tax
- $546 · $46/mo
- Expected delta
- $0/yr ($0/mo · 0.0%)
ⓘ Screening estimate from a state-policy table — verify with the county assessor before closing.
Nearby sold comps map
Loading sold comps map…
Walkable amenities ~0.75 mi
Loading nearby amenities…
Taxation est. · year 1
- Rental income
- $12,322
- − Mortgage interest
- −$2,515
- − Property taxes
- −$546
- − Insurance
- −$224
- − Repairs & maintenance
- −$986
- − Management
- −$986
- − Depreciation
- −$1,306
- Taxable income
- $5,758
- Est. tax owed @ 24.0%
- −$1,382
- After-tax cash flow
- $4,756/yr
For passive investors: Depreciation is non-cash, so a rental often shows a tax loss while cash-flowing — sheltering income. Rental losses are passive: they offset passive income freely, and up to $25,000/yr can offset ordinary (W-2) income if you actively participate and your MAGI is under $100k (phasing out to $0 by $150k); unused losses carry forward. On sale, claimed depreciation is recaptured at up to 25%, and gains may owe capital-gains tax (a 1031 exchange can defer both). Figures are a year-1 estimate at your 24.0% rate — not tax advice; consult a CPA.
Schools (NCES district)
- District
- St. Helena Parish
- NCES district ID
- 2201470
- Math proficiency
- 5% ▼ -14.00%
- Reading proficiency
- 11% ▼ -24.00%
- Median HH income
- $34,927
- Composite
- 6.5/100
- National rank
- #9992
- State rank
- #95 of 98 in LA
Livability — Greensburg
- Score
- 63/100
- State rank
- #185
- US rank
- #14872
Category grades
Schools grade is shown separately in the Schools card above.
Census & demographics
- Population (ZIP)
- 6,074
Population outlook (St. Helena County) Hauer SSP2
- Today (2025)
- 9,813 people
- By 2030
- 9,345 · -4.8%
- By 2040
- 8,221 · -16.2%
- By 2050
- 7,194 · -26.7%
- By 2075
- 5,640 · -42.5%
- By 2100
- 4,813 · -51.0%
Race, ethnicity, and origin ACS 2023
- Neighborhood character
- Majority Black (63%)
- Race & ethnicity
- Black 63% White 32% Hispanic / Latino 3%
- Common ancestry
- Lithuanian 5% Serbian 1%
- Foreign-born
- 4% · Canada, China
- Languages at home
- 94% English-only · Spanish 4% Chinese 1% French/Haitian/Cajun 1%
Political lean MEDSL · St. Helena
- 2024 margin
- Toss-up / Even · D 49.6% · R 48.8% · Other 1.6%
- 2008→2024 swing
- -16.1pp toward R · 2008: 16.9pp · 2024: 0.8pp
- All cycles
- 2024: D+0.8 2020: D+10.3 2016: D+14.3 2012: D+20.8 2008: D+16.9
Not yet ingested
- Civics
- —
Market trends
- HPI YoY
- —
- Current HPI
- —
- Rent YoY
- —
- Metro
- —
- State GDP YoY
- ▲ 3.29%
- F500 in state
- 10
Industry mix (Fortune 500 HQ in LA)
| Industry | F500 HQs | Revenue |
|---|---|---|
| Telecommunications | 2 | $23B |
|
||
| Utilities | 1 | $12B |
|
||
| Wholesale / Distribution | 1 | $5B |
|
||
| Advertising | 1 | $2B |
|
||
Price history
+0.0% since first listed2 events — show timeline
- 2026-04-28 Listed $44,900 AcadianaMLS
- 2026-04-28 Listed $44,900 GSREIN
Property tax history
+2.3%/yrLatest (2025): $546 · +1.3% YoY. Source: county tax records.
Cash-flow waterfall
monthlySold comps — $/sqft
last 12 mo · ≤1 miLoading sold comps…