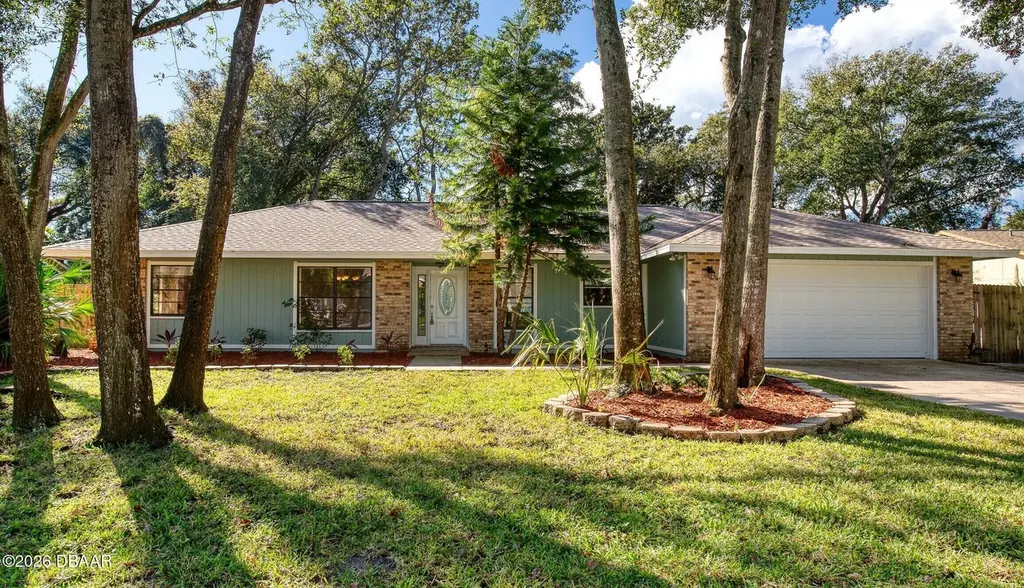
1116 Sherbourne Way · Ormond Beach, FL
Flood risk 9/10 · Severe
- FEMA flood zone
- X (shaded)
- Chance of flooding over 30 yrs
- 0.99%
- Est. flood insurance / yr
- $507 – $1,088
Fire risk 2/10 · Minimal
- Est. fire insurance / yr
- $947 – $1,759
Heat risk 9/10 · Severe
- Hot days now (above 105°F)
- 7 days/yr
- Hot days in 30 yrs
- 20 days/yr
Wind risk 10/10 · Severe
- Chance of severe wind over 30 yrs
- 99.0%
Air-quality risk 3/10 · Minor
- Unhealthy air days now
- 3 days/yr
- Unhealthy air days in 30 yrs
- 3 days/yr
Risk factors via First Street. Map © Google.
Why this score? — see what drove the C- grade
The composite is a weighted blend of 9 inputs, each scored 0–100. Each bar is that input's sub-score; the figure is the points it added to the 100-point composite (weight × sub-score).
- Cash flow +20.9/30.0
- ARV discount +7.5/15.0
- DSCR +6.6/10.0
- 1% rule +5.0/10.0
- Livability +4.2/5.0
- Schools +3.9/10.0
- Rent growth +2.9/5.0
- Condition / age +2.5/5.0
- Appreciation +0.0/10.0
$374,900
🖨 Deal sheet 📄 Offer letter ✓ Due diligence
Listing remarks MLS
Park your RV or boat, you are home. 44' concrete pad behind fence. Min. clearance is 10'6''. Inside, upgrades throughout, gourmet kitchen, updated baths with new cabinets and fixtures, new carpet . .. This home is a must see.
Key facts
- 9,200 sq ft lot
- 2 garage spots
- Built 1982
Neighborhood map
What this means for you Summary
Snapshot
- This is a 3-bed/2.0-bath single-family listed at $375k.
Deal economics
- At list price, monthly cash flow is $454 ($5k/yr) — positive.
- The deal already cash-flows at list — no discount required.
- To meet the 1% rule (rent ≥ 1% of price), the offer needs to be $374k (0.3% below list).
- Recommended offer: $374k (0.3% below list) — sets the bar for 1% rule.
- Cap rate 8.0% vs local median 3.9% in Ormond Beach — top-decile yield for the area; either an underpriced asset or a hidden risk that comps aren't pricing in. Stress-test before assuming the spread holds.
Location & tenants
- Location reads 83/100 on livability (#55 in FL, #965 nationally) — a professional / high-income tenant draw. Strengths: amenities A+, housing A+, health & safety A+; Watch: commute F.
- Volusia (suburban): math 44% / reading 49% proficiency, ranked #47 of 73 in FL (top 64%) — families likely to look elsewhere, expect single-tenant / working-renter base with shorter leases.
- Zoned schools: Pine Trail Elementary School (math 77% / reading 72%, grade A, #230 of 2,144 statewide, top 12%, 688 students, 45% FRL); Ormond Beach Middle School (math 57% / reading 55%, grade B-, #175 of 571 statewide, top 31%, 990 students, 48% FRL); Seabreeze High School (math 31% / reading 56%, grade F, #248 of 667 statewide, top 38%, 1,654 students, 41% FRL).
- Market conditions: Rents rising (+1.6%/yr); 985 active listings in the ZIP; 8 comparable units currently listed for rent nearby; rentals at typical pace (median 19d on market — plan ~3-4 weeks tenant-placement turnaround); 3,402 units permitted in Volusia County in 2024 (681 in 5+ unit buildings).
- At $3,739/mo this rent would consume 63% of the median local household income ($71k/yr) (locally 1158% of renters already pay >50% of income on rent) — very limited rent-growth headroom before tenants either downsize or default.
Forward outlook
- Local home prices are declining (-3.0%/yr); year-one equity from $3k of loan paydown is wiped out by about $11k of value loss. Plan a longer hold.
- Volusia County population projected at +19% by 2050 — long-run rental-demand tailwind backs the buy-and-hold thesis.
Negotiation context
- Only 0 days on market — expect competitive offers; lowballing is unlikely to land.
- 3 sale attempts since 8y ago with the ask held roughly flat each time — persistent listings suggest the price (not the market) is what's stuck; bring a comps-based counter.
- Current owner paid $280k; 34% above their basis — modest negotiation headroom, anchor on the comps not their cost.
Risks & watch-outs
- Watch-outs: flood insurance adds $66/mo.
- Climate carrying-cost: severe flood risk; severe wind risk, 99% chance of damaging wind over 30y; extreme-heat days projected 7→20/yr by 2055 (HVAC capex compounding) — expect insurance premiums to compound above CPI over the hold.
Questions for the listing agent
- What's the actual annual flood-insurance premium (NFIP or private), and is the property in a SFHA with mandatory coverage?
- Is there a deadline driving the sale (1031 exchange, divorce, estate, relocation)? That informs how much negotiation room exists.
- Schools are B-rated — typically a magnet for longer-tenancy family renters. What's the average tenant stay here, and is there a school-zone premium baked into asking?
- What's the average days-on-market for RENTAL listings here right now (not sales)? A rising rental-DOM trend means longer vacancies and softer asking-rent achievability than the comps imply.
- What's the recent tenant-quality profile in this submarket — average credit score on applications, eviction rate, late-payment / NSF rate, and stable-employment percentage? A property-management company in the area should have these aggregated.
- How much new for-sale + rental construction is in the pipeline within 1–3 miles? Heavy new supply typically softens prices + rents 12–24 months out; constrained supply supports both.
Investment metrics
- 1% rule
- 1.00% ✗
- Cap rate
- 7.96%
- Cash-on-cash
- 5.95%
- DSCR
- 1.26
- GRM
- 8.4
CMA / ARV
No comps found within radius.
Projected returns pro-forma
-3.0% appreciation · 1.64% rent growth · sell at horizon
- IRR
- -9.7%
- Equity multiple
- 0.65×
- Total profit
- $-36,871
- Equity at exit
- $55,899
- IRR
- -2.2%
- Equity multiple
- 0.86×
- Total profit
- $-15,013
- Equity at exit
- $32,415
Cash invested: $104,972 (down + closing). Projections, not guarantees.
Landlord ↔ Tenant lean methodology
- Overall (STATE)
- 87 Strongly Landlord-Friendly
- State Florida
- 87 Strongly Landlord-Friendly · R+3
- County
- — inherits STATE
- City
- — inherits STATE
ZIP-level market 32174
- Rents YoY
- 1.6%
- Active inventory
- 985
- Price-to-rent
- 8.4×
Monthly cashflow live
- Estimated rent
- $3,739 high interval (Pro) →
- Mortgage (P&I)
- −$1,966
- Tax from tax record
- −$311 /mo · $3,731/yr
- Insurance
- −$156
- Flood insurance flood zone
- −$66 /mo · $798/yr
- HOA
- −$0
- Vacancy / Maint / Mgmt
- −$785
- Net cashflow
- $454
Break-even live
UW: 25.0% down · 7.5% · 30yr · 1.5% tax · 5.0% vac · 8.0% maint · 8.0% mgmt
Financing live
Cash to close
- Down payment
- $93,725
- Closing costs
- $11,247
- Reserves months
- —
- Total cash needed
- —
Loan-product check · same deal, 3 products live
Conventional
25% down · 7.5% · 30yr
- Down + closing
- —
- Monthly P&I
- —
- Monthly cashflow
- —
- DSCR
- —
- Eligible?
- —
Personal DTI + credit; lowest rate.
DSCR
20% down · 8.5% · 30yr
- Down + closing
- —
- Monthly P&I
- —
- Monthly cashflow
- —
- DSCR
- —
- Eligible?
- —
No personal income docs; deal must DSCR.
Hard money
10% down · 12.0% · 12mo
- Down + closing
- —
- Monthly P&I
- —
- Monthly cashflow
- —
- DSCR
- —
- Eligible?
- —
Short-term bridge; refi at stabilization.
Rent comps 8 comps
| Address | Beds | Baths | Sqft | Rent | $/sqft | DOM | Units | Dist |
|---|---|---|---|---|---|---|---|---|
| 1286 John Anderson Dr Ormond Beach, FL | 3.0 | 3.5 | 2322 | $9,999 | $4.31 | 14d | 1 | 0.89mi |
| 157 Longwood Dr Unit 1545681P Ormond Beach, FL | 2.0 | 2.0 | 1280 | $4,032 | $3.15 | 14d | 1 | 1.01mi |
| 23 Hibiscus Dr Ormond Beach, FL | 2.0 | 1.5 | 1350 | $1,795 | $1.33 | 23d | 1 | 1.22mi |
| 8 Tropical Dr Unit 1546317P Ormond Beach, FL | 2.0 | 1.0 | 1248 | $3,902 | $3.13 | 14d | 1 | 1.24mi |
| 206 Ormwood Dr Unit NA Ormond Beach, FL | 4.0 | 3.0 | 2424 | $3,500 | $1.44 | 23d | 1 | 1.30mi |
| 1633 John Anderson Dr Ormond Beach, FL | 2.0 | 1.0 | 1356 | $2,250 | $1.66 | 23d | 1 | 1.31mi |
| 1415 Ocean Shore Blvd Ormond Beach, FL | 1.0–2.0 | 1.0–2.0 | 1031 | $2,500 | $2.42 | 14d | 1 | 1.46mi |
| 1425 Ocean Shore Blvd #501 Ormond Beach, FL | 3.0 | 3.0 | 2515 | $3,100 | $1.23 | 19d | 1 | 1.47mi |
Listing history 2 events
-
2026-06-01remarks 30-char remark
-
2026-06-01$374,900 Pending
ⓘ Source: listings_history table (triggers on properties + properties_extension) + one-shot
backfill from property_details.listing_events for pre-trigger history.
Tax reassessment forecast FL · Resets to sale price
- Current annual tax
- $3,731 · $311/mo
- Projected year-2 tax
- $3,731 · $311/mo
- Expected delta
- $0/yr ($0/mo · 0.0%)
ⓘ Screening estimate from a state-policy table — verify with the county assessor before closing.
Climate risk First Street
- Flood 9/10 Extreme FEMA zone X (shaded) · 99% chance over 30 yrs
- Wildfire 2/10 Low
- Heat 9/10 Extreme 7 d/yr ≥105°F today · 20 d/yr by 30 yrs out
- Wind 10/10 Extreme 99% chance of damaging wind over 30 yrs
- Air quality 3/10 Moderate 3 unhealthy d/yr today · 3 by 30 yrs out
Nearby sold comps map
Loading sold comps map…
Walkable amenities ~0.75 mi
Loading nearby amenities…
Taxation est. · year 1
- Rental income
- $44,867
- − Mortgage interest
- −$21,000
- − Property taxes
- −$3,731
- − Insurance
- −$2,672
- − Repairs & maintenance
- −$3,589
- − Management
- −$3,589
- − Depreciation
- −$10,906
- Taxable loss
- −$621
- Est. tax savings @ 24.0%
- +$149
- After-tax cash flow
- $5,599/yr
For passive investors: Depreciation is non-cash, so a rental often shows a tax loss while cash-flowing — sheltering income. Rental losses are passive: they offset passive income freely, and up to $25,000/yr can offset ordinary (W-2) income if you actively participate and your MAGI is under $100k (phasing out to $0 by $150k); unused losses carry forward. On sale, claimed depreciation is recaptured at up to 25%, and gains may owe capital-gains tax (a 1031 exchange can defer both). Figures are a year-1 estimate at your 24.0% rate — not tax advice; consult a CPA.
Schools (NCES district)
- District
- Volusia
- NCES district ID
- 1201920
- Math proficiency
- 44% ▼ -9.00%
- Reading proficiency
- 49% ▼ -3.00%
- Median HH income
- $42,946
- Composite
- 39.2/100
- National rank
- #4019
- State rank
- #47 of 73 in FL
Livability — Ormond Beach
- Score
- 83/100
- State rank
- #55
- US rank
- #965
Category grades
Schools grade is shown separately in the Schools card above.
Census & demographics
- Census place
- Ormond Beach, FL
- County
- Volusia County · 556,871 people
- City population
- 69,624
- Metro
- Deltona-Daytona Beach-Ormond Beach, FL
- Population (ZIP)
- 54,783
- Household income
- $71,011
- Rent vs Own
- Severe rent burden
- 1158.0
Population outlook (Volusia County) Hauer SSP2
- Today (2025)
- 572,749 people
- By 2030
- 598,695 · +4.5%
- By 2040
- 644,880 · +12.6%
- By 2050
- 681,451 · +19.0%
- By 2075
- 759,957 · +32.7%
- By 2100
- 778,902 · +36.0%
Race, ethnicity, and origin ACS 2023
- Neighborhood character
- Predominantly White (82%)
- Race & ethnicity
- White 82% Black 6% Hispanic / Latino 5% Two or more races 5% Asian 3%
- Hispanic origin (detail)
- Puerto Rican 2%
- Common ancestry
- Romanian 4% Lithuanian 3% Slovak 3%
- Foreign-born
- 7% · Canada, China
- Languages at home
- 91% English-only · Spanish 3% Other Indo-European 1% German/W. Germanic 1%
Political lean MEDSL · Volusia
- 2024 margin
- Strong R (+21.8) · D 38.7% · R 60.5%
- 2008→2024 swing
- -27.4pp toward R · 2008: 5.7pp · 2024: -21.8pp
- All cycles
- 2024: R+21.8 2020: R+14.1 2016: R+13.1 2012: R+1.2 2008: D+5.7
Not yet ingested
- Civics
- —
Market trends
- HPI YoY
- ▼ -327.97%
- Current HPI
- 271.92
- Rent YoY
- ▲ 1.64%
- Metro
- Deltona-Daytona Beach-Ormond Beach, FL
- State GDP YoY
- ▲ 3.28%
- F500 in state
- 36
Industry mix (Fortune 500 HQ in FL)
| Industry | F500 HQs | Revenue |
|---|---|---|
| Industrial Technology | 2 | $29B |
|
||
| Insurance | 2 | $17B |
|
||
| Retail | 1 | $60B |
|
||
| Technology Distribution | 1 | $58B |
|
||
| Homebuilding | 1 | $35B |
|
||
| Technology Manufacturing | 1 | $35B |
|
||
Price history
+349.0% since first listed12 events — show timeline
- 2026-05-30 Listing Removed — Daytona MLS
- 2026-05-29 Listed $374,900 Daytona MLS
- 2021-01-05 Sold (Public Records) $280,000 Public Records
- 2020-12-30 Sold (MLS) $280,000 Daytona MLS
- 2020-11-30 Contingent — Daytona MLS
- 2020-11-21 Listed $285,000 Daytona MLS
- 2018-12-22 Listing Removed — Daytona MLS
- 2018-03-06 Listed $258,000 Daytona MLS
- 1991-07-01 Sold (Public Records) $97,000 Public Records
- 1985-06-01 Sold (Public Records) $85,000 Public Records
- 1984-12-01 Sold (Public Records) $98,000 Public Records
- 1983-02-01 Sold (Public Records) $83,500 Public Records
Property tax history
+4.2%/yrLatest (2025): $3,731 · +4.2% YoY. Source: county tax records.
Cash-flow waterfall
monthlySold comps — $/sqft
last 12 mo · ≤1 miLoading sold comps…