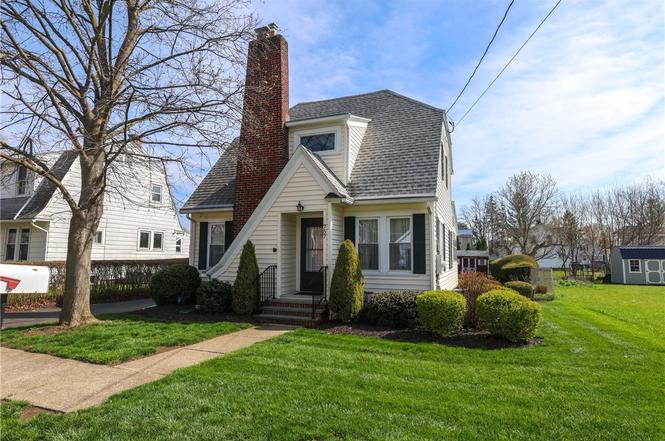
757 Spruce St · Southport, NY
Flood risk 6/10 · Moderate
- FEMA flood zone
- X
- Chance of flooding over 30 yrs
- 0.73%
- Est. flood insurance / yr
- $473 – $860
Fire risk 1/10 · Minimal
- Est. fire insurance / yr
- $691 – $1,283
Heat risk 3/10 · Minor
- Hot days now (above 94°F)
- 7 days/yr
- Hot days in 30 yrs
- 16 days/yr
Wind risk 2/10 · Minimal
- Chance of severe wind over 30 yrs
- 1.0%
Air-quality risk 1/10 · Minimal
- Unhealthy air days now
- 0 days/yr
- Unhealthy air days in 30 yrs
- 0 days/yr
Risk factors via First Street. Map © Google.
Why this score? — see what drove the D- grade
The composite is a weighted blend of 9 inputs, each scored 0–100. Each bar is that input's sub-score; the figure is the points it added to the 100-point composite (weight × sub-score).
- Cash flow +17.2/30.0
- DSCR +5.4/10.0
- 1% rule +3.9/10.0
- Livability +3.2/5.0
- Rent growth +2.5/5.0
- Condition / age +2.5/5.0
- Schools +2.4/10.0
- ARV discount +0.0/15.0
- Appreciation +0.0/10.0
$165,000
🖨 Deal sheet (PDF) 📄 Offer letter ✓ Due diligence
Listing remarks
Please take a look at this impeccably maintained home in charming Southport. Located just minutes from parks, grocery shopping, restaurants, schools and a garden center, this home has easy access to all of the conveniences of contemporary living. The pride of ownership is evident with this beautiful residence. The interior has many updates and has been beautifully maintained The first floor living spaces are large and have a great flow that extends to the outdoor deck. Great for hosting family and friends. The bedroom on the ground floor is a great convenience as is the first floor bath. On the second floor are two more spacious bedrooms and and additional bathroom. Some of the many update
Key facts
- First floor bath
- Ground floor bedroom
- New flooring
Tags
Property features AI
Exterior
- Parking: Detached garage; Carport
- Utilities: Public water connected; Sewer connected
- Home design: One-story property; Existing construction
- Construction: Vinyl siding; Attic/crawl hatchway(s) insulated; Block foundation
- Exterior features: Blacktop driveway; Rectangular residential lot; City street frontage; Lot dimensions approximately 50 x 128
Interior
- Kitchen: Electric oven; Electric range; Dishwasher; Refrigerator
- Bedrooms: 1 main-level bedroom
- Flooring: Carpet; Hardwood; Laminate; Vinyl; Varies
- Bathrooms: 2 full bathrooms; 1 main-level bathroom
- Heating & cooling: Gas heat; Central air conditioning
- Interior features: Den; Separate/formal dining room; Bedroom on main level; Partial basement; Fireplace (1)
- Laundry & utility: Washer; Dryer; Electric water heater
Neighborhood map
What this means for you Summary
Snapshot
- This is a 2-bed/2.0-bath single-family listed at $165k.
Deal economics
- At list price, monthly cash flow is $119 ($1k/yr) — positive.
- The deal already cash-flows at list — no discount required.
- To meet the 1% rule (rent ≥ 1% of price), the offer needs to be $147k (10.9% below list).
- Recommended offer: $147k (10.9% below list) — sets the bar for 1% rule.
Location & tenants
- Location reads 65/100 on livability (#690 in NY) — a middle-class / working-renter tenant base. Strengths: cost of living A+, housing A; Watch: employment D, health & safety D, crime D-.
- Elmira City School District (urban): math 23% / reading 35% proficiency, ranked #580 of 590 in NY (top 98%) — low school quality limits family demand, transient renter base, plan for 1-2y turnover.
- Zoned schools: Ernie Davis Academy (math 5% / reading 31%, grade F, #691 of 729 statewide, top 95%, 802 students, 66% FRL).
- Market conditions: 104 active listings in the ZIP; 5 comparable units currently listed for rent nearby; rentals lingering (median 46d on market — plan ~5-8 weeks vacancy on turnover, expect pricing pressure); 100% of comp listings sitting > 30 days — soft ceiling on asking rent; 91 units permitted in Chemung County in 2024 (63 in 5+ unit buildings).
Forward outlook
- Local home prices are declining (-3.0%/yr); year-one equity from $1k of loan paydown is wiped out by about $5k of value loss. Plan a longer hold.
- Chemung County population projected at -17% by 2050 — secular population decline; favor cash flow + early exit over multi-decade hold.
Negotiation context
- It's been on market 49 days — a 3% lower offer ($160k) is reasonable based on typical stale-listing flexibility.
- 2 sale attempts with the ask held roughly flat each time — persistent listings suggest the price (not the market) is what's stuck; bring a comps-based counter.
Risks & watch-outs
- Watch-outs: built in 1920 — expect roof / HVAC / electrical / plumbing capex.
- Climate carrying-cost: major flood risk — expect insurance premiums to compound above CPI over the hold.
Questions for the listing agent
- It's been on market 49 days. Have you received any prior offers? Is the seller open to a 11% concession, seller financing, or rate buy-down credit?
- Built in 1920 — when were the roof, HVAC, electrical panel, plumbing, and water heater last replaced?
- Is there a deadline driving the sale (1031 exchange, divorce, estate, relocation)? That informs how much negotiation room exists.
- Schools are D-rated, which usually means shorter tenancies and higher turnover. Who's the typical renter profile here, and what's been the actual vacancy rate?
- Crime grade is D in this area — have there been break-ins, vandalism, or insurance claims at this property in the last 3 years? What carrier currently insures it and at what premium?
- The area grade is low — what's the realistic commute time and amenity access for the typical tenant pool here? Any planned neighborhood developments (good or bad) we should know about?
- What's the average days-on-market for RENTAL listings here right now (not sales)? A rising rental-DOM trend means longer vacancies and softer asking-rent achievability than the comps imply.
- What's the recent tenant-quality profile in this submarket — average credit score on applications, eviction rate, late-payment / NSF rate, and stable-employment percentage? A property-management company in the area should have these aggregated.
- How much new for-sale + rental construction is in the pipeline within 1–3 miles? Heavy new supply typically softens prices + rents 12–24 months out; constrained supply supports both.
Investment metrics
- 1% rule
- 0.89% ✗
- Cap rate
- 7.16%
- Cash-on-cash
- 3.10%
- DSCR
- 1.14
- GRM
- 9.4
CMA / ARV
- ARV (on-the-fly)
- $137,592
- Comps found
- 12
Show comp detail 12 sales within ~0.75 mi
| Address | Dist | Beds/Ba | Sqft | Sold | Price | $/sf | Match |
|---|---|---|---|---|---|---|---|
| 815 Spruce St | 0.22mi | 3/1.5 (+1) | 1,402 (-0%) | 9mo | $180,000 | $128 | 75 |
| 712 Cypress | 0.14mi | 3/1.0 (+1) | 1,446 (+3%) | 10mo | $141,000 | $98 | 72 |
| 825 Broadway St | 0.04mi | 3/1.0 (+1) | 1,271 (-10%) | 5mo | $65,000 | $51 | 70 |
| 760 Spruce St | 0.03mi | 3/1.0 (+1) | 1,523 (+8%) | 10mo | $112,000 | $74 | 67 |
| 825 Hazel St | 0.25mi | 3/1.5 (+1) | 1,500 (+7%) | 4mo | $150,000 | $100 | 66 |
| 570 Cypress St | 0.29mi | 3/1.0 (+1) | 1,307 (-7%) | 1mo | $127,200 | $97 | 65 |
| 810 Sycamore St | 0.23mi | 2/1.0 | 1,544 (+10%) | 7mo | $125,000 | $81 | 63 |
| 562 Baty St | 0.43mi | 3/1.0 (+1) | 1,296 (-8%) | 5mo | $111,702 | $86 | 54 |
| 551 Lyon St | 0.43mi | 3/1.0 (+1) | 1,586 (+13%) | 3mo | $158,000 | $100 | 47 |
| 1017 Smith St | 0.60mi | 3/2.0 (+1) | 1,250 (-11%) | 5mo | $132,979 | $106 | 45 |
| 461 Beecher St | 0.51mi | 3/2.0 (+1) | 1,584 (+13%) | 8mo | $220,000 | $139 | 44 |
| 609 Mount Zoar St | 0.71mi | 3/1.0 (+1) | 1,290 (-8%) | 9mo | $72,250 | $56 | 37 |
Match score weights: distance 35% · size 25% · config 20% · recency 20%. Top-matched comps best support the ARV.
Projected returns pro-forma
-3.0% appreciation · 3.0% rent growth · sell at horizon
- IRR
- -11.4%
- Equity multiple
- 0.58×
- Total profit
- $-19,182
- Equity at exit
- $24,602
- IRR
- -2.3%
- Equity multiple
- 0.85×
- Total profit
- $-7,081
- Equity at exit
- $14,266
Cash invested: $46,200 (down + closing). Projections, not guarantees.
Landlord ↔ Tenant lean methodology
- Overall (STATE)
- 15 Strongly Tenant-Friendly
- State New York
- 15 Strongly Tenant-Friendly · D+10
- County
- — inherits STATE
- City
- — inherits STATE
ZIP-level market 14904
- Home prices YoY
- -9.6%
- Active inventory
- 104
- Price-to-rent
- 9.4×
Monthly cashflow live
- Estimated rent
- $1,470 medium interval (Pro) →
- Mortgage (P&I)
- −$865
- Tax from tax record
- −$108 /mo · $1,294/yr
- Insurance
- −$69
- HOA
- −$0
- Vacancy / Maint / Mgmt
- −$309
- Net cashflow
- $119
Break-even live
Sensitivity live
| Price | -10% $213 | -5% $166 | +0% $119 | +5% $73 | +10% $26 |
|---|---|---|---|---|---|
| Rent | -10% $3 | -5% $61 | +0% $119 | +5% $177 | +10% $235 |
| Rate | -1.0pp $202 | -0.5pp $161 | base $119 | +0.5pp $76 | +1.0pp $33 |
UW: 25.0% down · 7.5% · 30yr · 1.5% tax · 5.0% vac · 8.0% maint · 8.0% mgmt
Financing live
Cash to close
- Down payment
- $41,250
- Closing costs
- $4,950
- Reserves months
- —
- Total cash needed
- —
Loan-product check · same deal, 3 products live
Conventional
25% down · 7.5% · 30yr
- Down + closing
- —
- Monthly P&I
- —
- Monthly cashflow
- —
- DSCR
- —
- Eligible?
- —
Personal DTI + credit; lowest rate.
DSCR
20% down · 8.5% · 30yr
- Down + closing
- —
- Monthly P&I
- —
- Monthly cashflow
- —
- DSCR
- —
- Eligible?
- —
No personal income docs; deal must DSCR.
Hard money
10% down · 12.0% · 12mo
- Down + closing
- —
- Monthly P&I
- —
- Monthly cashflow
- —
- DSCR
- —
- Eligible?
- —
Short-term bridge; refi at stabilization.
Rent comps 5 comps
| Address | Beds | Baths | Sqft | Rent | $/sqft | DOM | Units | Dist |
|---|---|---|---|---|---|---|---|---|
| 550 Spruce St Unit 303 Elmira, NY | 2.0 | 2.0 | 1350 | $1,350 | $1.00 | 45d | 1 | 0.37mi |
| 419 Jefferson St Unit A Elmira, NY | 2.0 | 2.0 | 1100 | $1,995 | $1.81 | 45d | 1 | 0.79mi |
| 1254 Charles St Elmira, NY | 2.0 | 1.0 | 1560 | $1,350 | $0.87 | 45d | 1 | 1.16mi |
| 160 Boardman St Unit B Elmira, NY | 2.0 | 1.0 | 1727 | $800 | $0.46 | 45d | 1 | 1.18mi |
| 363 W Water St #2 Elmira, NY | 3.0 | 1.0 | 1084 | $1,250 | $1.15 | 45d | 1 | 1.43mi |
Listing history 23 events
-
2026-06-22days on market $165,000 Active 49 DOM
-
2026-06-21days on market $165,000 Active 48 DOM
-
2026-06-19days on market $165,000 Active 46 DOM
-
2026-06-18days on market $165,000 Active 45 DOM
-
2026-06-17status $165,000 Active 44 DOM
-
2026-06-17days on market $165,000 Active Under Contract 44 DOM
-
2026-06-16days on market $165,000 Active Under Contract 43 DOM
-
2026-06-15days on market $165,000 Active Under Contract 42 DOM
-
2026-06-14days on market $165,000 Active Under Contract 40 DOM
-
2026-06-12days on market $165,000 Active Under Contract 39 DOM
-
2026-06-09days on market $165,000 Active Under Contract 36 DOM
-
2026-06-08days on market $165,000 Active Under Contract 35 DOM
-
2026-06-07days on market $165,000 Active Under Contract 34 DOM
-
2026-06-05days on market $165,000 Active Under Contract 31 DOM
-
2026-06-03days on market $165,000 Active Under Contract 30 DOM
-
2026-06-02days on market $165,000 Active Under Contract 29 DOM
-
2026-06-01days on market $165,000 Active Under Contract 28 DOM
-
2026-05-31days on market $165,000 Active Under Contract 27 DOM
-
2026-05-30days on market $165,000 Active Under Contract 26 DOM
-
2026-05-13historical Active Under Contract
-
2026-05-08status Active
-
2026-04-24status Pending
-
2026-04-20$165,000 Active
ⓘ Source: listings_history table (triggers on properties + properties_extension) + one-shot
backfill from property_details.listing_events for pre-trigger history.
Tax reassessment forecast NY · Partial reset (capped growth)
- Current annual tax
- $1,294 · $108/mo
- Projected year-2 tax
- $2,041 · $170/mo
- Expected delta
- +$747/yr (+$62/mo · 57.7%)
ⓘ Screening estimate from a state-policy table — verify with the county assessor before closing.
Climate risk First Street
- Flood 6/10 Major FEMA zone X · 73% chance over 30 yrs
- Wildfire 1/10 Low
- Heat 3/10 Moderate 7 d/yr ≥94°F today · 16 d/yr by 30 yrs out
- Wind 2/10 Low 100% chance of damaging wind over 30 yrs
- Air quality 1/10 Low 0 unhealthy d/yr today · 0 by 30 yrs out
Nearby sold comps map
Loading sold comps map…
Walkable amenities ~0.75 mi
Loading nearby amenities…
Taxation est. · year 1
- Rental income
- $17,637
- − Mortgage interest
- −$9,243
- − Property taxes
- −$1,294
- − Insurance
- −$825
- − Repairs & maintenance
- −$1,411
- − Management
- −$1,411
- − Depreciation
- −$4,800
- Taxable loss
- −$1,347
- Est. tax savings @ 24.0%
- +$323
- After-tax cash flow
- $1,754/yr
For passive investors: Depreciation is non-cash, so a rental often shows a tax loss while cash-flowing — sheltering income. Rental losses are passive: they offset passive income freely, and up to $25,000/yr can offset ordinary (W-2) income if you actively participate and your MAGI is under $100k (phasing out to $0 by $150k); unused losses carry forward. On sale, claimed depreciation is recaptured at up to 25%, and gains may owe capital-gains tax (a 1031 exchange can defer both). Figures are a year-1 estimate at your 24.0% rate — not tax advice; consult a CPA.
Schools (NCES district)
- District
- Elmira City School District
- NCES district ID
- 3610560
- Math proficiency
- 23% ▼ -7.00%
- Reading proficiency
- 35% ▲ 7.00%
- Median HH income
- $40,180
- Composite
- 24.39/100
- National rank
- #7688
- State rank
- #580 of 590 in NY
Livability — Southport
- Score
- 65/100
- State rank
- #690
- US rank
- #13026
Category grades
Schools grade is shown separately in the Schools card above.
Census & demographics
- Census place
- Southport, NY
- Population (ZIP)
- 14,276
Population outlook (Chemung County) Hauer SSP2
- Today (2025)
- 82,931 people
- By 2030
- 80,356 · -3.1%
- By 2040
- 74,745 · -9.9%
- By 2050
- 69,012 · -16.8%
- By 2075
- 55,689 · -32.8%
- By 2100
- 41,428 · -50.0%
Race, ethnicity, and origin ACS 2023
- Neighborhood character
- Predominantly White (83%)
- Race & ethnicity
- White 83% Two or more races 7% Black 7% Hispanic / Latino 5% Native American 1%
- Common ancestry
- Romanian 7% Lithuanian 3% Slovak 2%
- Foreign-born
- 2% · Canada, Jamaica, Dominican Republic
- Languages at home
- 97% English-only · Spanish 2%
Political lean MEDSL · Chemung
- 2024 margin
- R (+16.8) · D 41.6% · R 58.4%
- 2008→2024 swing
- -15.6pp toward R · 2008: -1.2pp · 2024: -16.8pp
- All cycles
- 2024: R+16.8 2020: R+13.4 2016: R+20.0 2012: R+2.9 2008: R+1.2
Not yet ingested
- Civics
- —
Market trends
- HPI YoY
- ▼ -23.33%
- Current HPI
- 220.688
- Rent YoY
- —
- Metro
- —
- State GDP YoY
- ▲ 2.60%
- F500 in state
- 92
Industry mix (Fortune 500 HQ in NY)
| Industry | F500 HQs | Revenue |
|---|---|---|
| Financial Services | 10 | $950B |
|
||
| Consumer Goods | 9 | $162B |
|
||
| Insurance | 4 | $225B |
|
||
| Telecommunications | 2 | $144B |
|
||
| Pharmaceuticals | 2 | $112B |
|
||
| Media / Entertainment | 2 | $69B |
|
||
Price history
4 events — show timeline
- 2026-05-13 Contingent — UNYREIS
- 2026-05-08 Relisted — UNYREIS
- 2026-04-24 Pending — UNYREIS
- 2026-04-20 Listed $165,000 UNYREIS
Property tax history
-3.6%/yrLatest (2025): $1,294 · -44.1% YoY. Source: county tax records.
Cash-flow waterfall
monthlySold comps — $/sqft
last 12 mo · ≤1 miLoading sold comps…