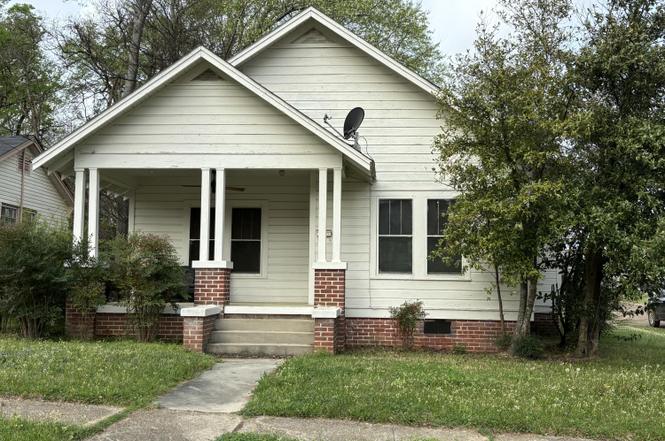
231 Dobson Ave · Canton, MS
Flood risk 1/10 · Minimal
- FEMA flood zone
- X (unshaded)
- Chance of flooding over 30 yrs
- 0.0%
- Est. flood insurance / yr
- $507 – $1,088
Fire risk 3/10 · Minor
- Est. fire insurance / yr
- $1,241 – $2,305
Heat risk 8/10 · Major
- Hot days now (above 109°F)
- 7 days/yr
- Hot days in 30 yrs
- 21 days/yr
Wind risk 7/10 · Major
- Chance of severe wind over 30 yrs
- 78.0%
Air-quality risk 2/10 · Minimal
- Unhealthy air days now
- 0 days/yr
- Unhealthy air days in 30 yrs
- 1 days/yr
Risk factors via First Street. Map © Google.
Why this score? — see what drove the B grade
The composite is a weighted blend of 9 inputs, each scored 0–100. Each bar is that input's sub-score; the figure is the points it added to the 100-point composite (weight × sub-score).
- Cash flow +30.0/30.0
- ARV discount +15.0/15.0
- 1% rule +10.0/10.0
- DSCR +10.0/10.0
- Livability +3.0/5.0
- Rent growth +2.5/5.0
- Condition / age +2.5/5.0
- Schools +1.3/10.0
- Appreciation +0.0/10.0
$99,000
🖨 Deal sheet (PDF) 📄 Offer letter ✓ Due diligence
Listing remarks
Charming 2-bedroom, 1-bath home located less than ¼ mile from Canton's historic square! This inviting home features beautiful original hardwood floors throughout and plenty of character you won't find in newer homes. Situated on a corner lot in a quiet neighborhood, the property offers both charm and convenience. A detached storage shed behind the home provides excellent space that can be used as a garage, workshop, or additional storage. Enjoy being just minutes from the shops, dining, and history of downtown Canton while still having the comfort of a peaceful setting.
Key facts
- Quiet neighborhood
- Corner lot
- 6,098 sq ft lot
Tags
Neighborhood map
What this means for you Summary
Snapshot
- This is a 2-bed/3.0-bath single-family listed at $99k.
Deal economics
- At list price, monthly cash flow is $1k ($13k/yr) — positive.
- The deal already cash-flows at list — no discount required.
- Meets the 1% rule at list price ($2k rent vs $99k).
- Recommended offer: $96k (3.0% below list) — sets the bar for market timing.
- Cap rate 19.2% vs local median 4.3% in Canton — top-decile yield for the area; either an underpriced asset or a hidden risk that comps aren't pricing in. Stress-test before assuming the spread holds.
Location & tenants
- Location reads 60/100 on livability (#229 in MS) — a middle-class / working-renter tenant base. Strengths: cost of living A+, crime B+; Watch: amenities F, commute F, employment F.
- Canton Public School District (rural): math 13% / reading 19% proficiency, ranked #100 of 130 in MS (top 77%) — low school quality limits family demand, transient renter base, plan for 1-2y turnover; 94% free/reduced lunch — lower-income household profile, screen leases tightly.
- Zoned schools: Canton Elementary School (math 12% / reading 17%, grade F, #279 of 375 statewide, top 77%, 391 students, 100% FRL); Huey L. Porter Middle School (math 17% / reading 18%, grade F, #123 of 179 statewide, top 69%, 377 students, 100% FRL).
- Market conditions: 362 active listings in the ZIP; 2 comparable units currently listed for rent nearby; 553 units permitted in Madison County in 2024 (0 in 5+ unit buildings).
Forward outlook
- Local home prices are declining (-3.0%/yr); year-one equity from $684 of loan paydown is wiped out by about $3k of value loss. Plan a longer hold.
- Madison County population projected at +34% by 2050 — long-run rental-demand tailwind backs the buy-and-hold thesis.
- At projected returns (-3.0% appreciation + 3.0% rent growth), your $28k cash investment doubles in ~3 years — after that, you're playing with house money.
Negotiation context
- It's been on market 54 days — a 3% lower offer ($96k) is reasonable based on typical stale-listing flexibility.
- 2 sale attempts since 20y ago with the ask held roughly flat each time — persistent listings suggest the price (not the market) is what's stuck; bring a comps-based counter.
Risks & watch-outs
- Watch-outs: built in 1937 — expect roof / HVAC / electrical / plumbing capex.
- Climate carrying-cost: major wind risk, 78% chance of damaging wind over 30y; extreme-heat days projected 7→21/yr by 2055 (HVAC capex compounding) — expect insurance premiums to compound above CPI over the hold.
Questions for the listing agent
- It's been on market 54 days. Have you received any prior offers? Is the seller open to a 3% concession, seller financing, or rate buy-down credit?
- Built in 1937 — when were the roof, HVAC, electrical panel, plumbing, and water heater last replaced?
- Is there a deadline driving the sale (1031 exchange, divorce, estate, relocation)? That informs how much negotiation room exists.
- Schools are F-rated, which usually means shorter tenancies and higher turnover. Who's the typical renter profile here, and what's been the actual vacancy rate?
- What's the average days-on-market for RENTAL listings here right now (not sales)? A rising rental-DOM trend means longer vacancies and softer asking-rent achievability than the comps imply.
- What's the recent tenant-quality profile in this submarket — average credit score on applications, eviction rate, late-payment / NSF rate, and stable-employment percentage? A property-management company in the area should have these aggregated.
- How much new for-sale + rental construction is in the pipeline within 1–3 miles? Heavy new supply typically softens prices + rents 12–24 months out; constrained supply supports both.
Investment metrics
- 1% rule
- 2.16% ✓
- Cap rate
- 19.17%
- Cash-on-cash
- 46.00%
- DSCR
- 3.05
- GRM
- 3.9
CMA / ARV
- ARV (on-the-fly)
- $140,000
- Comps found
- 6
Show comp detail 6 sales within ~0.75 mi
| Address | Dist | Beds/Ba | Sqft | Sold | Price | $/sf | Match |
|---|---|---|---|---|---|---|---|
| 375 E Fulton St | 0.41mi | 2/1.0 | 1,343 (+7%) | 0mo | $149,900 | $112 | 60 |
| 367 Miller St | 0.49mi | 3/2.0 (+1) | 1,294 (+4%) | 17mo | $145,000 | $112 | 49 |
| 312 Miller St | 0.48mi | 3/1.0 (+1) | 1,100 (-12%) | 12mo | $130,000 | $118 | 34 |
| 232 N West St | 0.75mi | 3/1.0 (+1) | 1,200 (-4%) | 15mo | $90,000 | $75 | 33 |
| 365 S Walnut St | 0.67mi | 3/1.0 (+1) | 1,416 (+13%) | 4mo | $49,900 | $35 | 30 |
| 508 Lyon St | 0.66mi | 3/2.0 (+1) | 1,417 (+13%) | 16mo | $185,000 | $131 | 25 |
Match score weights: distance 35% · size 25% · config 20% · recency 20%. Top-matched comps best support the ARV.
Projected returns pro-forma
-3.0% appreciation · 3.0% rent growth · sell at horizon
- IRR
- 43.2%
- Equity multiple
- 2.86×
- Total profit
- $51,628
- Equity at exit
- $14,761
- IRR
- 49.2%
- Equity multiple
- 5.76×
- Total profit
- $132,078
- Equity at exit
- $8,560
Cash invested: $27,720 (down + closing). Projections, not guarantees.
Landlord ↔ Tenant lean methodology
- Overall (STATE)
- 90 Strongly Landlord-Friendly
- State Mississippi
- 90 Strongly Landlord-Friendly · R+11
- County
- — inherits STATE
- City
- — inherits STATE
ZIP-level market 39046
- Home prices YoY
- -30.1%
- Active inventory
- 362
- Price-to-rent
- 3.9×
Monthly cashflow live
- Estimated rent
- $2,134 medium interval (Pro) →
- Mortgage (P&I)
- −$519
- Tax from tax record
- −$62 /mo · $750/yr
- Insurance
- −$41
- HOA
- −$0
- Vacancy / Maint / Mgmt
- −$448
- Net cashflow
- $1,063
Break-even live
Sensitivity live
| Price | -10% $1,119 | -5% $1,091 | +0% $1,063 | +5% $1,035 | +10% $1,007 |
|---|---|---|---|---|---|
| Rent | -10% $894 | -5% $978 | +0% $1,063 | +5% $1,147 | +10% $1,231 |
| Rate | -1.0pp $1,112 | -0.5pp $1,088 | base $1,063 | +0.5pp $1,037 | +1.0pp $1,011 |
UW: 25.0% down · 7.5% · 30yr · 1.5% tax · 5.0% vac · 8.0% maint · 8.0% mgmt
Financing live
Cash to close
- Down payment
- $24,750
- Closing costs
- $2,970
- Reserves months
- —
- Total cash needed
- —
Loan-product check · same deal, 3 products live
Conventional
25% down · 7.5% · 30yr
- Down + closing
- —
- Monthly P&I
- —
- Monthly cashflow
- —
- DSCR
- —
- Eligible?
- —
Personal DTI + credit; lowest rate.
DSCR
20% down · 8.5% · 30yr
- Down + closing
- —
- Monthly P&I
- —
- Monthly cashflow
- —
- DSCR
- —
- Eligible?
- —
No personal income docs; deal must DSCR.
Hard money
10% down · 12.0% · 12mo
- Down + closing
- —
- Monthly P&I
- —
- Monthly cashflow
- —
- DSCR
- —
- Eligible?
- —
Short-term bridge; refi at stabilization.
Rent comps 2 comps
| Address | Beds | Baths | Sqft | Rent | $/sqft | DOM | Units | Dist |
|---|---|---|---|---|---|---|---|---|
| 102 Rotherfield PL Canton, MS | 3.0 | 2.0 | 1565 | $2,400 | $1.53 | 15d | 1 | 0.27mi |
| 707 Mace St Canton, MS | 2.0–3.0 | 1.0 | 905 | $925 | $1.02 | 15d | 3 | 1.12mi |
Listing history 18 events
-
2026-06-18days on market $99,000 Active 54 DOM
-
2026-06-17days on market $99,000 Active 53 DOM
-
2026-06-16days on market $99,000 Active 52 DOM
-
2026-06-15days on market $99,000 Active 51 DOM
-
2026-06-14days on market $99,000 Active 49 DOM
-
2026-06-13days on market $99,000 Active 48 DOM
-
2026-06-10days on market $99,000 Active 46 DOM
-
2026-06-09days on market $99,000 Active 45 DOM
-
2026-06-08statusdays on market $99,000 Active 44 DOM
-
2026-04-21status Pending
-
2026-03-06$99,000 Active
-
2021-10-01historical
-
2006-06-06$80,000
-
2002-01-24soldstatus
-
2001-02-16soldstatus
-
1996-02-21soldstatus
-
1992-12-17soldstatus
-
1988-07-08soldstatus
ⓘ Source: listings_history table (triggers on properties + properties_extension) + one-shot
backfill from property_details.listing_events for pre-trigger history.
Tax reassessment forecast MS · Resets to sale price
- Current annual tax
- $750 · $62/mo
- Projected year-2 tax
- $782 · $65/mo
- Expected delta
- +$32/yr (+$3/mo · 4.3%)
ⓘ Screening estimate from a state-policy table — verify with the county assessor before closing.
Climate risk First Street
- Flood 1/10 Low FEMA zone X (unshaded) · 0% chance over 30 yrs
- Wildfire 3/10 Moderate
- Heat 8/10 Severe 7 d/yr ≥109°F today · 21 d/yr by 30 yrs out
- Wind 7/10 Severe 78% chance of damaging wind over 30 yrs
- Air quality 2/10 Low 0 unhealthy d/yr today · 1 by 30 yrs out
Nearby sold comps map
Loading sold comps map…
Walkable amenities ~0.75 mi
Loading nearby amenities…
Taxation est. · year 1
- Rental income
- $25,602
- − Mortgage interest
- −$5,546
- − Property taxes
- −$750
- − Insurance
- −$495
- − Repairs & maintenance
- −$2,048
- − Management
- −$2,048
- − Depreciation
- −$2,880
- Taxable income
- $11,835
- Est. tax owed @ 24.0%
- −$2,840
- After-tax cash flow
- $9,910/yr
For passive investors: Depreciation is non-cash, so a rental often shows a tax loss while cash-flowing — sheltering income. Rental losses are passive: they offset passive income freely, and up to $25,000/yr can offset ordinary (W-2) income if you actively participate and your MAGI is under $100k (phasing out to $0 by $150k); unused losses carry forward. On sale, claimed depreciation is recaptured at up to 25%, and gains may owe capital-gains tax (a 1031 exchange can defer both). Figures are a year-1 estimate at your 24.0% rate — not tax advice; consult a CPA.
Schools (NCES district)
- District
- Canton Public School District
- NCES district ID
- 2800900
- Math proficiency
- 13% ▼ -20.00%
- Reading proficiency
- 19% ▼ -5.00%
- Median HH income
- $38,130
- Composite
- 13.44/100
- National rank
- #9523
- State rank
- #100 of 130 in MS
Livability — Canton
- Score
- 60/100
- State rank
- #229
- US rank
- #19396
Category grades
Schools grade is shown separately in the Schools card above.
Census & demographics
- Census place
- Canton, MS
- City population
- 29,160
- Population (ZIP)
- 29,160
Population outlook (Madison County) Hauer SSP2
- Today (2025)
- 122,509 people
- By 2030
- 131,737 · +7.5%
- By 2040
- 148,930 · +21.6%
- By 2050
- 164,300 · +34.1%
- By 2075
- 197,495 · +61.2%
- By 2100
- 211,429 · +72.6%
Race, ethnicity, and origin ACS 2023
- Neighborhood character
- Majority Black (63%)
- Race & ethnicity
- Black 63% White 31% Hispanic / Latino 4% Two or more races 2%
- Common ancestry
- Italian 2% Slovak 1% Serbian 1%
- Foreign-born
- 2% · Canada, China
- Languages at home
- 95% English-only · Spanish 4%
Political lean MEDSL · Madison
- 2024 margin
- R (+17.3) · D 40.8% · R 58.0% · Other 1.2%
- 2008→2024 swing
- -1.7pp toward R · 2008: -15.6pp · 2024: -17.3pp
- All cycles
- 2024: R+17.3 2020: R+11.8 2016: R+16.1 2012: R+15.7 2008: R+15.6
Not yet ingested
- Civics
- —
Market trends
- HPI YoY
- ▼ -66.50%
- Current HPI
- 154.0441
- Rent YoY
- —
- Metro
- —
- State GDP YoY
- —
- F500 in state
- 0
Price history
+23.8% since first listed9 events — show timeline
- 2026-04-21 Pending — MLSU
- 2026-03-06 Listed $99,000 MLSU
- 2021-10-01 Listing Removed — MLSU
- 2006-06-06 Listed $80,000 MLSU
- 2002-01-24 Sold (Public Records) — Public Records
- 2001-02-16 Sold (Public Records) — Public Records
- 1996-02-21 Sold (Public Records) — Public Records
- 1992-12-17 Sold (Public Records) — Public Records
- 1988-07-08 Sold (Public Records) — Public Records
Property tax history
+1.4%/yrLatest (2025): $750 · +0.0% YoY. Source: county tax records.
Cash-flow waterfall
monthlySold comps — $/sqft
last 12 mo · ≤1 miLoading sold comps…