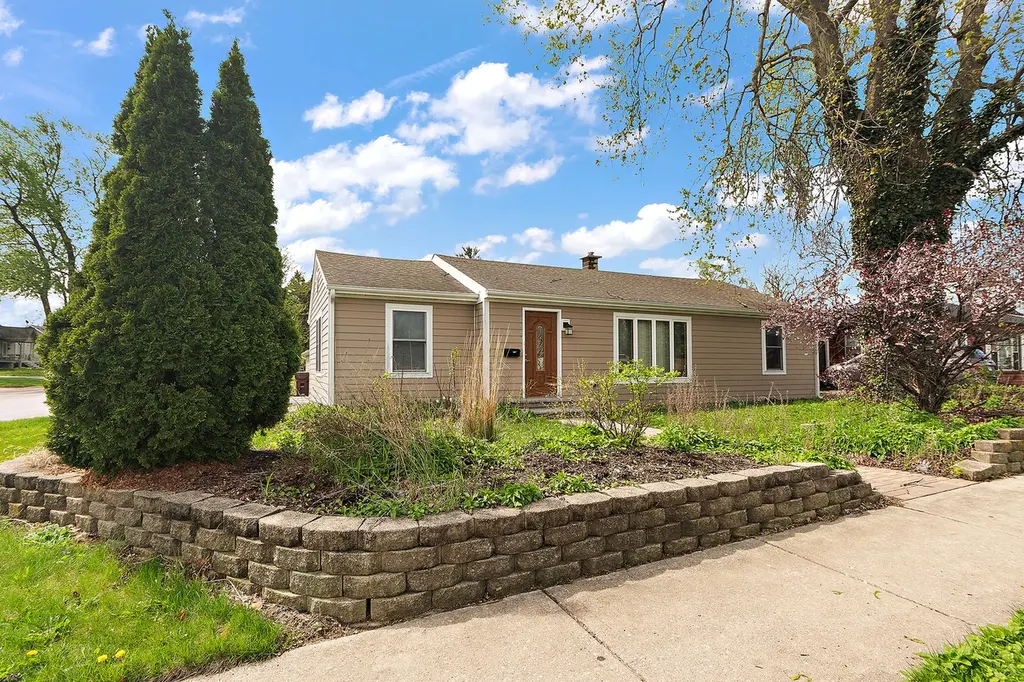
6901 167th St · Tinley Park, IL
Flood risk 4/10 · Minor
- FEMA flood zone
- X (unshaded)
- Chance of flooding over 30 yrs
- 0.22%
- Est. flood insurance / yr
- $473 – $860
Fire risk 1/10 · Minimal
- Est. fire insurance / yr
- $804 – $1,492
Heat risk 3/10 · Minor
- Hot days now (above 101°F)
- 7 days/yr
- Hot days in 30 yrs
- 15 days/yr
Wind risk 2/10 · Minimal
- Chance of severe wind over 30 yrs
- —
Air-quality risk 4/10 · Minor
- Unhealthy air days now
- 4 days/yr
- Unhealthy air days in 30 yrs
- 5 days/yr
Risk factors via First Street. Map © Google.
Why this score? — see what drove the D grade
The composite is a weighted blend of 9 inputs, each scored 0–100. Each bar is that input's sub-score; the figure is the points it added to the 100-point composite (weight × sub-score).
- Cash flow +13.0/30.0
- ARV discount +11.1/15.0
- 1% rule +4.3/10.0
- DSCR +3.9/10.0
- Livability +3.7/5.0
- Rent growth +2.5/5.0
- Condition / age +2.5/5.0
- Schools +1.5/10.0
- Appreciation +0.0/10.0
$269,900
🖨 Deal sheet 📄 Offer letter ✓ Due diligence
Listing remarks
Charming and well-maintained 3-bedroom, 1-bath ranch offering comfort, convenience, and classic appeal! This home features beautiful hardwood floors and an updated kitchen with modern finishes, providing a perfect blend of style and functionality. Enjoy easy one-level living with a bright and inviting layout, ideal for both everyday living and entertaining. The oversized 2.5-car detached garage offers ample space for parking, storage, or a workshop. Roof replaced in 2014; Windows replaced in 2012; Furnace replaced in 2020; tankless hot water heater replaced in 2019; patio installed in 2023; new gutters & soffits replaced in 2024. 2 - 40 volt breakers on separate circuits in garage. I
Key facts
- One-level living
- Updated kitchen
- Hardwood floors
Tags
Property features AI
Finance
- Other: Living area sourced from assessor; Approximately 1,128 total finished square feet; Property not currently leased; Some photos virtually staged
- HOA & community: No master association fee required; Neighborhood features: curbs, sidewalks, street lights, paved streets
Exterior
- Parking: Detached owned garage (approx. 2.5 garage/parking spaces); Asphalt driveway
- Utilities: Water source: Lake Michigan; Public sewer
- Home design: Detached single-family home; One-story; Fee simple ownership; Rehab completed in 2018; Built before 1978
- Construction: Aluminum and steel siding; Asphalt roof; Approximate age: 71–80 years; Rehab year: 2018
- Exterior features: Patio; Corner lot; Lot dimensions approximately 60 x 125
Interior
- Kitchen: Range; Microwave; Dishwasher; Refrigerator; Hardwood flooring in kitchen
- Bedrooms: Master bedroom on main level (11 x 10); Bedroom 2 on main level (11 x 10); Bedroom 3 on main level (10 x 10)
- Flooring: Hardwood in living areas and dining room; Carpet in bedrooms; Other flooring in laundry
- Bathrooms: One full bathroom (first floor)
- Heating & cooling: Natural gas forced-air heating; Central air conditioning
- Interior features: First-floor bedroom; First-floor full bathroom; 6 total rooms; Crawl space basement; Disability access
- Laundry & utility: Main-level laundry (in unit); Washer; Dryer
Neighborhood map
What this means for you Summary
Snapshot
- This is a 3-bed/1.5-bath single-family listed at $270k.
Deal economics
- At list price, monthly cash flow is $-16 ($-197/yr) — negative.
- To cash-flow at today's rent, offer at most $267k (1.1% below list).
- To meet the 1% rule (rent ≥ 1% of price), the offer needs to be $251k (6.9% below list).
- Recommended offer: $251k (6.9% below list) — sets the bar for 1% rule.
- Cap rate 6.2% vs local median 4.3% in Tinley Park — top-decile yield for the area; either an underpriced asset or a hidden risk that comps aren't pricing in. Stress-test before assuming the spread holds.
Location & tenants
- Location reads 74/100 on livability (#246 in IL, #4,453 nationally) — a middle-class / working-renter tenant base. Strengths: commute A+, employment A+, housing A+; Watch: amenities F, health & safety F.
- Bremen Chsd 228 (suburban): math 15% / reading 17% proficiency, ranked #468 of 620 in IL (top 76%) — low school quality limits family demand, transient renter base, plan for 1-2y turnover.
- Market conditions: 151 active listings in the ZIP; 7 comparable units currently listed for rent nearby; rentals leasing fast (median 2d on market — plan ~1-2 weeks tenant-placement turnaround); solid renter incomes; 6,272 units permitted in Cook County in 2024 (4,658 in 5+ unit buildings).
- This rent runs 32% of the median local income ($95k/yr) — at the standard rent-burdened threshold; future hikes will face affordability resistance.
Forward outlook
- Local home prices are declining (-3.0%/yr); year-one equity from $2k of loan paydown is wiped out by about $8k of value loss. Plan a longer hold.
Negotiation context
- It's been on market 43 days — a 3% lower offer ($262k) is reasonable based on typical stale-listing flexibility.
- 2 sale attempts with the ask held roughly flat each time — persistent listings suggest the price (not the market) is what's stuck; bring a comps-based counter.
- Current owner paid $59k; list at $270k implies a 358% gain — meaningful room to come down on a strong offer.
Risks & watch-outs
- Watch-outs: built in 1949 — expect roof / HVAC / electrical / plumbing capex.
Questions for the listing agent
- What do current leases actually rent for vs. the listed asking? Can we see a recent rent roll and the last 12 months of T-12 income?
- It's been on market 43 days. Have you received any prior offers? Is the seller open to a 7% concession, seller financing, or rate buy-down credit?
- Built in 1949 — when were the roof, HVAC, electrical panel, plumbing, and water heater last replaced?
- Is there a deadline driving the sale (1031 exchange, divorce, estate, relocation)? That informs how much negotiation room exists.
- The area grade is low — what's the realistic commute time and amenity access for the typical tenant pool here? Any planned neighborhood developments (good or bad) we should know about?
- What's the average days-on-market for RENTAL listings here right now (not sales)? A rising rental-DOM trend means longer vacancies and softer asking-rent achievability than the comps imply.
- What's the recent tenant-quality profile in this submarket — average credit score on applications, eviction rate, late-payment / NSF rate, and stable-employment percentage? A property-management company in the area should have these aggregated.
- How much new for-sale + rental construction is in the pipeline within 1–3 miles? Heavy new supply typically softens prices + rents 12–24 months out; constrained supply supports both.
Investment metrics
- 1% rule
- 0.93% ✗
- Cap rate
- 6.22%
- Cash-on-cash
- -0.26%
- DSCR
- 0.99
- GRM
- 9.0
CMA / ARV
- ARV (on-the-fly)
- $293,280
- Comps found
- 12
Show comp detail 12 sales within ~0.75 mi
| Address | Dist | Beds/Ba | Sqft | Sold | Price | $/sf | Match |
|---|---|---|---|---|---|---|---|
| 6901 167th St | 0.00mi | 3/1.0 | 1,128 (0%) | 0mo | $269,900 | $239 | 98 |
| 6721 165th Pl | 0.29mi | 3/1.5 | 1,131 (+0%) | 0mo | $300,000 | $265 | 86 |
| 6613 Glenview Dr | 0.46mi | 3/1.0 | 1,125 (-0%) | 1mo | $280,000 | $249 | 76 |
| 6666 Ravinia Dr | 0.42mi | 3/1.0 | 1,137 (+1%) | 4mo | $285,000 | $251 | 74 |
| 6607 Hubbard Ln | 0.42mi | 3/1.0 | 1,125 (-0%) | 6mo | $306,000 | $272 | 73 |
| 6723 Tinley Park Dr | 0.22mi | 3/1.0 | 1,000 (-11%) | 4mo | $260,000 | $260 | 65 |
| 16317 66th Ct | 0.55mi | 4/2.5 (+1) | 1,120 (-1%) | 1mo | $340,000 | $304 | 64 |
| 7513 Dorothy Ln | 0.69mi | 3/2.0 | 1,095 (-3%) | 9mo | $380,000 | $347 | 54 |
| 6528 163rd Pl | 0.66mi | 4/2.0 (+1) | 1,120 (-1%) | 9mo | $365,000 | $326 | 53 |
| 6423 163rd Pl | 0.73mi | 3/2.0 | 1,167 (+4%) | 9mo | $275,000 | $236 | 51 |
| 6337 Carlsbad Dr | 0.69mi | 3/2.0 | 1,248 (+11%) | 7mo | $319,900 | $256 | 42 |
| 6500 163rd Pl | 0.71mi | 4/2.0 (+1) | 1,290 (+14%) | 2mo | $291,000 | $226 | 34 |
Match score weights: distance 35% · size 25% · config 20% · recency 20%. Top-matched comps best support the ARV.
Projected returns pro-forma
-3.0% appreciation · 3.0% rent growth · sell at horizon
- IRR
- -16.7%
- Equity multiple
- 0.41×
- Total profit
- $-44,658
- Equity at exit
- $40,243
- IRR
- -8.4%
- Equity multiple
- 0.47×
- Total profit
- $-39,740
- Equity at exit
- $23,336
Cash invested: $75,572 (down + closing). Projections, not guarantees.
Landlord ↔ Tenant lean methodology
- Overall (STATE)
- 43 Moderately Tenant-Leaning
- State Illinois
- 43 Moderately Tenant-Leaning · D+7
- County
- — inherits STATE
- City
- — inherits STATE
ZIP-level market 60477
- Active inventory
- 151
- Price-to-rent
- 9.0×
Monthly cashflow live
- Estimated rent
- $2,512 high interval (Pro) →
- Mortgage (P&I)
- −$1,415
- Tax from tax record
- −$473 /mo · $5,675/yr
- Insurance
- −$112
- HOA
- −$0
- Vacancy / Maint / Mgmt
- −$527
- Net cashflow
- $-16
Break-even live
UW: 25.0% down · 7.5% · 30yr · 1.5% tax · 5.0% vac · 8.0% maint · 8.0% mgmt
Financing live
Cash to close
- Down payment
- $67,475
- Closing costs
- $8,097
- Reserves months
- —
- Total cash needed
- —
Loan-product check · same deal, 3 products live
Conventional
25% down · 7.5% · 30yr
- Down + closing
- —
- Monthly P&I
- —
- Monthly cashflow
- —
- DSCR
- —
- Eligible?
- —
Personal DTI + credit; lowest rate.
DSCR
20% down · 8.5% · 30yr
- Down + closing
- —
- Monthly P&I
- —
- Monthly cashflow
- —
- DSCR
- —
- Eligible?
- —
No personal income docs; deal must DSCR.
Hard money
10% down · 12.0% · 12mo
- Down + closing
- —
- Monthly P&I
- —
- Monthly cashflow
- —
- DSCR
- —
- Eligible?
- —
Short-term bridge; refi at stabilization.
Rent comps 7 comps
| Address | Beds | Baths | Sqft | Rent | $/sqft | DOM | Units | Dist |
|---|---|---|---|---|---|---|---|---|
| 16851 Harlem Ave Tinley Park, IL | 1.0–2.0 | 1.0–2.0 | 857 | $3,065 | $3.58 | 1d | 24 | 0.39mi |
| 6661 Glenview Dr Tinley Park, IL | 3.0 | 2.0 | 1125 | $3,200 | $2.84 | 1d | 1 | 0.41mi |
| 17212 Oak Park Ave Unit 2SE Tinley Park, IL | 2.0 | 2.0 | 1200 | $2,600 | $2.17 | 10d | 1 | 0.66mi |
| 17385 70th Ave Apt I Tinley Park, IL | 2.0 | 1.0 | 900 | $1,350 | $1.50 | 16d | 1 | 0.93mi |
| 17537 70th Ct Tinley Park, IL | 3.0 | 1.5 | 1170 | $3,000 | $2.56 | 1d | 1 | 1.11mi |
| 17545 71st Ave Tinley Park, IL | 3.0 | 1.5 | 1144 | $1,800 | $1.57 | 1d | 1 | 1.16mi |
| 16703 Lakewood Dr Tinley Park, IL | 1.0–2.0 | 1.0–2.0 | 972 | $1,505 | $1.55 | 2d | 1 | 1.25mi |
Listing history 9 events
-
2026-06-01status $269,900 Pending 43 DOM
-
2026-05-31days on market $269,900 Contingent - Continue to Show 43 DOM
-
2026-05-06historical Contingent - Continue to Show
-
2026-04-29status Active
-
2026-04-22historical Contingent - Continue to Show
-
2026-04-18$269,900 Active
-
1986-08-01soldstatus $58,900
-
1984-08-21soldstatus $45,000
-
1984-07-01soldstatus $45,000
ⓘ Source: listings_history table (triggers on properties + properties_extension) + one-shot
backfill from property_details.listing_events for pre-trigger history.
Tax reassessment forecast IL · Partial reset (capped growth)
- Current annual tax
- $5,675 · $473/mo
- Projected year-2 tax
- $5,901 · $492/mo
- Expected delta
- +$226/yr (+$19/mo · 4.0%)
ⓘ Screening estimate from a state-policy table — verify with the county assessor before closing.
Climate risk First Street
- Flood 4/10 Moderate FEMA zone X (unshaded) · 22% chance over 30 yrs
- Wildfire 1/10 Low
- Heat 3/10 Moderate 7 d/yr ≥101°F today · 15 d/yr by 30 yrs out
- Wind 2/10 Low
- Air quality 4/10 Moderate 4 unhealthy d/yr today · 5 by 30 yrs out
Nearby sold comps map
Loading sold comps map…
Walkable amenities ~0.75 mi
Loading nearby amenities…
Taxation est. · year 1
- Rental income
- $30,143
- − Mortgage interest
- −$15,119
- − Property taxes
- −$5,675
- − Insurance
- −$1,350
- − Repairs & maintenance
- −$2,411
- − Management
- −$2,411
- − Depreciation
- −$7,852
- Taxable loss
- −$4,675
- Est. tax savings @ 24.0%
- +$1,122
- After-tax cash flow
- $925/yr
For passive investors: Depreciation is non-cash, so a rental often shows a tax loss while cash-flowing — sheltering income. Rental losses are passive: they offset passive income freely, and up to $25,000/yr can offset ordinary (W-2) income if you actively participate and your MAGI is under $100k (phasing out to $0 by $150k); unused losses carry forward. On sale, claimed depreciation is recaptured at up to 25%, and gains may owe capital-gains tax (a 1031 exchange can defer both). Figures are a year-1 estimate at your 24.0% rate — not tax advice; consult a CPA.
Schools (NCES district)
- District
- Bremen Chsd 228
- NCES district ID
- 1707050
- Math proficiency
- 15% ▼ -4.00%
- Reading proficiency
- 17% ▼ -5.00%
- Median HH income
- $57,625
- Composite
- 15.32/100
- National rank
- #9327
- State rank
- #468 of 620 in IL
Livability — Tinley Park
- Score
- 74/100
- State rank
- #246
- US rank
- #4453
Category grades
Schools grade is shown separately in the Schools card above.
Census & demographics
- Census place
- Tinley Park, IL
- County
- Cook County · 4,486,803 people
- City population
- 35,976
- Metro
- Chicago-Naperville-Elgin, IL-IN-WI
- Population (ZIP)
- 35,976
- Household income
- $94,927
- Rent vs Own
- Severe rent burden
- 753.0
Population outlook (Cook County) Hauer SSP2
- Today (2025)
- 5,347,519 people
- By 2030
- 5,357,703 · +0.2%
- By 2040
- 5,324,924 · -0.4%
- By 2050
- 5,230,762 · -2.2%
- By 2075
- 4,785,735 · -10.5%
- By 2100
- 4,188,836 · -21.7%
Race, ethnicity, and origin ACS 2023
- Neighborhood character
- Predominantly White (74%)
- Race & ethnicity
- White 74% Hispanic / Latino 12% Two or more races 9% Black 7% Asian 3%
- Hispanic origin (detail)
- Mexican 9% Puerto Rican 2%
- Common ancestry
- Romanian 14% Iranian 3% Lithuanian 2%
- Foreign-born
- 9% · Canada, China
- Languages at home
- 85% English-only · Spanish 6% Arabic 5% Other Indo-European 1%
Political lean MEDSL · Cook
- 2024 margin
- Solid D (+42.0) · D 70.4% · R 28.4% · Other 1.2%
- 2008→2024 swing
- -11.4pp toward R · 2008: 53.4pp · 2024: 42.0pp
- All cycles
- 2024: D+42.0 2020: D+50.3 2016: D+53.0 2012: D+49.4 2008: D+53.4
Not yet ingested
- Civics
- —
Market trends
- HPI YoY
- ▼ -272.64%
- Current HPI
- 190.7548
- Rent YoY
- —
- Metro
- Chicago-Naperville-Elgin, IL-IN-WI
- State GDP YoY
- ▲ 1.59%
- F500 in state
- 60
Industry mix (Fortune 500 HQ in IL)
| Industry | F500 HQs | Revenue |
|---|---|---|
| Insurance | 4 | $201B |
|
||
| Consumer Goods | 4 | $87B |
|
||
| Industrial Machinery | 3 | $64B |
|
||
| Healthcare | 2 | $55B |
|
||
| Retail / Pharmacy | 1 | $148B |
|
||
| Agriculture / Food | 1 | $86B |
|
||
Price history
+499.8% since first listed7 events — show timeline
- 2026-05-06 Contingent — MRED as Distributed by MLS Grid
- 2026-04-29 Relisted — MRED as Distributed by MLS Grid
- 2026-04-22 Contingent — MRED as Distributed by MLS Grid
- 2026-04-18 Listed $269,900 MRED as Distributed by MLS Grid
- 1986-08-01 Sold (Public Records) $58,900 Public Records
- 1984-08-21 Sold (Public Records) $45,000 Public Records
- 1984-07-01 Sold (Public Records) $45,000 Public Records
Property tax history
+3.0%/yrLatest (2023): $5,675 · +19.5% YoY. Source: county tax records.
Cash-flow waterfall
monthlySold comps — $/sqft
last 12 mo · ≤1 miLoading sold comps…