276 Grosbeak Ln #276 · Winding Cypress, FL
Flood risk 9/10 · Severe
- FEMA flood zone
- AE
- Chance of flooding over 30 yrs
- 0.99%
- Est. flood insurance / yr
- $1,737 – $8,500
Fire risk 4/10 · Minor
- Est. fire insurance / yr
- $947 – $1,759
Heat risk 10/10 · Severe
- Hot days now (above 108°F)
- 7 days/yr
- Hot days in 30 yrs
- 28 days/yr
Wind risk 10/10 · Severe
- Chance of severe wind over 30 yrs
- 99.0%
Air-quality risk 3/10 · Minor
- Unhealthy air days now
- 3 days/yr
- Unhealthy air days in 30 yrs
- 3 days/yr
Risk factors via First Street. Map © Google.
Why this score? — see what drove the B+ grade
The composite is a weighted blend of 9 inputs, each scored 0–100. Each bar is that input's sub-score; the figure is the points it added to the 100-point composite (weight × sub-score).
- Cash flow +30.0/30.0
- 1% rule +10.0/10.0
- DSCR +10.0/10.0
- ARV discount +7.5/15.0
- Schools +5.0/10.0
- Appreciation +4.3/10.0
- Rent growth +3.3/5.0
- Livability +2.5/5.0
- Condition / age +2.5/5.0
$239,000
🖨 Deal sheet 📄 Offer letter ✓ Due diligence
Listing remarks
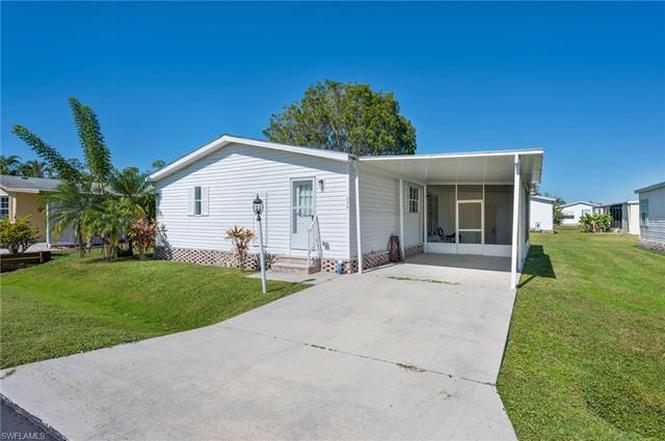
Discover Quail Roost, a hidden gem tucked just off US-41, featuring a welcoming neighborhood of 142 homes. A rare find—you own the land here. That’s right—no lot rent, and no 55+ age restrictions. Ideal for a 1031 exchange, a seasonal retreat, or a full-time Florida residence. This charming 3-bedroom, 2-bath home (built in 2000) offers an inviting open layout with vaulted ceilings, creating a bright and spacious feel. The split-bedroom floor plan ensures comfort and privacy for guests. The kitchen provides generous cabinet space and room for a dining table or cozy breakfast nook. The primary suite accommodates a king-size bed, features a walk-in closet, and includes an ens
Key facts
- Walk-in closet
- No lot rent
- Ensuite bath
Tags
Property features AI
Finance
- Other: Property is in the Quail Roost development; Lot is deeded; Lot is regular-shaped with landscaped area view; Irrigation: central
- HOA & community: Mandatory HOA; Quarterly HOA fee of $888; Annual recurring HOA fees total $3,552; One-time fees total $150; Professional management; HOA maintenance covers cable, lawn/land maintenance, manager, recreation facilities, sewer, water; Community amenities include clubhouse, community pool, BBQ/picnic area, boat storage; Mobile/manufactured community; Complex contains 142 units
Exterior
- Parking: Attached carport (1 space)
- Utilities: Central water; Central sewer; Cable available
- Home design: Manufactured residential home; 1 story (ranch); Rear exposure facing north
- Construction: Manufactured construction; Vinyl siding exterior; Shingle roof; Built in 2000; Concrete foundation
- Exterior features: Storage; Double-hung windows; Storm protection (remarks)
Interior
- Kitchen: Electric cooktop; Dishwasher; Refrigerator
- Bedrooms: 3 bedrooms; Split bedroom floor plan
- Flooring: Laminate flooring
- Bathrooms: 2 full bathrooms; Master bathroom with combo tub and shower and jetted tub
- Heating & cooling: Central electric heat; Central electric air conditioning
- Interior features: Built-in cabinets; High-speed internet available; Smoke detectors; Vaulted ceiling; Walk-in closet; Family room; Guest room; Guest bath; Screened lanai/porch; Dining area (family)
- Laundry & utility: Washer; Dryer
Neighborhood map
What this means for you Summary
Snapshot
- This is a 3-bed/2.0-bath condo listed at $239k.
Deal economics
- At list price, monthly cash flow is $714 ($9k/yr) — positive.
- The deal already cash-flows at list — no discount required.
- Meets the 1% rule at list price ($4k rent vs $239k).
- Recommended offer: $210k (12.0% below list) — sets the bar for market timing.
Location & tenants
- Location reads: area grade B — affects rentability + tenant quality, not the cash-flow math above.
- Collier (suburban): math 60% / reading 56% proficiency, ranked #16 of 73 in FL (top 22%) — acceptable for families but not a draw, mixed tenant base, ~2y average lease.
- Market conditions: Rents rising (+3.2%/yr); 900 active listings in the ZIP; 35 comparable units currently listed for rent nearby; rentals at typical pace (median 24d on market — plan ~3-4 weeks tenant-placement turnaround); solid renter incomes; 3,520 units permitted in Collier County in 2024 (959 in 5+ unit buildings).
- At $3,748/mo this rent would consume 50% of the median local household income ($89k/yr) (locally 550% of renters already pay >50% of income on rent) — very limited rent-growth headroom before tenants either downsize or default.
Forward outlook
- Local home prices are declining (-1.5%/yr); year-one equity from $2k of loan paydown is wiped out by about $4k of value loss. Plan a longer hold.
- Collier County population projected at +30% by 2050 — long-run rental-demand tailwind backs the buy-and-hold thesis.
- At projected returns (-1.5% appreciation + 3.2% rent growth), your $67k cash investment doubles in ~7 years — after that, you're playing with house money.
Negotiation context
- It's been on market 225 days — a 12% lower offer ($210k) is reasonable based on typical stale-listing flexibility.
- 7 sale attempts since 21y ago with the ask held roughly flat each time — persistent listings suggest the price (not the market) is what's stuck; bring a comps-based counter.
- Current owner paid $78k; list at $239k implies a 206% gain — meaningful room to come down on a strong offer.
Risks & watch-outs
- Watch-outs: flood insurance adds $427/mo.
- Climate carrying-cost: in FEMA flood zone AE (mandatory federal flood insurance); severe wind risk, 99% chance of damaging wind over 30y; extreme-heat days projected 7→28/yr by 2055 (HVAC capex compounding) — expect insurance premiums to compound above CPI over the hold.
Questions for the listing agent
- It's been on market 225 days. Have you received any prior offers? Is the seller open to a 12% concession, seller financing, or rate buy-down credit?
- What's the actual annual flood-insurance premium (NFIP or private), and is the property in a SFHA with mandatory coverage?
- What does the HOA fee cover, when was the last increase, and are there any pending special assessments or reserve-fund shortfalls?
- Any open or pending special assessments — roof, HVAC, plumbing, elevator, façade? What's the per-unit balance and payoff schedule, and is the seller paying it off at close or rolling it to the buyer?
- Why hasn't it sold? Are there any deal-killer items the seller is aware of (foundation, flood, title, zoning, code violations)?
- Is there a deadline driving the sale (1031 exchange, divorce, estate, relocation)? That informs how much negotiation room exists.
- What's the average days-on-market for RENTAL listings here right now (not sales)? A rising rental-DOM trend means longer vacancies and softer asking-rent achievability than the comps imply.
- What's the recent tenant-quality profile in this submarket — average credit score on applications, eviction rate, late-payment / NSF rate, and stable-employment percentage? A property-management company in the area should have these aggregated.
- How much new apartment / multifamily construction is in the pipeline within 1–3 miles? Heavy new supply (>2% of stock underway) typically softens rents 12–24 months out; light construction supports rent growth.
Investment metrics
- 1% rule
- 1.57% ✓
- Cap rate
- 12.02%
- Cash-on-cash
- 20.45%
- DSCR
- 1.91
- GRM
- 5.3
CMA / ARV
No comps found within radius.
Projected returns pro-forma
-1.48% appreciation · 3.21% rent growth · sell at horizon
- IRR
- 8.1%
- Equity multiple
- 1.35×
- Total profit
- $23,541
- Equity at exit
- $52,225
- IRR
- 15.3%
- Equity multiple
- 2.47×
- Total profit
- $98,308
- Equity at exit
- $50,307
Cash invested: $66,920 (down + closing). Projections, not guarantees.
Landlord ↔ Tenant lean methodology
- Overall (STATE)
- 87 Strongly Landlord-Friendly
- State Florida
- 87 Strongly Landlord-Friendly · R+3
- County
- — inherits STATE
- City
- — inherits STATE
ZIP-level market 34114
- Home prices YoY
- -0.6%
- Rents YoY
- 3.2%
- Active inventory
- 900
- Price-to-rent
- 5.3×
Monthly cashflow live
- Estimated rent
- $3,748 high interval (Pro) →
- Mortgage (P&I)
- −$1,253
- Tax from tax record
- −$172 /mo · $2,061/yr
- Insurance
- −$100
- Flood insurance flood zone
- −$427 /mo · $5,118/yr
- HOA
- −$296
- Vacancy / Maint / Mgmt
- −$787
- Net cashflow
- $714
Break-even live
UW: 25.0% down · 7.5% · 30yr · 1.5% tax · 5.0% vac · 8.0% maint · 8.0% mgmt
Financing live
Cash to close
- Down payment
- $59,750
- Closing costs
- $7,170
- Reserves months
- —
- Total cash needed
- —
Loan-product check · same deal, 3 products live
Conventional
25% down · 7.5% · 30yr
- Down + closing
- —
- Monthly P&I
- —
- Monthly cashflow
- —
- DSCR
- —
- Eligible?
- —
Personal DTI + credit; lowest rate.
DSCR
20% down · 8.5% · 30yr
- Down + closing
- —
- Monthly P&I
- —
- Monthly cashflow
- —
- DSCR
- —
- Eligible?
- —
No personal income docs; deal must DSCR.
Hard money
10% down · 12.0% · 12mo
- Down + closing
- —
- Monthly P&I
- —
- Monthly cashflow
- —
- DSCR
- —
- Eligible?
- —
Short-term bridge; refi at stabilization.
Rent comps 35 comps
| Address | Beds | Baths | Sqft | Rent | $/sqft | DOM | Units | Dist |
|---|---|---|---|---|---|---|---|---|
| 847 Enbrook Loop Naples, FL | 2.0 | 2.0 | 1503 | $2,950 | $1.96 | 23d | 1 | 0.49mi |
| 1157 Enbrook Loop Naples, FL | 2.0 | 2.0 | 1503 | $3,000 | $2.00 | 23d | 1 | 0.49mi |
| 842 Enbrook Loop Naples, FL | 2.0 | 2.0 | 1503 | $2,800 | $1.86 | 23d | 1 | 0.50mi |
| 3955 Deer Crossing Ct #103 Naples, FL | 3.0 | 2.0 | 1812 | $7,500 | $4.14 | 23d | 1 | 0.50mi |
| 1212 Enbrook Loop Naples, FL | 2.0 | 2.0 | 1496 | $2,850 | $1.91 | 23d | 1 | 0.55mi |
| 1078 Rolling Brook Ln Naples, FL | 2.0 | 2.0 | 1503 | $2,750 | $1.83 | 21d | 1 | 0.61mi |
| 1276 Enbrook Loop Naples, FL | 2.0 | 2.0 | 1503 | $5,000 | $3.33 | 23d | 1 | 0.63mi |
| 4529 Cardinal Cove Ln #7 Naples, FL | 2.0 | 2.0 | 1539 | $6,500 | $4.22 | 23d | 1 | 0.65mi |
| 4685 Hawks Nest Way #103 Naples, FL | 2.0 | 2.0 | 1440 | $6,500 | $4.51 | 13d | 1 | 0.65mi |
| 1171 Tranquil Brook Dr Naples, FL | 2.0 | 2.0 | 1503 | $4,500 | $2.99 | 13d | 1 | 0.68mi |
| 2000 Rookery Bay Dr Naples, FL | 1.0–3.0 | 1.0–2.0 | 929 | $2,020 | $2.17 | 23d | 9 | 0.71mi |
| 4680 Hawks Nest Way Unit D-103 Naples, FL | 2.0 | 2.0 | 1414 | $3,000 | $2.12 | 13d | 1 | 0.71mi |
| 4650 Hawks Nest Way Unit M202 Naples, FL | 3.0 | 2.0 | 1840 | $9,600 | $5.22 | 13d | 1 | 0.74mi |
| 1014 Manatee Rd Unit F307 Naples, FL | 2.0 | 2.0 | 900 | $1,800 | $2.00 | 23d | 1 | 0.74mi |
| 1022 Manatee Rd Unit D107 Naples, FL | 2.0 | 2.0 | 1000 | $2,000 | $2.00 | 23d | 1 | 0.78mi |
| 274 Riverwood Rd Unit 1546056P Naples, FL | 2.0 | 2.0 | 1496 | $4,451 | $2.98 | 13d | 1 | 0.83mi |
| 1010 Manatee Rd Unit B304 Naples, FL | 2.0 | 2.0 | 1000 | $1,800 | $1.80 | 23d | 1 | 0.85mi |
| 1000 Manatee Rd Unit A201 Naples, FL | 2.0 | 2.0 | 1000 | $1,695 | $1.70 | 23d | 1 | 0.85mi |
| 2235 Yellowfin Cir Naples, FL | 2.0 | 2.0 | 1500 | $2,795 | $1.86 | 23d | 1 | 0.85mi |
| 1747 Beverly Dr Naples, FL | 2.0 | 2.0 | 1080 | $2,300 | $2.13 | 23d | 1 | 0.88mi |
| 2244 Yellowfin Cir Naples, FL | 3.0 | 2.0 | 1655 | $3,300 | $1.99 | 13d | 1 | 0.88mi |
| 158 Rookery Rd Naples, FL | 3.0 | 2.0 | 1456 | $2,450 | $1.68 | 23d | 1 | 0.95mi |
| 163 Indies Dr E #206 Naples, FL | 3.0 | 2.0 | 1698 | $6,000 | $3.53 | 23d | 1 | 1.08mi |
| 163 Indies Dr E #106 Naples, FL | 3.0 | 2.0 | 1698 | $7,500 | $4.42 | 23d | 1 | 1.08mi |
| 163 Indies Dr E #203 Naples, FL | 2.0 | 2.0 | 1448 | $7,200 | $4.97 | 23d | 1 | 1.08mi |
| 268 Indies Dr E #102 Naples, FL | 2.0 | 2.0 | 1537 | $7,500 | $4.88 | 23d | 1 | 1.20mi |
| 14214 Manchester Dr Naples, FL | 3.0 | 2.0 | 1560 | $2,700 | $1.73 | 21d | 1 | 1.21mi |
| 14214 Manchester Dr Naples, FL | 3.0 | 2.0 | 1560 | $2,800 | $1.79 | 23d | 1 | 1.21mi |
| 232 Indies Dr E #101 Naples, FL | 3.0 | 2.0 | 1537 | $7,500 | $4.88 | 23d | 1 | 1.24mi |
| 244 Indies Dr E #101 Naples, FL | 3.0 | 2.0 | 1537 | $7,500 | $4.88 | 21d | 1 | 1.24mi |
| 262 Indies Dr E Unit 101 Naples, FL | 3.0 | 2.0 | 1537 | $7,500 | $4.88 | 23d | 1 | 1.25mi |
| 286 Indies Dr E Unit 202 Naples, FL | 3.0 | 2.0 | 1509 | $3,200 | $2.12 | 23d | 1 | 1.25mi |
| 14796 Canton Ct Naples, FL | 3.0 | 2.0 | 1677 | $7,000 | $4.17 | 23d | 1 | 1.37mi |
| 8365 Whisper Trace Way Unit L204 Naples, FL | 3.0 | 2.0 | 1752 | $6,500 | $3.71 | 13d | 1 | 1.40mi |
| 8355 Whisper Trace Way Unit K104 Naples, FL | 3.0 | 2.0 | 1674 | $6,500 | $3.88 | 13d | 1 | 1.42mi |
HOA detail condo
- Monthly dues
- $296 · $3,552/yr
- Assessments
- None detected in remarks — confirm with the listing agent.
Listing history 33 events
-
2026-06-18days on market $239,000 Active 225 DOM
-
2026-06-17days on market $239,000 Active 224 DOM
-
2026-06-16days on market $239,000 Active 223 DOM
-
2026-06-15days on market $239,000 Active 222 DOM
-
2026-06-10days on market $239,000 Active 217 DOM
-
2026-06-09days on market $239,000 Active 216 DOM
-
2026-06-08days on market $239,000 Active 215 DOM
-
2026-06-07days on market $239,000 Active 214 DOM
-
2026-06-03days on market $239,000 Active 210 DOM
-
2026-06-02days on market $239,000 Active 209 DOM
-
2026-06-01days on market $239,000 Active 208 DOM
-
2026-05-31days on market $239,000 Active 207 DOM
-
2026-05-30days on market $239,000 Active 206 DOM
-
2026-01-26price $239,000
-
2025-11-05$249,000 Active
-
2025-07-19historical $2,900
-
2025-02-04price $2,900
-
2024-10-31$3,000
-
2024-05-24historical
-
2023-12-06$298,000 Active
-
2022-10-26historical
-
2022-08-16price $279,000
-
2022-03-14price $298,000
-
2022-02-08price $299,000
-
2022-01-24$325,000 Active
-
2011-05-04soldstatus $78,000
-
2011-04-15soldstatus $78,000
-
2011-04-15soldstatus $78,000
-
2006-05-19$89,900
-
2006-05-19$89,900
-
2005-07-28soldstatus $139,000
-
2005-02-24$137,500
-
1998-06-18soldstatus $75,000
ⓘ Source: listings_history table (triggers on properties + properties_extension) + one-shot
backfill from property_details.listing_events for pre-trigger history.
Tax reassessment forecast FL · Resets to sale price
- Current annual tax
- $2,061 · $172/mo
- Projected year-2 tax
- $2,061 · $172/mo
- Expected delta
- $0/yr ($0/mo · 0.0%)
ⓘ Screening estimate from a state-policy table — verify with the county assessor before closing.
Climate risk First Street
- Flood 9/10 Extreme FEMA zone AE · 99% chance over 30 yrs
- Wildfire 4/10 Moderate
- Heat 10/10 Extreme 7 d/yr ≥108°F today · 28 d/yr by 30 yrs out
- Wind 10/10 Extreme 99% chance of damaging wind over 30 yrs
- Air quality 3/10 Moderate 3 unhealthy d/yr today · 3 by 30 yrs out
Nearby sold comps map
Loading sold comps map…
Walkable amenities ~0.75 mi
Loading nearby amenities…
Taxation est. · year 1
- Rental income
- $44,976
- − Mortgage interest
- −$13,388
- − Property taxes
- −$2,061
- − Insurance
- −$6,314
- − Repairs & maintenance
- −$3,598
- − Management
- −$3,598
- − HOA
- −$3,552
- − Depreciation
- −$6,953
- Taxable income
- $5,514
- Est. tax owed @ 24.0%
- −$1,323
- After-tax cash flow
- $7,242/yr
For passive investors: Depreciation is non-cash, so a rental often shows a tax loss while cash-flowing — sheltering income. Rental losses are passive: they offset passive income freely, and up to $25,000/yr can offset ordinary (W-2) income if you actively participate and your MAGI is under $100k (phasing out to $0 by $150k); unused losses carry forward. On sale, claimed depreciation is recaptured at up to 25%, and gains may owe capital-gains tax (a 1031 exchange can defer both). Figures are a year-1 estimate at your 24.0% rate — not tax advice; consult a CPA.
Schools (NCES district)
- District
- Collier
- NCES district ID
- 1200330
- Math proficiency
- 60% ▼ -4.00%
- Reading proficiency
- 56% ▼ -2.00%
- Median HH income
- $58,275
- Composite
- 50.23/100
- National rank
- #1892
- State rank
- #16 of 73 in FL
Livability — Winding Cypress
No livability data for this city. (Only ~50 U.S. cities are tracked.)
Census & demographics
- County
- Collier County · 396,295 people
- Metro
- Naples-Marco Island, FL
- Population (ZIP)
- 23,559
- Household income
- $89,334
- Rent vs Own
- Severe rent burden
- 550.0
Population outlook (Collier County) Hauer SSP2
- Today (2025)
- 420,858 people
- By 2030
- 450,054 · +6.9%
- By 2040
- 502,232 · +19.3%
- By 2050
- 544,932 · +29.5%
- By 2075
- 627,203 · +49.0%
- By 2100
- 659,015 · +56.6%
Race, ethnicity, and origin ACS 2023
- Neighborhood character
- Predominantly White (72%)
- Race & ethnicity
- White 72% Hispanic / Latino 17% Two or more races 13% Black 7%
- Hispanic origin (detail)
- Mexican 7% Puerto Rican 1% Cuban 3%
- Common ancestry
- Hispanic 5% Romanian 4% Lithuanian 1%
- Foreign-born
- 21% · Canada, Jamaica
- Languages at home
- 75% English-only · Spanish 15% French/Haitian/Cajun 5% Other Indo-European 4%
Political lean MEDSL · Collier
- 2024 margin
- Solid R (+33.1) · D 33.1% · R 66.2%
- 2008→2024 swing
- -10.6pp toward R · 2008: -22.5pp · 2024: -33.1pp
- All cycles
- 2024: R+33.1 2020: R+24.7 2016: R+26.0 2012: R+30.1 2008: R+22.5
Not yet ingested
- Civics
- —
Market trends
- HPI YoY
- ▼ -1.48%
- Current HPI
- 266.5545
- Rent YoY
- ▲ 3.21%
- Metro
- Naples-Marco Island, FL
- State GDP YoY
- ▲ 3.28%
- F500 in state
- 36
Industry mix (Fortune 500 HQ in FL)
| Industry | F500 HQs | Revenue |
|---|---|---|
| Industrial Technology | 2 | $29B |
|
||
| Insurance | 2 | $17B |
|
||
| Retail | 1 | $60B |
|
||
| Technology Distribution | 1 | $58B |
|
||
| Homebuilding | 1 | $35B |
|
||
| Technology Manufacturing | 1 | $35B |
|
||
Price history
+218.7% since first listed20 events — show timeline
- 2026-01-26 Price Changed $239,000 NAPLESMLS
- 2025-11-05 Listed $249,000 NAPLESMLS
- 2025-07-19 Rental Removed $2,900 NAPLESMLS
- 2025-02-04 Price Changed $2,900 NAPLESMLS
- 2024-10-31 Listed for Rent $3,000 NAPLESMLS
- 2024-05-24 Listing Removed — FORTMLS
- 2023-12-06 Listed $298,000 FORTMLS
- 2022-10-26 Listing Removed — FORTMLS
- 2022-08-16 Price Changed $279,000 FORTMLS
- 2022-03-14 Price Changed $298,000 FORTMLS
- 2022-02-08 Price Changed $299,000 FORTMLS
- 2022-01-24 Listed $325,000 FORTMLS
- 2011-05-04 Sold (Public Records) $78,000 Public Records
- 2011-04-15 Sold (MLS) $78,000 NAPLESMLS
- 2011-04-15 Sold (MLS) $78,000 MIML
- 2006-05-19 Listed $89,900 NAPLESMLS
- 2006-05-19 Listed $89,900 MIML
- 2005-07-28 Sold (Public Records) $139,000 Public Records
- 2005-02-24 Listed $137,500 MIML
- 1998-06-18 Sold (Public Records) $75,000 Public Records
Property tax history
+7.9%/yrLatest (2025): $2,061 · +3.6% YoY. Source: county tax records.
Cash-flow waterfall
monthlySold comps — $/sqft
last 12 mo · ≤1 miLoading sold comps…