 🏷️ Likely Rental
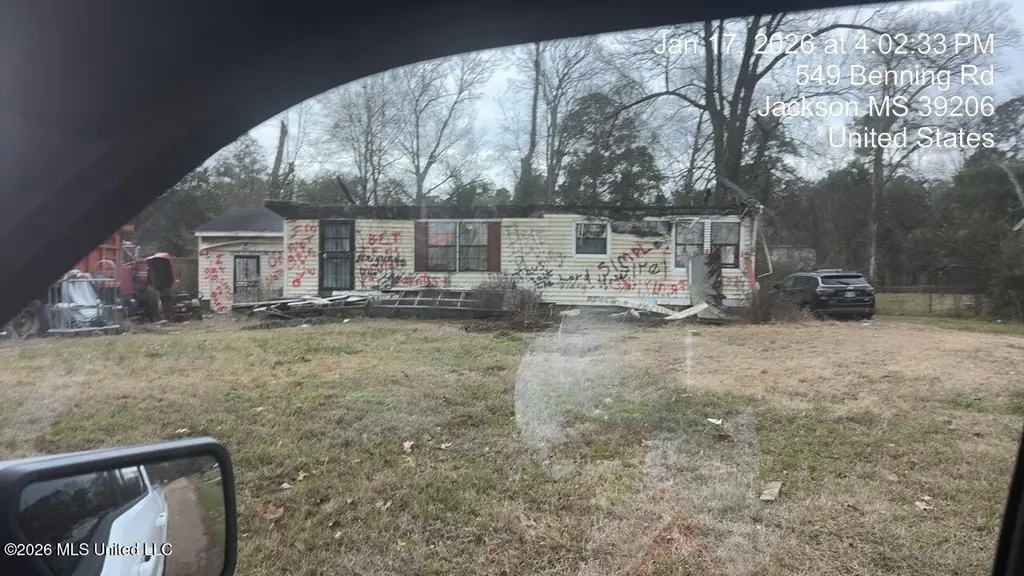
549 Benning Rd · Jackson, MS
Flood risk 1/10 · Minimal
- FEMA flood zone
- X (shaded)
- Chance of flooding over 30 yrs
- 0.0%
- Est. flood insurance / yr
- $507 – $1,088
Fire risk 1/10 · Minimal
- Est. fire insurance / yr
- $1,241 – $2,305
Heat risk 7/10 · Major
- Hot days now (above 108°F)
- 7 days/yr
- Hot days in 30 yrs
- 19 days/yr
Wind risk 8/10 · Major
- Chance of severe wind over 30 yrs
- 80.0%
Air-quality risk 2/10 · Minimal
- Unhealthy air days now
- 0 days/yr
- Unhealthy air days in 30 yrs
- 1 days/yr
Risk factors via First Street. Map © Google.
Why this score? — see what drove the D grade
The composite is a weighted blend of 9 inputs, each scored 0–100. Each bar is that input's sub-score; the figure is the points it added to the 100-point composite (weight × sub-score).
- Cash flow +15.0/30.0
- ARV discount +7.5/15.0
- 1% rule +5.0/10.0
- DSCR +5.0/10.0
- Livability +3.4/5.0
- Rent growth +3.2/5.0
- Condition / age +2.5/5.0
- Schools +1.1/10.0
- Appreciation +0.0/10.0
$5,000
🖨 Deal sheet 📄 Offer letter ✓ Due diligence
Listing remarks
Great investment home in Jackson ms. Home is sold as is .
Key facts
- 0.3 acre lot
- Listed 50 days
Property features AI
Exterior
- Utilities: Public water; Public sewer
- Home design: Single-family house; One level
- Construction: Siding construction
- Exterior features: Lot approximately 0.3 acres
Interior
- Bathrooms: 1 full bathroom
- Heating & cooling: No central cooling indicated
- Interior features: One full bathroom
Neighborhood map
What this means for you Summary
Snapshot
- This is a 2-bed/1.0-bath single-family listed at $5k.
Deal economics
- At list price, monthly cash flow is $1k ($13k/yr) — positive.
- The deal already cash-flows at list — no discount required.
- Meets the 1% rule at list price ($1k rent vs $5k).
- Recommended offer: $5k (3.0% below list) — sets the bar for market timing.
- Cap rate 273.8% vs local median 9.9% in Jackson — top-decile yield for the area; either an underpriced asset or a hidden risk that comps aren't pricing in. Stress-test before assuming the spread holds.
Location & tenants
- Location reads 68/100 on livability (#66 in MS) — a middle-class / working-renter tenant base. Strengths: commute A+, cost of living A+, housing A+; Watch: schools F, amenities F, employment F.
- Jackson Public School District (urban): math 9% / reading 18% proficiency, ranked #112 of 130 in MS (top 86%) — low school quality limits family demand, transient renter base, plan for 1-2y turnover; 88% free/reduced lunch — lower-income household profile, screen leases tightly.
- Market conditions: Rents rising (+2.8%/yr); 119 active listings in the ZIP; 23 comparable units currently listed for rent nearby; rentals at typical pace (median 24d on market — plan ~3-4 weeks tenant-placement turnaround); lower-income renter base — watch delinquency; 167 units permitted in Hinds County in 2024 (0 in 5+ unit buildings).
- This rent runs 41% of the median local income ($43k/yr) — at the standard rent-burdened threshold; future hikes will face affordability resistance.
Forward outlook
- Local home prices are declining (-3.0%/yr); year-one equity from $35 of loan paydown is wiped out by about $150 of value loss. Plan a longer hold.
- Hinds County population projected to shrink 6% by 2050 — rents likely to lag national; underwrite the cash flow, not the appreciation.
- At projected returns (-3.0% appreciation + 2.8% rent growth), your $1k cash investment doubles in ~1 year — after that, you're playing with house money.
Negotiation context
- It's been on market 50 days — a 3% lower offer ($5k) is reasonable based on typical stale-listing flexibility.
Risks & watch-outs
- Watch-outs: built in 1954 — expect roof / HVAC / electrical / plumbing capex.
- Climate carrying-cost: severe wind risk, 80% chance of damaging wind over 30y; extreme-heat days projected 7→19/yr by 2055 (HVAC capex compounding) — expect insurance premiums to compound above CPI over the hold.
Questions for the listing agent
- It's been on market 50 days. Have you received any prior offers? Is the seller open to a 3% concession, seller financing, or rate buy-down credit?
- Built in 1954 — when were the roof, HVAC, electrical panel, plumbing, and water heater last replaced?
- Is there a deadline driving the sale (1031 exchange, divorce, estate, relocation)? That informs how much negotiation room exists.
- Schools are F-rated, which usually means shorter tenancies and higher turnover. Who's the typical renter profile here, and what's been the actual vacancy rate?
- The area grade is low — what's the realistic commute time and amenity access for the typical tenant pool here? Any planned neighborhood developments (good or bad) we should know about?
- What's the average days-on-market for RENTAL listings here right now (not sales)? A rising rental-DOM trend means longer vacancies and softer asking-rent achievability than the comps imply.
- What's the recent tenant-quality profile in this submarket — average credit score on applications, eviction rate, late-payment / NSF rate, and stable-employment percentage? A property-management company in the area should have these aggregated.
- How much new for-sale + rental construction is in the pipeline within 1–3 miles? Heavy new supply typically softens prices + rents 12–24 months out; constrained supply supports both.
Investment metrics
- 1% rule
- 29.09% ✓
- Cap rate
- 273.76%
- Cash-on-cash
- 955.23%
- DSCR
- 43.50
- GRM
- 0.3
CMA / ARV
- ARV (median comp)
- $50,479
- List price
- $5,000
- Delta
- -90.09%
- Verdict
- UNDERPRICED
- Comps
- 20 within 1.0 mi
Show comp detail 12 sales within ~0.75 mi
| Address | Dist | Beds/Ba | Sqft | Sold | Price | $/sf | Match |
|---|---|---|---|---|---|---|---|
| 632 Woodbury Rd | 0.28mi | 2/2.0 | 1,416 (-3%) | 2mo | $115,000 | $81 | 76 |
| 610 Lawrence Rd | 0.09mi | 3/1.0 (+1) | 1,302 (-11%) | 4mo | $69,900 | $54 | 69 |
| 216 Pine Ridge Rd | 0.45mi | 3/1.5 (+1) | 1,421 (-3%) | 5mo | $124,900 | $88 | 63 |
| 4816 Maplewood Dr | 0.38mi | 3/2.0 (+1) | 1,510 (+3%) | 6mo | $76,720 | $51 | 63 |
| 521 Launcelot Rd | 0.24mi | 3/2.0 (+1) | 1,346 (-8%) | 6mo | $87,000 | $65 | 61 |
| 805 Serville Dr | 0.40mi | 3/2.0 (+1) | 1,332 (-9%) | 3mo | $150,000 | $113 | 54 |
| 4858 Sheridan Dr | 0.27mi | 3/2.0 (+1) | 1,264 (-14%) | 2mo | $123,000 | $97 | 54 |
| 36 S Crossings | 0.45mi | 3/2.5 (+1) | 1,560 (+7%) | 4mo | $204,000 | $131 | 54 |
| 33 Autumn Woods Dr | 0.46mi | 2/2.0 | 1,631 (+11%) | 4mo | $170,000 | $104 | 52 |
| 130 Wacker Dr | 0.58mi | 3/1.0 (+1) | 1,302 (-11%) | 1mo | $35,000 | $27 | 49 |
| 758 Robinhood Rd | 0.49mi | 3/3.0 (+1) | 1,536 (+5%) | 8mo | $155,000 | $101 | 49 |
| 764 Avalon Rd | 0.59mi | 3/2.0 (+1) | 1,287 (-12%) | 0mo | $89,900 | $70 | 43 |
Match score weights: distance 35% · size 25% · config 20% · recency 20%. Top-matched comps best support the ARV.
Projected returns pro-forma
-3.0% appreciation · 2.83% rent growth · sell at horizon
- IRR
- —
- Equity multiple
- 50.96×
- Total profit
- $69,943
- Equity at exit
- $746
- IRR
- —
- Equity multiple
- 109.13×
- Total profit
- $151,375
- Equity at exit
- $432
Cash invested: $1,400 (down + closing). Projections, not guarantees.
Landlord ↔ Tenant lean methodology
- Overall (STATE)
- 90 Strongly Landlord-Friendly
- State Mississippi
- 90 Strongly Landlord-Friendly · R+11
- County
- — inherits STATE
- City
- — inherits STATE
ZIP-level market 39206
- Home prices YoY
- -10.3%
- Rents YoY
- 2.8%
- Active inventory
- 119
- Price-to-rent
- 0.3×
Monthly cashflow live
- Estimated rent
- $1,454 high interval (Pro) →
- Mortgage (P&I)
- −$26
- Tax est. 1.5%
- −$6 /mo · $75/yr
- Insurance
- −$2
- HOA
- −$0
- Vacancy / Maint / Mgmt
- −$305
- Net cashflow
- $1,114
Break-even live
UW: 25.0% down · 7.5% · 30yr · 1.5% tax · 5.0% vac · 8.0% maint · 8.0% mgmt
Financing live
Cash to close
- Down payment
- $1,250
- Closing costs
- $150
- Reserves months
- —
- Total cash needed
- —
Loan-product check · same deal, 3 products live
Conventional
25% down · 7.5% · 30yr
- Down + closing
- —
- Monthly P&I
- —
- Monthly cashflow
- —
- DSCR
- —
- Eligible?
- —
Personal DTI + credit; lowest rate.
DSCR
20% down · 8.5% · 30yr
- Down + closing
- —
- Monthly P&I
- —
- Monthly cashflow
- —
- DSCR
- —
- Eligible?
- —
No personal income docs; deal must DSCR.
Hard money
10% down · 12.0% · 12mo
- Down + closing
- —
- Monthly P&I
- —
- Monthly cashflow
- —
- DSCR
- —
- Eligible?
- —
Short-term bridge; refi at stabilization.
Rent comps 23 comps
| Address | Beds | Baths | Sqft | Rent | $/sqft | DOM | Units | Dist |
|---|---|---|---|---|---|---|---|---|
| 521 Launcelot Rd Jackson, MS | 3.0 | 2.0 | 1346 | $1,423 | $1.06 | 43d | 1 | 0.25mi |
| 4858 Sheridan Dr Jackson, MS | 3.0 | 2.0 | 1300 | $1,550 | $1.19 | 23d | 1 | 0.27mi |
| 5255 Manhattan Rd Jackson, MS | 1.0–2.0 | 1.0–2.0 | 813 | $1,100 | $1.35 | 13d | 1 | 0.39mi |
| 4833 N State St Jackson, MS | 3.0 | 2.0 | 994 | $1,195 | $1.20 | 43d | 1 | 0.49mi |
| 4901 McWillie Cir Jackson, MS | 1.0–2.0 | 1.0–2.0 | 806 | $1,150 | $1.43 | 13d | 1 | 0.58mi |
| 4627 Estelle Dr Jackson, MS | 3.0 | 2.0 | 1489 | $1,475 | $0.99 | 23d | 1 | 0.63mi |
| 20 N Hill Pkwy Jackson, MS | 1.0–3.0 | 1.0–2.5 | 1046 | $900 | $0.86 | 13d | 31 | 0.81mi |
| 214 Melbourne Rd Jackson, MS | 3.0 | 2.0 | 1207 | $1,500 | $1.24 | 43d | 1 | 0.89mi |
| 724 Meadowbrook Rd Jackson, MS | 3.0 | 2.0 | 1593 | $2,150 | $1.35 | 43d | 1 | 1.00mi |
| 5155 Wayneland Dr Jackson, MS | 1.0–2.0 | 1.0–2.0 | 905 | $1,500 | $1.66 | 23d | 1 | 1.12mi |
| 200 Stillwood Dr Jackson, MS | 3.0 | 2.0 | 1088 | $1,300 | $1.19 | 13d | 1 | 1.18mi |
| 200 Stillwood Dr Jackson, MS | 3.0 | 2.0 | 1088 | $1,300 | $1.19 | 43d | 1 | 1.18mi |
| 3718 Northbrook Dr Jackson, MS | 2.0 | 1.0 | 942 | $1,050 | $1.11 | 23d | 1 | 1.21mi |
| 4426 Desoto St Jackson, MS | 3.0 | 1.0 | 1079 | $1,250 | $1.16 | 13d | 1 | 1.27mi |
| 4426 Desoto St Jackson, MS | 3.0 | 1.0 | 1079 | $1,250 | $1.16 | 23d | 1 | 1.27mi |
| 212 Pimlico Pl Jackson, MS | 3.0 | 2.0 | 1600 | $900 | $0.56 | 13d | 1 | 1.32mi |
| 425 Beasley Rd Jackson, MS | 2.0 | 1.0–2.0 | 995 | $885 | $0.89 | 13d | 3 | 1.34mi |
| 4220 Council Cir Jackson, MS | 3.0 | 2.5 | 1780 | $1,850 | $1.04 | 23d | 1 | 1.34mi |
| 4091 Pine Hill Dr Jackson, MS | 3.0 | 2.0 | 1551 | $3,000 | $1.93 | 23d | 1 | 1.36mi |
| 815 Berwood Dr Jackson, MS | 3.0 | 2.0 | 1248 | $1,300 | $1.04 | 43d | 1 | 1.38mi |
| 5301 Ridgewood Rd Jackson, MS | 3.0 | 2.0 | 1482 | $1,850 | $1.25 | 43d | 1 | 1.39mi |
| 4056 Redwing Ave Jackson, MS | 3.0 | 2.0 | 1678 | $1,850 | $1.10 | 43d | 1 | 1.41mi |
| 5544 Wayneland Dr Jackson, MS | 3.0 | 2.0 | 1800 | $1,831 | $1.02 | 43d | 1 | 1.49mi |
Listing history 19 events
-
2026-06-18days on market $5,000 Active 50 DOM
-
2026-06-17days on market $5,000 Active 49 DOM
-
2026-06-16days on market $5,000 Active 48 DOM
-
2026-06-15days on market $5,000 Active 47 DOM
-
2026-06-14days on market $5,000 Active 45 DOM
-
2026-06-13days on market $5,000 Active 44 DOM
-
2026-06-10days on market $5,000 Active 42 DOM
-
2026-06-09days on market $5,000 Active 41 DOM
-
2026-06-08days on market $5,000 Active 40 DOM
-
2026-06-07days on market $5,000 Active 39 DOM
-
2026-06-05days on market $5,000 Active 36 DOM
-
2026-06-03days on market $5,000 Active 35 DOM
-
2026-06-02days on market $5,000 Active 34 DOM
-
2026-06-01days on market $5,000 Active 33 DOM
-
2026-05-31days on market $5,000 Active 32 DOM
-
2026-05-30days on market $5,000 Active 31 DOM
-
2026-04-27$5,000 Active 57-char remark
-
1995-08-21soldstatus
-
1989-06-30soldstatus
ⓘ Source: listings_history table (triggers on properties + properties_extension) + one-shot
backfill from property_details.listing_events for pre-trigger history.
Climate risk First Street
- Flood 1/10 Low FEMA zone X (shaded) · 0% chance over 30 yrs
- Wildfire 1/10 Low
- Heat 7/10 Severe 7 d/yr ≥108°F today · 19 d/yr by 30 yrs out
- Wind 8/10 Severe 80% chance of damaging wind over 30 yrs
- Air quality 2/10 Low 0 unhealthy d/yr today · 1 by 30 yrs out
Nearby sold comps map
Loading sold comps map…
Walkable amenities ~0.75 mi
Loading nearby amenities…
Taxation est. · year 1
- Rental income
- $17,453
- − Mortgage interest
- −$280
- − Property taxes
- −$75
- − Insurance
- −$25
- − Repairs & maintenance
- −$1,396
- − Management
- −$1,396
- − Depreciation
- −$145
- Taxable income
- $14,135
- Est. tax owed @ 24.0%
- −$3,392
- After-tax cash flow
- $9,981/yr
For passive investors: Depreciation is non-cash, so a rental often shows a tax loss while cash-flowing — sheltering income. Rental losses are passive: they offset passive income freely, and up to $25,000/yr can offset ordinary (W-2) income if you actively participate and your MAGI is under $100k (phasing out to $0 by $150k); unused losses carry forward. On sale, claimed depreciation is recaptured at up to 25%, and gains may owe capital-gains tax (a 1031 exchange can defer both). Figures are a year-1 estimate at your 24.0% rate — not tax advice; consult a CPA.
Schools (NCES district)
- District
- Jackson Public School District
- NCES district ID
- 2802190
- Math proficiency
- 9% ▼ -14.00%
- Reading proficiency
- 18% ▼ -7.00%
- Median HH income
- $33,234
- Composite
- 10.89/100
- National rank
- #9755
- State rank
- #112 of 130 in MS
Livability — Jackson
- Score
- 68/100
- State rank
- #66
- US rank
- #9695
Category grades
Schools grade is shown separately in the Schools card above.
Census & demographics
- Census place
- Jackson, MS
- County
- Hinds County · 167,040 people
- City population
- 140,204
- Metro
- Jackson, MS
- Population (ZIP)
- 23,257
- Household income
- $42,686
- Rent vs Own
- Severe rent burden
- 1554.0
Population outlook (Hinds County) Hauer SSP2
- Today (2025)
- 242,528 people
- By 2030
- 241,113 · -0.6%
- By 2040
- 235,557 · -2.9%
- By 2050
- 226,946 · -6.4%
- By 2075
- 199,995 · -17.5%
- By 2100
- 164,165 · -32.3%
Race, ethnicity, and origin ACS 2023
- Neighborhood character
- Predominantly Black (85%)
- Race & ethnicity
- Black 85% White 9% Hispanic / Latino 3% Two or more races 3%
- Common ancestry
- Italian 1%
- Foreign-born
- 2% · Canada
- Languages at home
- 96% English-only · Spanish 3%
Political lean MEDSL · Hinds
- 2024 margin
- Solid D (+46.1) · D 72.4% · R 26.3% · Other 1.4%
- 2008→2024 swing
- +7.1pp toward D · 2008: 39.0pp · 2024: 46.1pp
- All cycles
- 2024: D+46.1 2020: D+48.3 2016: D+43.7 2012: D+45.1 2008: D+39.0
Not yet ingested
- Civics
- —
Market trends
- HPI YoY
- ▼ -22.38%
- Current HPI
- 194.5873
- Rent YoY
- ▲ 2.83%
- Metro
- Jackson, MS
- State GDP YoY
- —
- F500 in state
- 0
Price history
3 events — show timeline
- 2026-04-27 Listed $5,000 MLSU
- 1995-08-21 Sold (Public Records) — Public Records
- 1989-06-30 Sold (Public Records) — Public Records
Property tax history
+1.0%/yrLatest (2025): $939 · +1.6% YoY. Source: county tax records.
Cash-flow waterfall
monthlySold comps — $/sqft
last 12 mo · ≤1 miLoading sold comps…