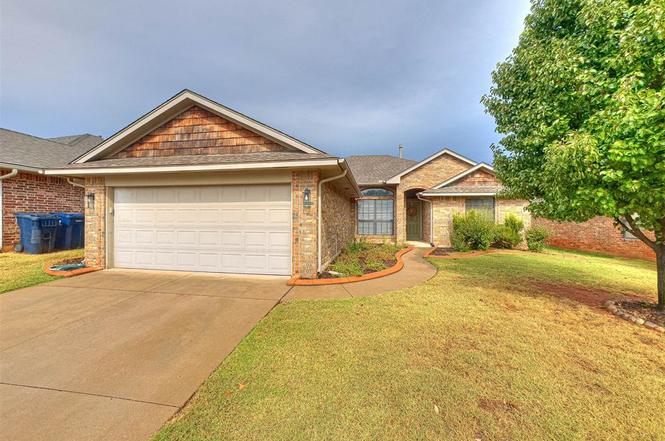
5013 NW 163rd Rd · Oklahoma City, OK
Flood risk 1/10 · Minimal
- FEMA flood zone
- X (unshaded)
- Chance of flooding over 30 yrs
- 0.0%
- Est. flood insurance / yr
- $507 – $1,088
Fire risk 4/10 · Minor
- Est. fire insurance / yr
- $2,463 – $4,575
Heat risk 6/10 · Moderate
- Hot days now (above 107°F)
- 7 days/yr
- Hot days in 30 yrs
- 19 days/yr
Wind risk 3/10 · Minor
- Chance of severe wind over 30 yrs
- 4.0%
Air-quality risk 2/10 · Minimal
- Unhealthy air days now
- 1 days/yr
- Unhealthy air days in 30 yrs
- 1 days/yr
Risk factors via First Street. Map © Google.
Why this score? — see what drove the D+ grade
The composite is a weighted blend of 9 inputs, each scored 0–100. Each bar is that input's sub-score; the figure is the points it added to the 100-point composite (weight × sub-score).
- ARV discount +13.4/15.0
- Cash flow +11.3/30.0
- Schools +4.1/10.0
- Livability +4.0/5.0
- DSCR +3.3/10.0
- Rent growth +3.3/5.0
- 1% rule +3.2/10.0
- Condition / age +2.5/5.0
- Appreciation +0.0/10.0
$249,000
🖨 Deal sheet (PDF) 📄 Offer letter ✓ Due diligence
Listing remarks MLS
AMAZING HOME WITH CLASSY COLORS & STYLE*CUSTOM LANDSCAPING W/CONCRETE EDGED FLOWER BEDS & SPRINKLER SYSTEM*KITCHEN IS OPEN W/LARGE ISLAND BAR W/STAINLESS APPLIANCES & SPACIOUS PANTRY*WOOD FLOORS IN WALKWAY*STACKED STONE FIREPLACE*SEPARATE MASTER SUITE W/LARGE TUB, SHOWER, DOUBLE SINKS & LARGE WALK-IN CLOSET*SPACIOUS BACK YARD W/EXTENDED CONCRETE PATIO*GARAGE HAS EXTRA WORKSPACE AREA & STORM SHELTER*WALKING TRAIL TO DEER CREEK ELEMENTARY*QUALITY
Key facts
- Tiled floors
- New fixtures
- Remodeled home
Tags
Property features AI
Finance
- Other: Storm shelter in garage floor
- HOA & community: Mandatory association dues; Association fee $300 (includes greenbelt)
Exterior
- Parking: Concrete parking; 2-car garage
- Utilities: Cable available; Electricity available; Natural gas available
- Home design: Single-family residence; One level; Faces south; Existing property
- Construction: Brick construction; Composition roof; Slab foundation
- Exterior features: Open patio; Wood fencing; Interior lot
Interior
- Kitchen: Built-in gas oven; Dishwasher; Disposal
- Bedrooms: 3 bedrooms
- Flooring: Tile flooring
- Bathrooms: 2 full bathrooms
- Interior features: In-law plan; Open patio; Masonry fireplace
- Laundry & utility: Garage door lift
Neighborhood map
What this means for you Summary
Snapshot
- This is a 3-bed/2.0-bath single-family listed at $249k.
Deal economics
- At list price, monthly cash flow is $-90 ($-1k/yr) — negative.
- To cash-flow at today's rent, offer at most $233k (6.4% below list).
- To meet the 1% rule (rent ≥ 1% of price), the offer needs to be $205k (17.7% below list).
- Recommended offer: $205k (17.7% below list) — sets the bar for 1% rule.
- Cap rate 5.9% vs local median 3.7% in Oklahoma City — top-decile yield for the area; either an underpriced asset or a hidden risk that comps aren't pricing in. Stress-test before assuming the spread holds.
Location & tenants
- Location reads 80/100 on livability (#3 in OK, #1,635 nationally) — a professional / high-income tenant draw. Strengths: amenities A+, commute A+, cost of living A+; Watch: crime F.
- Deer Creek (rural): math 41% / reading 44% proficiency, ranked #4 of 270 in OK (top 2%) — families likely to look elsewhere, expect single-tenant / working-renter base with shorter leases; only 7% free/reduced lunch — higher-income household profile.
- Zoned schools: Deer Creek Es (math 47% / reading 42%, grade F, #63 of 845 statewide, top 8%, 464 students, 0% FRL); Deer Creek Ms (math 35% / reading 43%, grade F, #10 of 345 statewide, top 3%, 1,179 students, 0% FRL); Deer Creek Hs (math 39% / reading 51%, grade D-, #13 of 447 statewide, top 3%, 2,036 students, 0% FRL).
- Market conditions: Rents rising (+3.1%/yr); 662 active listings in the ZIP; 16 comparable units currently listed for rent nearby; rentals leasing fast (median 4d on market — plan ~1-2 weeks tenant-placement turnaround); high-income renter base; 5,365 units permitted in Oklahoma County in 2024 (569 in 5+ unit buildings).
Forward outlook
- Local home prices are declining (-3.0%/yr); year-one equity from $2k of loan paydown is wiped out by about $7k of value loss. Plan a longer hold.
- Oklahoma County population projected at +41% by 2050 — long-run rental-demand tailwind backs the buy-and-hold thesis.
Negotiation context
- It's been on market 181 days — a 12% lower offer ($219k) is reasonable based on typical stale-listing flexibility.
- 6 sale attempts since 18y ago; this cycle's ask has dropped $36k (13%) from the opening price — seller is motivated, your offer sets the floor, not the list.
- Current owner paid $179k; 39% above their basis — modest negotiation headroom, anchor on the comps not their cost.
Risks & watch-outs
- Climate carrying-cost: extreme-heat days projected 7→19/yr by 2055 (HVAC capex compounding) — expect insurance premiums to compound above CPI over the hold.
Questions for the listing agent
- What do current leases actually rent for vs. the listed asking? Can we see a recent rent roll and the last 12 months of T-12 income?
- It's been on market 181 days. Have you received any prior offers? Is the seller open to a 18% concession, seller financing, or rate buy-down credit?
- What does the HOA fee cover, when was the last increase, and are there any pending special assessments or reserve-fund shortfalls?
- Why hasn't it sold? Are there any deal-killer items the seller is aware of (foundation, flood, title, zoning, code violations)?
- Is there a deadline driving the sale (1031 exchange, divorce, estate, relocation)? That informs how much negotiation room exists.
- Schools are F-rated, which usually means shorter tenancies and higher turnover. Who's the typical renter profile here, and what's been the actual vacancy rate?
- Crime grade is F in this area — have there been break-ins, vandalism, or insurance claims at this property in the last 3 years? What carrier currently insures it and at what premium?
- The area grade is low — what's the realistic commute time and amenity access for the typical tenant pool here? Any planned neighborhood developments (good or bad) we should know about?
- What's the average days-on-market for RENTAL listings here right now (not sales)? A rising rental-DOM trend means longer vacancies and softer asking-rent achievability than the comps imply.
- What's the recent tenant-quality profile in this submarket — average credit score on applications, eviction rate, late-payment / NSF rate, and stable-employment percentage? A property-management company in the area should have these aggregated.
- How much new for-sale + rental construction is in the pipeline within 1–3 miles? Heavy new supply typically softens prices + rents 12–24 months out; constrained supply supports both.
Investment metrics
- 1% rule
- 0.82% ✗
- Cap rate
- 5.86%
- Cash-on-cash
- -1.55%
- DSCR
- 0.93
- GRM
- 10.1
CMA / ARV
- ARV (on-the-fly)
- $286,352
- Comps found
- 12
Show comp detail 12 sales within ~0.75 mi
| Address | Dist | Beds/Ba | Sqft | Sold | Price | $/sf | Match |
|---|---|---|---|---|---|---|---|
| 5108 NW 163rd St | 0.04mi | 4/2.0 (+1) | 1,624 (-0%) | 0mo | $247,000 | $152 | 92 |
| 5109 NW 163 St | 0.04mi | 4/2.0 (+1) | 1,611 (-1%) | 10mo | $277,000 | $172 | 83 |
| 7912 NW 163rd St | 0.06mi | 3/2.0 | 1,700 (+4%) | 9mo | $374,950 | $221 | 82 |
| 16424 Monarch Field Rd | 0.18mi | 3/2.0 | 1,619 (-0%) | 11mo | $319,000 | $197 | 82 |
| 5112 NW 163rd St | 0.05mi | 3/2.0 | 1,532 (-6%) | 9mo | $269,900 | $176 | 81 |
| 15924 Sky Run Dr | 0.37mi | 4/2.0 (+1) | 1,648 (+1%) | 12mo | $290,000 | $176 | 66 |
| 15924 Prairie Run Dr | 0.35mi | 4/2.0 (+1) | 1,558 (-4%) | 8mo | $252,000 | $162 | 65 |
| 5905 NW 159th St | 0.70mi | 3/2.0 | 1,603 (-2%) | 2mo | $285,500 | $178 | 63 |
| 4709 NW 159th St | 0.35mi | 4/2.0 (+1) | 1,833 (+13%) | 3mo | $300,000 | $164 | 55 |
| 15920 Prairie Run Dr | 0.36mi | 3/2.0 | 1,402 (-14%) | 10mo | $260,000 | $185 | 52 |
| 4305 NW 164th Ter | 0.58mi | 3/2.0 | 1,804 (+11%) | 8mo | $280,000 | $155 | 48 |
| 15508 Homecoming Dr | 0.67mi | 4/2.5 (+1) | 1,866 (+15%) | 11mo | $325,000 | $174 | 28 |
Match score weights: distance 35% · size 25% · config 20% · recency 20%. Top-matched comps best support the ARV.
Projected returns pro-forma
-3.0% appreciation · 3.14% rent growth · sell at horizon
- IRR
- -18.7%
- Equity multiple
- 0.34×
- Total profit
- $-45,775
- Equity at exit
- $37,127
- IRR
- -10.8%
- Equity multiple
- 0.34×
- Total profit
- $-45,962
- Equity at exit
- $21,529
Cash invested: $69,720 (down + closing). Projections, not guarantees.
Landlord ↔ Tenant lean methodology
- Overall (STATE)
- 83 Strongly Landlord-Friendly
- State Oklahoma
- 83 Strongly Landlord-Friendly · R+20
- County
- — inherits STATE
- City
- — inherits STATE
ZIP-level market 73013
- Rents YoY
- 3.1%
- Active inventory
- 662
- Price-to-rent
- 10.1×
Monthly cashflow live
- Estimated rent
- $2,050 high interval (Pro) →
- Mortgage (P&I)
- −$1,306
- Tax from tax record
- −$275 /mo · $3,298/yr
- Insurance
- −$104
- HOA
- −$25
- Vacancy / Maint / Mgmt
- −$430
- Net cashflow
- $-90
Break-even live
Sensitivity live
| Price | -10% $51 | -5% $-20 | +0% $-90 | +5% $-161 | +10% $-231 |
|---|---|---|---|---|---|
| Rent | -10% $-252 | -5% $-171 | +0% $-90 | +5% $-9 | +10% $72 |
| Rate | -1.0pp $35 | -0.5pp $-27 | base $-90 | +0.5pp $-155 | +1.0pp $-220 |
UW: 25.0% down · 7.5% · 30yr · 1.5% tax · 5.0% vac · 8.0% maint · 8.0% mgmt
Financing live
Cash to close
- Down payment
- $62,250
- Closing costs
- $7,470
- Reserves months
- —
- Total cash needed
- —
Loan-product check · same deal, 3 products live
Conventional
25% down · 7.5% · 30yr
- Down + closing
- —
- Monthly P&I
- —
- Monthly cashflow
- —
- DSCR
- —
- Eligible?
- —
Personal DTI + credit; lowest rate.
DSCR
20% down · 8.5% · 30yr
- Down + closing
- —
- Monthly P&I
- —
- Monthly cashflow
- —
- DSCR
- —
- Eligible?
- —
No personal income docs; deal must DSCR.
Hard money
10% down · 12.0% · 12mo
- Down + closing
- —
- Monthly P&I
- —
- Monthly cashflow
- —
- DSCR
- —
- Eligible?
- —
Short-term bridge; refi at stabilization.
Rent comps 16 comps
| Address | Beds | Baths | Sqft | Rent | $/sqft | DOM | Units | Dist |
|---|---|---|---|---|---|---|---|---|
| 5108 NW 163rd St Edmond, OK | 4.0 | 2.0 | 1624 | $1,921 | $1.18 | 4d | 1 | 0.04mi |
| 4916 NW 164th Ter Edmond, OK | 3.0 | 2.0 | 1607 | $1,995 | $1.24 | 17d | 1 | 0.08mi |
| 3916 NW 164th St Edmond, OK | 1.0–2.0 | 1.0–2.0 | 1121 | $2,235 | $1.99 | 3d | 12 | 1.08mi |
| 3925 NW 166th Ter Edmond, OK | 3.0 | 3.0 | 2102 | $5,000 | $2.38 | 4d | 1 | 1.08mi |
| 15316 Hill Branch Rd Edmond, OK | 3.0 | 2.0 | 1489 | $1,849 | $1.24 | 23d | 1 | 1.14mi |
| 6528 NW 163rd Ter Edmond, OK | 4.0 | 2.0 | 1783 | $2,095 | $1.17 | 25d | 1 | 1.18mi |
| 6508 NW 157th St Edmond, OK | 3.0 | 2.0 | 1516 | $1,795 | $1.18 | 25d | 1 | 1.23mi |
| 15516 Potomac Dr Edmond, OK | 3.0 | 2.0 | 1234 | $1,695 | $1.37 | 3d | 1 | 1.28mi |
| 16209 Juliet Dr Edmond, OK | 3.0 | 2.0 | 1488 | $1,800 | $1.21 | 25d | 1 | 1.30mi |
| 16113 Juliet Dr Edmond, OK | 3.0 | 2.0 | 1625 | $1,890 | $1.16 | 4d | 1 | 1.30mi |
| 6705 NW 159th St Edmond, OK | 3.0 | 2.0 | 1665 | $1,875 | $1.13 | 4d | 1 | 1.30mi |
| 15512 Caney Dr Edmond, OK | 3.0 | 2.0 | 1457 | $1,795 | $1.23 | 3d | 1 | 1.33mi |
| 16009 Capulet Dr Edmond, OK | 4.0 | 2.0 | 1701 | $2,195 | $1.29 | 4d | 1 | 1.37mi |
| 6271 NW 178th Cir Edmond, OK | 4.0 | 2.0 | 2218 | $2,725 | $1.23 | 25d | 1 | 1.38mi |
| 6296 NW 178th Ter Edmond, OK | 3.0 | 2.0 | 1874 | $2,195 | $1.17 | 25d | 1 | 1.41mi |
| 15509 Ridley Dr Edmond, OK | 3.0 | 2.0 | 1682 | $1,995 | $1.19 | 3d | 1 | 1.49mi |
HOA detail
- Monthly dues
- $25 · $300/yr
- Likely covers
- landscaping
Listing history 17 events
-
2026-05-18status Active
-
2026-05-09status Pending
-
2026-05-09status Active
-
2026-04-18status Pending
-
2026-04-14price $249,000
-
2026-04-14price $245,000
-
2026-02-12price $269,000
-
2025-10-27$285,000 Active
-
2017-04-18historical
-
2017-02-17$180,000 Active
-
2015-07-02soldstatus $179,000
-
2015-06-26soldstatus $179,000 Sold 468-char remark
Show marketing remark (468 chars)
AMAZING HOME WITH CLASSY COLORS & STYLE*CUSTOM LANDSCAPING W/CONCRETE EDGED FLOWER BEDS & SPRINKLER SYSTEM*KITCHEN IS OPEN W/LARGE ISLAND BAR W/STAINLESS APPLIANCES & SPACIOUS PANTRY*WOOD FLOORS IN WALKWAY*STACKED STONE FIREPLACE*SEPARATE MASTER SUITE W/LARGE TUB, SHOWER, DOUBLE SINKS & LARGE WALK-IN CLOSET*SPACIOUS BACK YARD W/EXTENDED CONCRETE PATIO*GARAGE HAS EXTRA WORKSPACE AREA & STORM SHELTER*WALKING TRAIL TO DEER CREEK ELEMENTARY*QUALITY
-
2015-05-22status Pending 468-char remark
Show marketing remark (468 chars)
AMAZING HOME WITH CLASSY COLORS & STYLE*CUSTOM LANDSCAPING W/CONCRETE EDGED FLOWER BEDS & SPRINKLER SYSTEM*KITCHEN IS OPEN W/LARGE ISLAND BAR W/STAINLESS APPLIANCES & SPACIOUS PANTRY*WOOD FLOORS IN WALKWAY*STACKED STONE FIREPLACE*SEPARATE MASTER SUITE W/LARGE TUB, SHOWER, DOUBLE SINKS & LARGE WALK-IN CLOSET*SPACIOUS BACK YARD W/EXTENDED CONCRETE PATIO*GARAGE HAS EXTRA WORKSPACE AREA & STORM SHELTER*WALKING TRAIL TO DEER CREEK ELEMENTARY*QUALITY
-
2015-05-14$185,000 Active 468-char remark
Show marketing remark (468 chars)
AMAZING HOME WITH CLASSY COLORS & STYLE*CUSTOM LANDSCAPING W/CONCRETE EDGED FLOWER BEDS & SPRINKLER SYSTEM*KITCHEN IS OPEN W/LARGE ISLAND BAR W/STAINLESS APPLIANCES & SPACIOUS PANTRY*WOOD FLOORS IN WALKWAY*STACKED STONE FIREPLACE*SEPARATE MASTER SUITE W/LARGE TUB, SHOWER, DOUBLE SINKS & LARGE WALK-IN CLOSET*SPACIOUS BACK YARD W/EXTENDED CONCRETE PATIO*GARAGE HAS EXTRA WORKSPACE AREA & STORM SHELTER*WALKING TRAIL TO DEER CREEK ELEMENTARY*QUALITY
-
2008-08-12soldstatus $171,500
-
2008-08-07soldstatus $171,250
-
2008-04-27$174,900
ⓘ Source: listings_history table (triggers on properties + properties_extension) + one-shot
backfill from property_details.listing_events for pre-trigger history.
Tax reassessment forecast OK · Resets to sale price
- Current annual tax
- $3,298 · $275/mo
- Projected year-2 tax
- $3,298 · $275/mo
- Expected delta
- $0/yr ($0/mo · 0.0%)
ⓘ Screening estimate from a state-policy table — verify with the county assessor before closing.
Climate risk First Street
- Flood 1/10 Low FEMA zone X (unshaded) · 0% chance over 30 yrs
- Wildfire 4/10 Moderate
- Heat 6/10 Major 7 d/yr ≥107°F today · 19 d/yr by 30 yrs out
- Wind 3/10 Moderate 4% chance of damaging wind over 30 yrs
- Air quality 2/10 Low 1 unhealthy d/yr today · 1 by 30 yrs out
Nearby sold comps map
Loading sold comps map…
Walkable amenities ~0.75 mi
Loading nearby amenities…
Taxation est. · year 1
- Rental income
- $24,597
- − Mortgage interest
- −$13,948
- − Property taxes
- −$3,298
- − Insurance
- −$1,245
- − Repairs & maintenance
- −$1,968
- − Management
- −$1,968
- − HOA
- −$300
- − Depreciation
- −$7,244
- Taxable loss
- −$5,374
- Est. tax savings @ 24.0%
- +$1,290
- After-tax cash flow
- $208/yr
For passive investors: Depreciation is non-cash, so a rental often shows a tax loss while cash-flowing — sheltering income. Rental losses are passive: they offset passive income freely, and up to $25,000/yr can offset ordinary (W-2) income if you actively participate and your MAGI is under $100k (phasing out to $0 by $150k); unused losses carry forward. On sale, claimed depreciation is recaptured at up to 25%, and gains may owe capital-gains tax (a 1031 exchange can defer both). Figures are a year-1 estimate at your 24.0% rate — not tax advice; consult a CPA.
Schools (NCES district)
- District
- Deer Creek
- NCES district ID
- 4009570
- Math proficiency
- 41% ▼ -16.00%
- Reading proficiency
- 44% ▼ -14.00%
- Median HH income
- $101,218
- Composite
- 41.46/100
- National rank
- #3465
- State rank
- #4 of 270 in OK
Livability — Oklahoma City
- Score
- 80/100
- State rank
- #3
- US rank
- #1635
Category grades
Schools grade is shown separately in the Schools card above.
Census & demographics
- Census place
- Oklahoma City, OK
- County
- Oklahoma County · 771,644 people
- City population
- 498,656
- Metro
- Oklahoma City, OK
- Population (ZIP)
- 58,023
- Household income
- $113,870
- Rent vs Own
- Severe rent burden
- 1313.0
Population outlook (Oklahoma County) Hauer SSP2
- Today (2025)
- 911,875 people
- By 2030
- 982,413 · +7.7%
- By 2040
- 1,130,468 · +24.0%
- By 2050
- 1,288,422 · +41.3%
- By 2075
- 1,711,482 · +87.7%
- By 2100
- 2,088,448 · +129.0%
Race, ethnicity, and origin ACS 2023
- Neighborhood character
- Predominantly White (67%)
- Race & ethnicity
- White 67% Two or more races 11% Black 9% Asian 7% Hispanic / Latino 5% Native American 2%
- Hispanic origin (detail)
- Mexican 2%
- Common ancestry
- Slovak 3% Italian 2% Lithuanian 2%
- Foreign-born
- 7% · Canada, Vietnam
- Languages at home
- 91% English-only · Other Indo-European 3% Spanish 2% Vietnamese 1%
Political lean MEDSL · Oklahoma
- 2024 margin
- Toss-up / Even · D 48.0% · R 49.7% · Other 2.3%
- 2008→2024 swing
- +15.1pp toward D · 2008: -16.8pp · 2024: -1.7pp
- All cycles
- 2024: R+1.7 2020: R+1.1 2016: R+10.5 2012: R+16.7 2008: R+16.8
Not yet ingested
- Civics
- —
Market trends
- HPI YoY
- ▼ -201.41%
- Current HPI
- 214.2251
- Rent YoY
- ▲ 3.14%
- Metro
- Oklahoma City, OK
- State GDP YoY
- ▲ 1.55%
- F500 in state
- 6
Industry mix (Fortune 500 HQ in OK)
| Industry | F500 HQs | Revenue |
|---|---|---|
| Energy | 3 | $48B |
|
||
Price history
+42.4% since first listed17 events — show timeline
- 2026-05-18 Relisted — MLSOK
- 2026-05-09 Pending — MLSOK
- 2026-05-09 Relisted — MLSOK
- 2026-04-18 Pending — MLSOK
- 2026-04-14 Price Changed $249,000 MLSOK
- 2026-04-14 Price Changed $245,000 MLSOK
- 2026-02-12 Price Changed $269,000 MLSOK
- 2025-10-27 Listed $285,000 MLSOK
- 2017-04-18 Listing Removed — MLSOK
- 2017-02-17 Listed $180,000 MLSOK
- 2015-07-02 Sold (Public Records) $179,000 Public Records
- 2015-06-26 Sold (MLS) $179,000 MLSOK
- 2015-05-22 Pending — MLSOK
- 2015-05-14 Listed $185,000 MLSOK
- 2008-08-12 Sold (Public Records) $171,500 Public Records
- 2008-08-07 Sold (MLS) $171,250 MLSOK
- 2008-04-27 Listed $174,900 MLSOK
Property tax history
+2.7%/yrLatest (2025): $3,298 · +3.7% YoY. Source: county tax records.
Cash-flow waterfall
monthlySold comps — $/sqft
last 12 mo · ≤1 miLoading sold comps…