 🏷️ Likely Rental
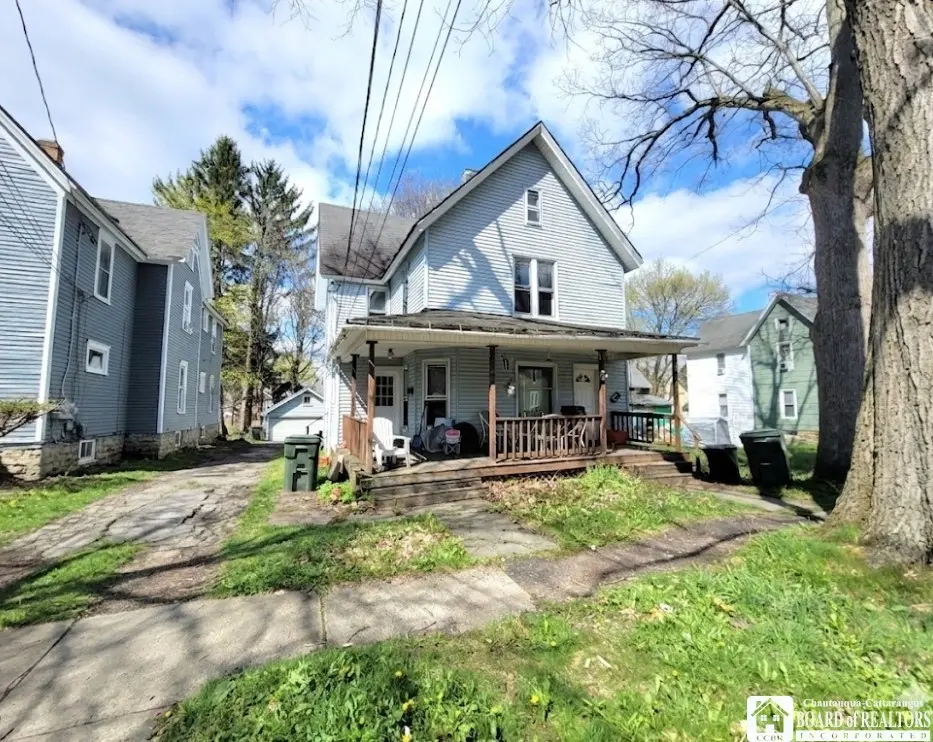
17 Columbia Ave · Jamestown, NY
Flood risk 1/10 · Minimal
- FEMA flood zone
- —
- Chance of flooding over 30 yrs
- 0.0%
- Est. flood insurance / yr
- —
Fire risk 1/10 · Minimal
- Est. fire insurance / yr
- $691 – $1,283
Heat risk 2/10 · Minimal
- Hot days now (above 91°F)
- 7 days/yr
- Hot days in 30 yrs
- 17 days/yr
Wind risk 1/10 · Minimal
- Chance of severe wind over 30 yrs
- —
Air-quality risk 2/10 · Minimal
- Unhealthy air days now
- 0 days/yr
- Unhealthy air days in 30 yrs
- 1 days/yr
Risk factors via First Street. Map © Google.
Why this score? — see what drove the B+ grade
The composite is a weighted blend of 9 inputs, each scored 0–100. Each bar is that input's sub-score; the figure is the points it added to the 100-point composite (weight × sub-score).
- Cash flow +30.0/30.0
- ARV discount +15.0/15.0
- 1% rule +10.0/10.0
- DSCR +10.0/10.0
- Livability +3.5/5.0
- Schools +3.1/10.0
- Rent growth +2.5/5.0
- Condition / age +2.5/5.0
- Appreciation +0.0/10.0
$69,900
🖨 Deal sheet (PDF) 📄 Offer letter ✓ Due diligence
Multi-family units
County records classify this as Multi-Family (2-4 Unit). Listing-text estimate: 2 units. confirmed
Listing remarks MLS
This solid two-family home is an excellent investment opportunity with reliable tenants already in place. The lower unit currently rents for $800 per month and the upper unit rents for $890 per month, with both tenants interested in staying. Whether you are looking to expand your investment portfolio or live in one unit while collecting rental income from the other, this property offers strong cash flow potential from day one. The home features low maintenance vinyl siding, a garage, and additional off-street parking. The upper unit is heated with gas, and the lower unit has electric heat. Tenants pay all of their own utilities, making this an attractive property with separate expenses for each unit. Additional updates include new electric panels installed in 2024 and a new hot water tank in 2025. This is a great opportunity for an investor or owner occupant looking for steady rental income.
Key facts
- Gas heat
- Electric heat
- 5,310 sq ft lot
Tags
Neighborhood map
What this means for you Summary
Snapshot
- This is a 2 × 2-bed/1.0-bath units multifamily listed at $70k.
Deal economics
- At list price, monthly cash flow is $1k ($14k/yr) — positive. Per door: $584/mo.
- The deal already cash-flows at list — no discount required.
- Meets the 1% rule at list price ($2k rent vs $70k).
- Recommended offer: $68k (3.0% below list) — sets the bar for market timing.
- Cap rate 26.3% vs local median 16.8% in Jamestown — top-decile yield for the area; either an underpriced asset or a hidden risk that comps aren't pricing in. Stress-test before assuming the spread holds.
Location & tenants
- Location reads 69/100 on livability (#470 in NY) — a middle-class / working-renter tenant base. Strengths: cost of living A+, housing A+, health & safety A+; Watch: amenities D, crime F, commute F.
- Jamestown City School District (town): math 33% / reading 42% proficiency, ranked #553 of 590 in NY (top 94%) — families likely to look elsewhere, expect single-tenant / working-renter base with shorter leases.
- Zoned schools: Milton J Fletcher Elementary School (math 27% / reading 42%, grade F, #1,577 of 2,108 statewide, top 77%, 530 students, 74% FRL); Thomas Jefferson Middle School (math 25% / reading 40%, grade F, #504 of 729 statewide, top 70%, 406 students, 79% FRL); Jamestown High School (math 87% / reading 92%, grade A+, #265 of 1,100 statewide, top 26%, 1,315 students, 80% FRL) — zoned schools average 77% FRL vs 60% district-wide (17 pts higher); higher-poverty schools than district average — tighter screening recommended.
- Zoned-school proficiency averages 52% at this address vs 38% district-wide (+15 pts) — the actual schools serving this property are materially stronger than the Jamestown City School District average implies; a family-tenant draw the district grade alone would hide.
- Market conditions: 315 active listings in the ZIP; 127 units permitted in Chautauqua County in 2024 (0 in 5+ unit buildings).
Forward outlook
- Local home prices are declining (-3.0%/yr); year-one equity from $483 of loan paydown is wiped out by about $2k of value loss. Plan a longer hold.
- Chautauqua County population projected at -22% by 2050 — secular population decline; favor cash flow + early exit over multi-decade hold.
- At projected returns (-3.0% appreciation + 3.0% rent growth), your $20k cash investment doubles in ~2 years — after that, you're playing with house money.
Negotiation context
- It's been on market 36 days — a 3% lower offer ($68k) is reasonable based on typical stale-listing flexibility.
- 7 sale attempts since 21y ago with the ask held roughly flat each time — persistent listings suggest the price (not the market) is what's stuck; bring a comps-based counter.
- Current owner paid $34k; list at $70k implies a 107% gain — meaningful room to come down on a strong offer.
Risks & watch-outs
- Watch-outs: property tax is 2.5% of price; built in 1890 — expect roof / HVAC / electrical / plumbing capex.
Questions for the listing agent
- It's been on market 36 days. Have you received any prior offers? Is the seller open to a 3% concession, seller financing, or rate buy-down credit?
- Can we see the unit-by-unit rent roll, current vacancy, and any below-market leases? What's the average tenancy length?
- What capital expenditures (roof, boiler, parking lot, exteriors) have been made in the last 5 years, and what's planned in the next 2?
- Built in 1890 — when were the roof, HVAC, electrical panel, plumbing, and water heater last replaced?
- Property tax is high relative to price — has the assessment been appealed recently, and will the sale trigger a re-assessment?
- Is there a deadline driving the sale (1031 exchange, divorce, estate, relocation)? That informs how much negotiation room exists.
- Crime grade is F in this area — have there been break-ins, vandalism, or insurance claims at this property in the last 3 years? What carrier currently insures it and at what premium?
- What's the average days-on-market for RENTAL listings here right now (not sales)? A rising rental-DOM trend means longer vacancies and softer asking-rent achievability than the comps imply.
- What's the recent tenant-quality profile in this submarket — average credit score on applications, eviction rate, late-payment / NSF rate, and stable-employment percentage? A property-management company in the area should have these aggregated.
- How much new apartment / multifamily construction is in the pipeline within 1–3 miles? Heavy new supply (>2% of stock underway) typically softens rents 12–24 months out; light construction supports rent growth.
Investment metrics
- 1% rule
- 3.10% ✓
- Cap rate
- 26.34%
- Cash-on-cash
- 71.59%
- DSCR
- 4.19
- GRM
- 2.7
CMA / ARV
- ARV (median comp)
- $99,077
- List price
- $69,900
- Delta
- -29.45%
- Verdict
- UNDERPRICED
- Comps
- 20 within 1.0 mi
Show comp detail 12 sales within ~0.75 mi
| Address | Dist | Beds/Ba | Sqft | Sold | Price | $/sf | Match |
|---|---|---|---|---|---|---|---|
| 15 Columbia Ave | 0.01mi | 5/2.0 | 2,380 (+6%) | 3mo | $50,000 | $21 | 86 |
| 144 Barrett Ave | 0.16mi | 5/2.0 | 2,352 (+5%) | 3mo | $50,000 | $21 | 81 |
| 47 Charles St | 0.23mi | 6/2.0 (+1) | 2,198 (-2%) | 4mo | $24,500 | $11 | 78 |
| 228 Forest Ave | 0.06mi | 4/2.0 (-1) | 2,080 (-7%) | 5mo | $11,000 | $5 | 76 |
| 506 Newland Ave | 0.10mi | 4/2.5 (-1) | 2,372 (+6%) | 3mo | $35,000 | $15 | 76 |
| 93 Barker St | 0.45mi | 5/2.0 | 2,190 (-2%) | 3mo | $8,000 | $4 | 73 |
| 149 Baker St | 0.46mi | 5/3.0 | 2,192 (-2%) | 2mo | $96,460 | $44 | 70 |
| 11 Mckinley Ave | 0.16mi | 5/3.0 | 2,008 (-10%) | 3mo | $54,000 | $27 | 69 |
| 215 Hazzard St | 0.43mi | 4/2.0 (-1) | 2,280 (+2%) | 4mo | $61,800 | $27 | 68 |
| 8 E Newland Ave | 0.51mi | 4/2.0 (-1) | 2,226 (-0%) | 4mo | $53,500 | $24 | 67 |
| 35 Baker St | 0.27mi | 6/2.0 (+1) | 2,450 (+10%) | 4mo | $40,000 | $16 | 63 |
| 131 Ivy St | 0.66mi | 6/3.0 (+1) | 2,316 (+4%) | 3mo | $50,000 | $22 | 51 |
Match score weights: distance 35% · size 25% · config 20% · recency 20%. Top-matched comps best support the ARV.
Projected returns pro-forma
-3.0% appreciation · 3.0% rent growth · sell at horizon
- IRR
- 71.3%
- Equity multiple
- 4.22×
- Total profit
- $63,112
- Equity at exit
- $10,422
- IRR
- 75.2%
- Equity multiple
- 8.72×
- Total profit
- $151,000
- Equity at exit
- $6,044
Cash invested: $19,572 (down + closing). Projections, not guarantees.
Landlord ↔ Tenant lean methodology
- Overall (STATE)
- 15 Strongly Tenant-Friendly
- State New York
- 15 Strongly Tenant-Friendly · D+10
- County
- — inherits STATE
- City
- — inherits STATE
ZIP-level market 14701
- Home prices YoY
- -18.5%
- Active inventory
- 315
- Price-to-rent
- 5.4×
Monthly cashflow live
- Estimated rent
- $2,164 medium interval (Pro) →
- Mortgage (P&I)
- −$367
- Tax from tax record
- −$146 /mo · $1,754/yr
- Insurance
- −$29
- HOA
- −$0
- Vacancy / Maint / Mgmt
- −$454
- Net cashflow
- $1,168
Break-even live
Sensitivity live
| Price | -10% $1,207 | -5% $1,187 | +0% $1,168 | +5% $1,148 | +10% $1,128 |
|---|---|---|---|---|---|
| Rent | -10% $997 | -5% $1,082 | +0% $1,168 | +5% $1,253 | +10% $1,339 |
| Rate | -1.0pp $1,203 | -0.5pp $1,185 | base $1,168 | +0.5pp $1,150 | +1.0pp $1,131 |
2-unit breakdown (identical units grouped — click to expand)
| Units | Beds | Baths | Est. rent |
|---|---|---|---|
| 2× units | 2 | 1 | $2,164 |
| #1 | 2 | 1 | $1,082 |
| #2 | 2 | 1 | $1,082 |
| Total (2 units) | $2,164 | ||
UW: 25.0% down · 7.5% · 30yr · 1.5% tax · 5.0% vac · 8.0% maint · 8.0% mgmt
Financing live
Cash to close
- Down payment
- $17,475
- Closing costs
- $2,097
- Reserves months
- —
- Total cash needed
- —
Loan-product check · same deal, 3 products live
Conventional
25% down · 7.5% · 30yr
- Down + closing
- —
- Monthly P&I
- —
- Monthly cashflow
- —
- DSCR
- —
- Eligible?
- —
Personal DTI + credit; lowest rate.
DSCR
20% down · 8.5% · 30yr
- Down + closing
- —
- Monthly P&I
- —
- Monthly cashflow
- —
- DSCR
- —
- Eligible?
- —
No personal income docs; deal must DSCR.
Hard money
10% down · 12.0% · 12mo
- Down + closing
- —
- Monthly P&I
- —
- Monthly cashflow
- —
- DSCR
- —
- Eligible?
- —
Short-term bridge; refi at stabilization.
Listing history 20 events
-
2026-04-20$69,900 Active 904-char remark
Show marketing remark (904 chars)
This solid two-family home is an excellent investment opportunity with reliable tenants already in place. The lower unit currently rents for $800 per month and the upper unit rents for $890 per month, with both tenants interested in staying. Whether you are looking to expand your investment portfolio or live in one unit while collecting rental income from the other, this property offers strong cash flow potential from day one. The home features low maintenance vinyl siding, a garage, and additional off-street parking. The upper unit is heated with gas, and the lower unit has electric heat. Tenants pay all of their own utilities, making this an attractive property with separate expenses for each unit. Additional updates include new electric panels installed in 2024 and a new hot water tank in 2025. This is a great opportunity for an investor or owner occupant looking for steady rental income.
-
2023-02-13soldstatus $33,800 Closed Sale or Rented 101-char remark
Show marketing remark (101 chars)
Great 7 Family Investment Property with Detached garage, Nice Southside location. Separate Utilities.
-
2023-02-10soldstatus $60,000
-
2022-10-13status Under Contract- Do Not Show 101-char remark
Show marketing remark (101 chars)
Great 7 Family Investment Property with Detached garage, Nice Southside location. Separate Utilities.
-
2022-10-07$45,000 Active 101-char remark
Show marketing remark (101 chars)
Great 7 Family Investment Property with Detached garage, Nice Southside location. Separate Utilities.
-
2020-12-17status Pending Sale
-
2020-12-15soldstatus $32,000 Closed Sale or Rented
-
2020-10-10historical Continue to Show- Under Contract
-
2020-09-04$36,000 Active
-
2019-10-01historical
-
2019-07-01status Active
-
2019-06-30historical
-
2019-03-08price $38,750
-
2018-09-29price $39,500
-
2018-07-07status Active
-
2018-06-22historical Continue to Show- Under Contract
-
2018-03-30$41,000 Active
-
2005-10-12soldstatus $35,000
-
2005-10-11soldstatus $35,000
-
2005-07-21$37,000
ⓘ Source: listings_history table (triggers on properties + properties_extension) + one-shot
backfill from property_details.listing_events for pre-trigger history.
Tax reassessment forecast NY · Partial reset (capped growth)
- Current annual tax
- $1,754 · $146/mo
- Projected year-2 tax
- $1,754 · $146/mo
- Expected delta
- $0/yr ($0/mo · 0.0%)
ⓘ Screening estimate from a state-policy table — verify with the county assessor before closing.
Climate risk First Street
- Flood 1/10 Low 0% chance over 30 yrs
- Wildfire 1/10 Low
- Heat 2/10 Low 7 d/yr ≥91°F today · 17 d/yr by 30 yrs out
- Wind 1/10 Low
- Air quality 2/10 Low 0 unhealthy d/yr today · 1 by 30 yrs out
Nearby sold comps map
Loading sold comps map…
Walkable amenities ~0.75 mi
Loading nearby amenities…
Taxation est. · year 1
- Rental income
- $25,968
- − Mortgage interest
- −$3,915
- − Property taxes
- −$1,754
- − Insurance
- −$350
- − Repairs & maintenance
- −$2,077
- − Management
- −$2,077
- − Depreciation
- −$2,033
- Taxable income
- $13,760
- Est. tax owed @ 24.0%
- −$3,303
- After-tax cash flow
- $10,710/yr
For passive investors: Depreciation is non-cash, so a rental often shows a tax loss while cash-flowing — sheltering income. Rental losses are passive: they offset passive income freely, and up to $25,000/yr can offset ordinary (W-2) income if you actively participate and your MAGI is under $100k (phasing out to $0 by $150k); unused losses carry forward. On sale, claimed depreciation is recaptured at up to 25%, and gains may owe capital-gains tax (a 1031 exchange can defer both). Figures are a year-1 estimate at your 24.0% rate — not tax advice; consult a CPA.
Schools (NCES district)
- District
- Jamestown City School District
- NCES district ID
- 3615630
- Math proficiency
- 33% ▼ -3.00%
- Reading proficiency
- 42% ▲ 5.00%
- Median HH income
- $32,240
- Composite
- 30.69/100
- National rank
- #6176
- State rank
- #553 of 590 in NY
Livability — Jamestown
- Score
- 69/100
- State rank
- #470
- US rank
- #8213
Category grades
Schools grade is shown separately in the Schools card above.
Census & demographics
- Census place
- Jamestown, NY
- County
- Chautauqua County · 38,461 people
- City population
- 38,461
- Metro
- Jamestown-Dunkirk-Fredonia, NY
- Population (ZIP)
- 38,461
- Household income
- $49,685
- Rent vs Own
- Severe rent burden
- 1838.0
Population outlook (Chautauqua County) Hauer SSP2
- Today (2025)
- 123,454 people
- By 2030
- 118,509 · -4.0%
- By 2040
- 107,311 · -13.1%
- By 2050
- 96,703 · -21.7%
- By 2075
- 76,757 · -37.8%
- By 2100
- 60,984 · -50.6%
Race, ethnicity, and origin ACS 2023
- Neighborhood character
- Predominantly White (82%)
- Race & ethnicity
- White 82% Hispanic / Latino 11% Two or more races 6% Black 3%
- Hispanic origin (detail)
- Puerto Rican 8%
- Common ancestry
- Romanian 6% Lithuanian 2% Slovak 2%
- Foreign-born
- 3% · Canada
- Languages at home
- 92% English-only · Spanish 6% Other Indo-European 1% French/Haitian/Cajun 1%
Political lean MEDSL · Chautauqua
- 2024 margin
- Strong R (+22.0) · D 39.0% · R 61.0%
- 2008→2024 swing
- -22.9pp toward R · 2008: 0.9pp · 2024: -22.0pp
- All cycles
- 2024: R+22.0 2020: R+19.8 2016: R+24.6 2012: R+8.2 2008: D+0.9
Not yet ingested
- Civics
- —
Market trends
- HPI YoY
- ▼ -58.93%
- Current HPI
- 259.402
- Rent YoY
- —
- Metro
- Jamestown-Dunkirk-Fredonia, NY
- State GDP YoY
- ▲ 2.60%
- F500 in state
- 92
Industry mix (Fortune 500 HQ in NY)
| Industry | F500 HQs | Revenue |
|---|---|---|
| Financial Services | 10 | $950B |
|
||
| Consumer Goods | 9 | $162B |
|
||
| Insurance | 4 | $225B |
|
||
| Telecommunications | 2 | $144B |
|
||
| Pharmaceuticals | 2 | $112B |
|
||
| Media / Entertainment | 2 | $69B |
|
||
Price history
+88.9% since first listed20 events — show timeline
- 2026-04-20 Listed $69,900 UNYREIS
- 2023-02-13 Sold (MLS) $33,800 UNYREIS
- 2023-02-10 Sold (Public Records) $60,000 Public Records
- 2022-10-13 Pending — UNYREIS
- 2022-10-07 Listed $45,000 UNYREIS
- 2020-12-17 Pending — UNYREIS
- 2020-12-15 Sold (MLS) $32,000 UNYREIS
- 2020-10-10 Contingent — UNYREIS
- 2020-09-04 Listed $36,000 UNYREIS
- 2019-10-01 Listing Removed — UNYREIS
- 2019-07-01 Relisted — UNYREIS
- 2019-06-30 Listing Removed — UNYREIS
- 2019-03-08 Price Changed $38,750 UNYREIS
- 2018-09-29 Price Changed $39,500 UNYREIS
- 2018-07-07 Relisted — UNYREIS
- 2018-06-22 Contingent — UNYREIS
- 2018-03-30 Listed $41,000 UNYREIS
- 2005-10-12 Sold (MLS) $35,000 UNYREIS
- 2005-10-11 Sold (Public Records) $35,000 Public Records
- 2005-07-21 Listed $37,000 UNYREIS
Property tax history
-5.2%/yrLatest (2025): $1,754 · +4.8% YoY. Source: county tax records.
Cash-flow waterfall
monthlySold comps — $/sqft
last 12 mo · ≤1 miLoading sold comps…