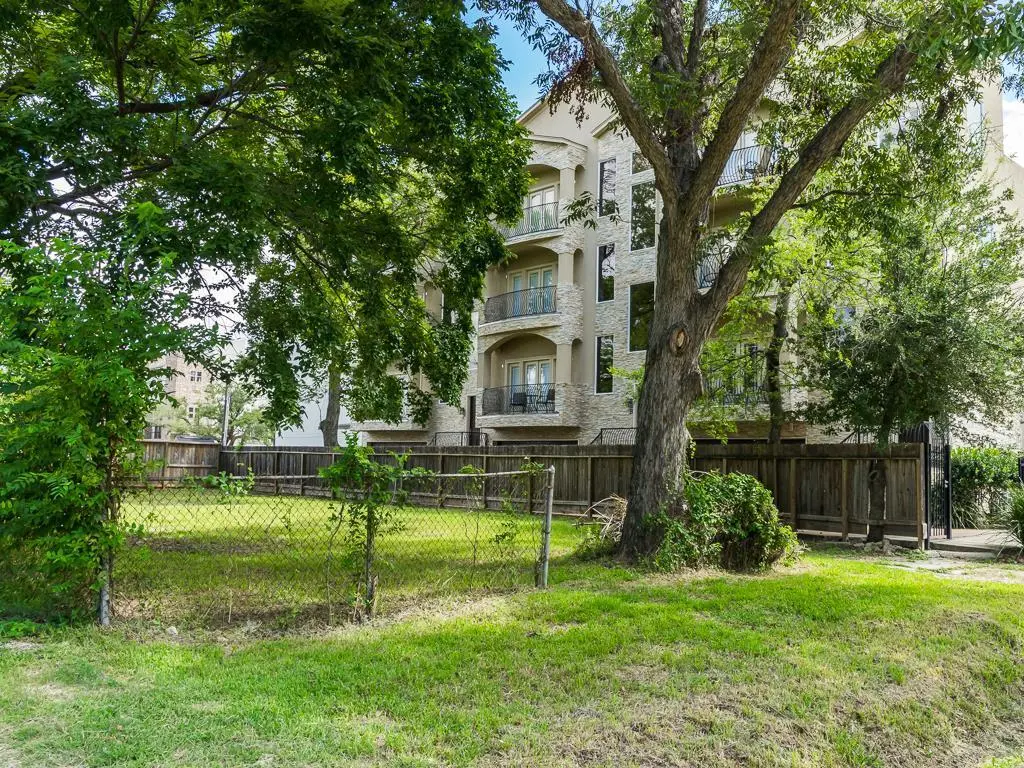
1912 Summer St Unit C · Houston, TX
Flood risk 1/10 · Minimal
- FEMA flood zone
- X (unshaded)
- Chance of flooding over 30 yrs
- 0.0%
- Est. flood insurance / yr
- $507 – $1,088
Fire risk 1/10 · Minimal
- Est. fire insurance / yr
- $1,222 – $2,270
Heat risk 9/10 · Severe
- Hot days now (above 109°F)
- 7 days/yr
- Hot days in 30 yrs
- 24 days/yr
Wind risk 9/10 · Severe
- Chance of severe wind over 30 yrs
- 99.0%
Air-quality risk 3/10 · Minor
- Unhealthy air days now
- 2 days/yr
- Unhealthy air days in 30 yrs
- 3 days/yr
Risk factors via First Street. Map © Google.
Why this score? — see what drove the C- grade
The composite is a weighted blend of 9 inputs, each scored 0–100. Each bar is that input's sub-score; the figure is the points it added to the 100-point composite (weight × sub-score).
- Cash flow +17.1/30.0
- ARV discount +15.0/15.0
- 1% rule +5.3/10.0
- DSCR +5.3/10.0
- Livability +3.7/5.0
- Schools +2.7/10.0
- Condition / age +2.5/5.0
- Rent growth +2.3/5.0
- Appreciation +0.0/10.0
$545,000
🖨 Deal sheet 📄 Offer letter ✓ Due diligence
Listing remarks
Contemporary Homes situated in booming eclectic Sawyer Heights with stunning downtown views from a large roof-top terrace. The roof-top terrace composite tiles and soft perimeter lighting. Gas Hook-up on both balconies for grilling. The interior of the home offers European high-gloss lacquer cabinets, premium hand laid hardwood floors and solid core wooden doors in every room. Additional features include Bosch & Samsung appliance package, wine chiller, quartz countertops, 9 ft. sliding glass pocket doors, 12 ft ceilings, and a premium hand laid water permeable driveway. This home also features a spacious walk-in closet with a large master bathroom and sliding glass windows in the bedr
Key facts
- 1,450 sq ft lot
- 2 garage spots
- Built 2016
Neighborhood map
What this means for you Summary
Snapshot
- This is a 3-bed/3.5-bath single-family listed at $545k.
Deal economics
- At list price, monthly cash flow is $378 ($5k/yr) — positive.
- The deal already cash-flows at list — no discount required.
- Meets the 1% rule at list price ($6k rent vs $545k).
- Cap rate 7.1% vs local median 3.2% in Houston — top-decile yield for the area; either an underpriced asset or a hidden risk that comps aren't pricing in. Stress-test before assuming the spread holds.
Location & tenants
- Location reads 74/100 on livability (#184 in TX, #4,771 nationally) — a middle-class / working-renter tenant base. Strengths: amenities A+, cost of living A+, housing A+; Watch: crime F.
- Houston ISD (urban): math 27% / reading 35% proficiency, ranked #593 of 826 in TX (top 72%) — families likely to look elsewhere, expect single-tenant / working-renter base with shorter leases; 71% free/reduced lunch — lower-income household profile, screen leases tightly.
- Zoned schools: Hogg Middle (math 44% / reading 48%, grade D+, #462 of 1,662 statewide, top 28%, 1,120 students, 52% FRL); Heights H S (math 27% / reading 57%, grade F, #730 of 1,632 statewide, top 47%, 2,476 students, 65% FRL).
- Zoned-school proficiency averages 44% at this address vs 31% district-wide (+13 pts) — the actual schools serving this property are materially stronger than the Houston ISD average implies; a family-tenant draw the district grade alone would hide.
- Market conditions: Rents soft (-0.8%/yr); 646 active listings in the ZIP; 19 comparable units currently listed for rent nearby; rentals lingering (median 44d on market — plan ~5-8 weeks vacancy on turnover, expect pricing pressure); 58% of comp listings sitting > 30 days — soft ceiling on asking rent; high-income renter base; 29,883 units permitted in Harris County in 2024 (8,621 in 5+ unit buildings).
- At $5,637/mo this rent would consume 47% of the median local household income ($145k/yr) (locally 1812% of renters already pay >50% of income on rent) — very limited rent-growth headroom before tenants either downsize or default.
Forward outlook
- Local home prices are declining (-3.0%/yr); year-one equity from $4k of loan paydown is wiped out by about $16k of value loss. Plan a longer hold.
- Harris County population projected at +47% by 2050 — long-run rental-demand tailwind backs the buy-and-hold thesis.
Negotiation context
- Only 14 days on market — expect competitive offers; lowballing is unlikely to land.
- 10 sale attempts since 11y ago; this cycle's ask has dropped $54k (9%) from the opening price — seller is motivated, your offer sets the floor, not the list.
Risks & watch-outs
- Climate carrying-cost: severe wind risk, 99% chance of damaging wind over 30y; extreme-heat days projected 7→24/yr by 2055 (HVAC capex compounding) — expect insurance premiums to compound above CPI over the hold.
Questions for the listing agent
- Is there a deadline driving the sale (1031 exchange, divorce, estate, relocation)? That informs how much negotiation room exists.
- Schools are D-rated, which usually means shorter tenancies and higher turnover. Who's the typical renter profile here, and what's been the actual vacancy rate?
- Crime grade is F in this area — have there been break-ins, vandalism, or insurance claims at this property in the last 3 years? What carrier currently insures it and at what premium?
- What's the average days-on-market for RENTAL listings here right now (not sales)? A rising rental-DOM trend means longer vacancies and softer asking-rent achievability than the comps imply.
- What's the recent tenant-quality profile in this submarket — average credit score on applications, eviction rate, late-payment / NSF rate, and stable-employment percentage? A property-management company in the area should have these aggregated.
- How much new for-sale + rental construction is in the pipeline within 1–3 miles? Heavy new supply typically softens prices + rents 12–24 months out; constrained supply supports both.
Investment metrics
- 1% rule
- 1.03% ✓
- Cap rate
- 7.12%
- Cash-on-cash
- 2.97%
- DSCR
- 1.13
- GRM
- 8.1
CMA / ARV
- ARV (on-the-fly)
- $798,624
- Comps found
- 12
Show comp detail 12 sales within ~0.75 mi
| Address | Dist | Beds/Ba | Sqft | Sold | Price | $/sf | Match |
|---|---|---|---|---|---|---|---|
| 1511 Crockett St Unit A | 0.28mi | 4/3.5 (+1) | 2,991 (+6%) | 4mo | $599,000 | $200 | 69 |
| 1702 Shearn St | 0.19mi | 3/3.5 | 2,465 (-13%) | 3mo | $549,000 | $223 | 67 |
| 1308 Edwards Unit B | 0.47mi | 4/4.5 (+1) | 2,840 (+0%) | 3mo | $799,900 | $282 | 66 |
| 2006 N Memorial Way | 0.63mi | 3/3.5 | 2,883 (+2%) | 2mo | $850,000 | $295 | 66 |
| 2020 Sabine St | 0.20mi | 3/3.0 | 2,485 (-12%) | 4mo | $475,000 | $191 | 65 |
| 912 Teetshorn St | 0.74mi | 3/2.5 | 2,814 (-1%) | 2mo | $1,149,000 | $408 | 59 |
| 1411 Beachton St | 0.60mi | 3/4.5 | 2,988 (+6%) | 4mo | $559,000 | $187 | 56 |
| 2713 Beauchamp St | 0.71mi | 4/3.5 (+1) | 3,002 (+6%) | 1mo | $1,059,900 | $353 | 51 |
| 2715 Beauchamp St | 0.71mi | 4/3.5 (+1) | 3,002 (+6%) | 2mo | $1,059,900 | $353 | 50 |
| 1104 Dart St | 0.61mi | 3/2.5 | 2,580 (-9%) | 3mo | $599,900 | $233 | 50 |
| 1315 Bingham St | 0.43mi | 3/2.5 | 2,454 (-13%) | 5mo | $500,000 | $204 | 50 |
| 1042 Voight St | 0.70mi | 4/3.5 (+1) | 3,194 (+13%) | 4mo | $1,099,900 | $344 | 38 |
Match score weights: distance 35% · size 25% · config 20% · recency 20%. Top-matched comps best support the ARV.
Projected returns pro-forma
-3.0% appreciation · 0.0% rent growth · sell at horizon
- IRR
- -15.3%
- Equity multiple
- 0.47×
- Total profit
- $-80,495
- Equity at exit
- $81,261
- IRR
- -13.4%
- Equity multiple
- 0.33×
- Total profit
- $-101,835
- Equity at exit
- $47,122
Cash invested: $152,600 (down + closing). Projections, not guarantees.
Landlord ↔ Tenant lean methodology
- Overall (STATE)
- 87 Strongly Landlord-Friendly
- State Texas
- 87 Strongly Landlord-Friendly · R+5
- County
- — inherits STATE
- City
- — inherits STATE
ZIP-level market 77007
- Rents YoY
- -0.8%
- Active inventory
- 646
- Price-to-rent
- 8.1×
Monthly cashflow live
- Estimated rent
- $5,637 high interval (Pro) →
- Mortgage (P&I)
- −$2,858
- Tax from tax record
- −$990 /mo · $11,884/yr
- Insurance
- −$227
- HOA
- −$0
- Vacancy / Maint / Mgmt
- −$1,184
- Net cashflow
- $378
Break-even live
UW: 25.0% down · 7.5% · 30yr · 1.5% tax · 5.0% vac · 8.0% maint · 8.0% mgmt
Financing live
Cash to close
- Down payment
- $136,250
- Closing costs
- $16,350
- Reserves months
- —
- Total cash needed
- —
Loan-product check · same deal, 3 products live
Conventional
25% down · 7.5% · 30yr
- Down + closing
- —
- Monthly P&I
- —
- Monthly cashflow
- —
- DSCR
- —
- Eligible?
- —
Personal DTI + credit; lowest rate.
DSCR
20% down · 8.5% · 30yr
- Down + closing
- —
- Monthly P&I
- —
- Monthly cashflow
- —
- DSCR
- —
- Eligible?
- —
No personal income docs; deal must DSCR.
Hard money
10% down · 12.0% · 12mo
- Down + closing
- —
- Monthly P&I
- —
- Monthly cashflow
- —
- DSCR
- —
- Eligible?
- —
Short-term bridge; refi at stabilization.
Rent comps 19 comps
| Address | Beds | Baths | Sqft | Rent | $/sqft | DOM | Units | Dist |
|---|---|---|---|---|---|---|---|---|
| 2018 Crockett St Unit 1029793P Houston, TX | 3.0 | 3.5 | 2507 | $6,482 | $2.59 | 5d | 1 | 0.09mi |
| 2018 Crockett St Unit 2018 Houston, TX | 3.0 | 3.5 | 2514 | $8,000 | $3.18 | 43d | 1 | 0.09mi |
| 2114 Sabine St Houston, TX | 3.0 | 4.0 | 2020 | $3,200 | $1.58 | 43d | 1 | 0.26mi |
| 2114 Sabine St Unit 1257735P Houston, TX | 3.0 | 3.5 | 2594 | $6,588 | $2.54 | 43d | 1 | 0.26mi |
| 1116 Woodland St Houston, TX | 3.0 | 2.0 | 2400 | $4,000 | $1.67 | 43d | 1 | 1.02mi |
| 3131 Memorial Ct Houston, TX | 2.0 | 1.0–2.5 | 1336 | $3,418 | $2.56 | 2d | 32 | 1.04mi |
| 2403 Everett St Unit A Houston, TX | 3.0 | 3.5 | 2093 | $2,800 | $1.34 | 43d | 1 | 1.12mi |
| 414 Milam St Unit 447 Houston, TX | 3.0 | 2.0 | 2421 | $8,991 | $3.71 | 11d | 1 | 1.13mi |
| 414 Milam St Unit 510 Houston, TX | 3.0 | 2.0 | 2421 | $9,230 | $3.81 | 14d | 1 | 1.13mi |
| 414 Milam St Unit 3165 Houston, TX | 3.0 | 2.0 | 2421 | $8,959 | $3.70 | 3d | 1 | 1.13mi |
| 414 Milam St Unit 447 Houston, TX | 3.0 | 2.0 | 2421 | $8,973 | $3.71 | 43d | 1 | 1.13mi |
| 414 Milam St Ph 2-4602 Houston, TX | 2.0 | 2.0 | 2158 | $8,990 | $4.17 | 43d | 1 | 1.14mi |
| 710 Stanford St Houston, TX | 3.0 | 4.0 | 2438 | $3,490 | $1.43 | 43d | 1 | 1.19mi |
| 909 Texas Ave Houston, TX | 2.0 | 1.0–2.0 | 1262 | $3,129 | $2.48 | 1d | 36 | 1.23mi |
| 915 Texas Ave Unit 420 Houston, TX | 3.0 | 2.0 | 2366 | $4,655 | $1.97 | 19d | 1 | 1.28mi |
| 915 Texas Ave Unit 420 Houston, TX | 3.0 | 2.0 | 2366 | $4,655 | $1.97 | 43d | 1 | 1.28mi |
| 1118 Columbus St Unit A Houston, TX | 3.0 | 3.5 | 2338 | $3,000 | $1.28 | 43d | 1 | 1.41mi |
| 401 Walton St Houston, TX | 3.0 | 2.0 | 2112 | $2,500 | $1.18 | 15d | 1 | 1.47mi |
| 1211 Marconi St Houston, TX | 4.0 | 3.5 | 3020 | $4,500 | $1.49 | 43d | 1 | 1.47mi |
Listing history 44 events
-
2026-06-18days on market $545,000 Coming Soon 14 DOM
-
2026-06-17days on market $545,000 Coming Soon 13 DOM
-
2026-06-16days on market $545,000 Coming Soon 12 DOM
-
2026-06-15days on market $545,000 Coming Soon 11 DOM
-
2026-06-13days on market $545,000 Coming Soon 9 DOM
-
2026-06-09days on market $545,000 Coming Soon 5 DOM
-
2026-06-08days on market $545,000 Coming Soon 4 DOM
-
2026-06-08price $545,000 Coming Soon 3 DOM
-
2026-06-07days on market $599,000 Coming Soon 3 DOM
-
2026-06-04days on market $599,000 Coming Soon 18 DOM
-
2026-06-01days on market $599,000 Coming Soon 15 DOM
-
2026-05-31days on market $599,000 Coming Soon 14 DOM
-
2026-05-18historical $599,000
-
2026-05-17historical
-
2026-05-17$599,000
-
2025-02-25historical
-
2025-01-05$599,000 Active
-
2024-04-19historical $3,400
-
2024-04-10price $3,400
-
2024-03-20historical
-
2024-03-08$3,600
-
2023-11-17$559,000 Active
-
2021-05-13historical
-
2021-03-17price $525,000
-
2021-03-17status Active
-
2021-03-05status Pending, Continue to Show
-
2021-02-03$547,180 Active
-
2019-02-07historical
-
2019-01-31$476,500 Active
-
2019-01-27historical
-
2018-10-24price $448,000
-
2018-10-03price $458,000
-
2018-08-29price $478,000
-
2018-07-01$495,000 Active
-
2018-04-02soldstatus
-
2018-03-21historical
-
2017-11-26$499,990 Active
-
2015-11-10soldstatus
-
2015-11-06historical
-
2015-11-06soldstatus Sold
-
2015-10-06status Pending
-
2015-09-28status Option Pending
-
2015-09-18$250,000 Active
-
1988-01-02soldstatus
ⓘ Source: listings_history table (triggers on properties + properties_extension) + one-shot
backfill from property_details.listing_events for pre-trigger history.
Tax reassessment forecast TX · Resets to sale price
- Current annual tax
- $11,884 · $990/mo
- Projected year-2 tax
- $11,884 · $990/mo
- Expected delta
- $0/yr ($0/mo · 0.0%)
ⓘ Screening estimate from a state-policy table — verify with the county assessor before closing.
Climate risk First Street
- Flood 1/10 Low FEMA zone X (unshaded) · 0% chance over 30 yrs
- Wildfire 1/10 Low
- Heat 9/10 Extreme 7 d/yr ≥109°F today · 24 d/yr by 30 yrs out
- Wind 9/10 Extreme 99% chance of damaging wind over 30 yrs
- Air quality 3/10 Moderate 2 unhealthy d/yr today · 3 by 30 yrs out
Nearby sold comps map
Loading sold comps map…
Walkable amenities ~0.75 mi
Loading nearby amenities…
Taxation est. · year 1
- Rental income
- $67,644
- − Mortgage interest
- −$30,528
- − Property taxes
- −$11,884
- − Insurance
- −$2,725
- − Repairs & maintenance
- −$5,412
- − Management
- −$5,412
- − Depreciation
- −$15,855
- Taxable loss
- −$4,171
- Est. tax savings @ 24.0%
- +$1,001
- After-tax cash flow
- $5,535/yr
For passive investors: Depreciation is non-cash, so a rental often shows a tax loss while cash-flowing — sheltering income. Rental losses are passive: they offset passive income freely, and up to $25,000/yr can offset ordinary (W-2) income if you actively participate and your MAGI is under $100k (phasing out to $0 by $150k); unused losses carry forward. On sale, claimed depreciation is recaptured at up to 25%, and gains may owe capital-gains tax (a 1031 exchange can defer both). Figures are a year-1 estimate at your 24.0% rate — not tax advice; consult a CPA.
Schools (NCES district)
- District
- Houston ISD
- NCES district ID
- 4823640
- Math proficiency
- 27% ▼ -18.00%
- Reading proficiency
- 35% ▼ -6.00%
- Median HH income
- $46,054
- Composite
- 26.63/100
- National rank
- #7173
- State rank
- #593 of 826 in TX
Livability — Houston
- Score
- 74/100
- State rank
- #184
- US rank
- #4771
Category grades
Schools grade is shown separately in the Schools card above.
Census & demographics
- Census place
- Houston, TX
- County
- Harris County · 4,702,590 people
- City population
- 3,226,434
- Metro
- Houston-The Woodlands-Sugar Land, TX
- Population (ZIP)
- 47,808
- Household income
- $144,911
- Rent vs Own
- Severe rent burden
- 1812.0
Population outlook (Harris County) Hauer SSP2
- Today (2025)
- 5,571,493 people
- By 2030
- 6,089,821 · +9.3%
- By 2040
- 7,142,806 · +28.2%
- By 2050
- 8,185,864 · +46.9%
- By 2075
- 10,574,329 · +89.8%
- By 2100
- 12,109,958 · +117.4%
Race, ethnicity, and origin ACS 2023
- Neighborhood character
- Diverse neighborhood (Simpson 0.63)
- Race & ethnicity
- White 57% Hispanic / Latino 17% Two or more races 13% Asian 11% Black 9%
- Hispanic origin (detail)
- Mexican 12%
- Common ancestry
- Slovak 3% Romanian 3% Italian 3%
- Foreign-born
- 19% · Canada, China, South Korea
- Languages at home
- 75% English-only · Spanish 12% Other Indo-European 4% Chinese 2%
Political lean MEDSL · Harris
- 2024 margin
- Lean D (+5.5) · D 52.0% · R 46.4% · Other 1.6%
- 2008→2024 swing
- +3.9pp toward D · 2008: 1.6pp · 2024: 5.5pp
- All cycles
- 2024: D+5.5 2020: D+13.3 2016: D+12.4 2012: D+0.1 2008: D+1.6
Not yet ingested
- Civics
- —
Market trends
- HPI YoY
- ▼ -219.42%
- Current HPI
- 159.8157
- Rent YoY
- ▼ -0.83%
- Metro
- Houston-The Woodlands-Sugar Land, TX
- State GDP YoY
- ▲ 3.95%
- F500 in state
- 110
Industry mix (Fortune 500 HQ in TX)
| Industry | F500 HQs | Revenue |
|---|---|---|
| Energy | 16 | $1,198B |
|
||
| Technology | 5 | $198B |
|
||
| Engineering / Construction | 4 | $72B |
|
||
| Energy Services | 3 | $60B |
|
||
| Utilities | 3 | $41B |
|
||
| Healthcare | 2 | $330B |
|
||
Price history
+139.6% since first listed32 events — show timeline
- 2026-05-18 Coming Soon $599,000 HARMLS
- 2026-05-17 Listed $599,000 HARMLS
- 2026-05-17 Listing Removed — HARMLS
- 2025-02-25 Listing Removed — HARMLS
- 2025-01-05 Listed $599,000 HARMLS
- 2024-04-19 Rental Removed $3,400 HARMLS
- 2024-04-10 Price Changed $3,400 HARMLS
- 2024-03-20 Listing Removed — HARMLS
- 2024-03-08 Listed for Rent $3,600 HARMLS
- 2023-11-17 Listed $559,000 HARMLS
- 2021-05-13 Listing Removed — HARMLS
- 2021-03-17 Price Changed $525,000 HARMLS
- 2021-03-17 Relisted — HARMLS
- 2021-03-05 Pending — HARMLS
- 2021-02-03 Listed $547,180 HARMLS
- 2019-02-07 Listing Removed — HARMLS
- 2019-01-31 Listed $476,500 HARMLS
- 2019-01-27 Listing Removed — HARMLS
- 2018-10-24 Price Changed $448,000 HARMLS
- 2018-10-03 Price Changed $458,000 HARMLS
- 2018-08-29 Price Changed $478,000 HARMLS
- 2018-07-01 Listed $495,000 HARMLS
- 2018-04-02 Sold (Public Records) — Public Records
- 2018-03-21 Listing Removed — HARMLS
- 2017-11-26 Listed $499,990 HARMLS
- 2015-11-10 Sold (Public Records) — Public Records
- 2015-11-06 Listing Removed — HARMLS
- 2015-11-06 Sold (MLS) — HARMLS
- 2015-10-06 Pending — HARMLS
- 2015-09-28 Pending — HARMLS
- 2015-09-18 Listed $250,000 HARMLS
- 1988-01-02 Sold (Public Records) — Public Records
Property tax history
+10.2%/yrLatest (2025): $11,884 · +5.9% YoY. Source: county tax records.
Cash-flow waterfall
monthlySold comps — $/sqft
last 12 mo · ≤1 miLoading sold comps…