700 Rue Chambord · Terre du Lac, MO
Flood risk 1/10 · Minimal
- FEMA flood zone
- X (unshaded)
- Chance of flooding over 30 yrs
- 0.0%
- Est. flood insurance / yr
- $507 – $1,088
Fire risk 3/10 · Minor
- Est. fire insurance / yr
- $1,054 – $1,958
Heat risk 4/10 · Minor
- Hot days now (above 106°F)
- 7 days/yr
- Hot days in 30 yrs
- 18 days/yr
Wind risk 2/10 · Minimal
- Chance of severe wind over 30 yrs
- 1.0%
Air-quality risk 1/10 · Minimal
- Unhealthy air days now
- 0 days/yr
- Unhealthy air days in 30 yrs
- 0 days/yr
Risk factors via First Street. Map © Google.
Why this score? — see what drove the B- grade
The composite is a weighted blend of 9 inputs, each scored 0–100. Each bar is that input's sub-score; the figure is the points it added to the 100-point composite (weight × sub-score).
- Cash flow +30.0/30.0
- 1% rule +10.0/10.0
- DSCR +10.0/10.0
- ARV discount +7.5/15.0
- Livability +3.2/5.0
- Schools +3.0/10.0
- Rent growth +2.5/5.0
- Condition / age +2.5/5.0
- Appreciation +0.0/10.0
$54,900
🖨 Deal sheet 📄 Offer letter ✓ Due diligence
Listing remarks MLS
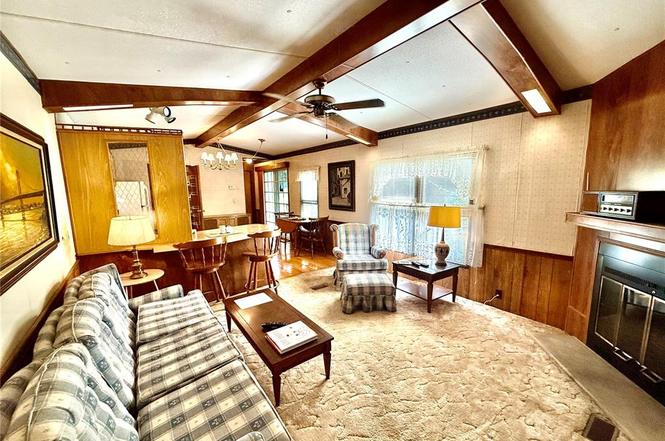
Why rent when you can own this charming 2 bedroom, 2 bath home with large addition on large corner lot? Move in ready. Most furniture including dining set and professional billiards table will stay. Range, refrigerator, dishwasher, washer, & dryer to stay as well. Free 50+ tv channels with antenna system to stay with house. Large storage shed. Spacious deck. Carport Terre Du Lac amenities for owners.
Key facts
- Kitchen appliances
- Carport
- Spacious deck
Tags
Property features AI
Finance
- HOA & community: Part of Terre Du Lac community; Annual association fee; Association amenities include beach access, boat dock, boating, lake, park, playground and common ground; association management and common area/road maintenance provided
Exterior
- Parking: Carport with space for 2 vehicles
- Utilities: Community water; Public sewer; 220 volt electric; Electricity, sewer and water connected
- Home design: Manufactured home (single level)
- Construction: Vinyl siding and other construction materials; Shingle roof
- Exterior features: Deck; Porch; Corner lot; Asphalt road frontage
Interior
- Kitchen: Dishwasher; Range; Refrigerator
- Bedrooms: Two bedrooms on the main level
- Flooring: Carpet; Hardwood; Linoleum
- Bathrooms: Two full bathrooms on the main level
- Heating & cooling: Electric forced air heating; Central air; Wall/window unit(s)
- Interior features: Fireplace in the living room; Ceiling fan(s)
- Laundry & utility: Washer; Dryer; Dedicated laundry room on main level (10 x 5)
Neighborhood map
What this means for you Summary
Snapshot
- This is a 3-bed/1.0-bath manufactured listed at $55k.
Deal economics
- At list price, monthly cash flow is $528 ($6k/yr) — positive.
- The deal already cash-flows at list — no discount required.
- Meets the 1% rule at list price ($1k rent vs $55k).
- Cap rate 17.8% vs local median 2.3% in Terre du Lac — top-decile yield for the area; either an underpriced asset or a hidden risk that comps aren't pricing in. Stress-test before assuming the spread holds.
Location & tenants
- Location reads 65/100 on livability (#267 in MO) — a middle-class / working-renter tenant base. Strengths: cost of living A+, housing A+, crime A; Watch: amenities F, commute F, health & safety F.
- North St. Francois County R-I (town): math 29% / reading 42% proficiency, ranked #214 of 324 in MO (top 66%) — families likely to look elsewhere, expect single-tenant / working-renter base with shorter leases.
- Zoned schools: North County Primary (750 students, 56% FRL); North Co. Sr. High (math 25% / reading 56%, grade F, #240 of 521 statewide, top 46%, 873 students, 48% FRL) — zoned schools at 52% FRL track the district average.
- Market conditions: 131 active listings in the ZIP; 134 units permitted in St. Francois County in 2024 (32 in 5+ unit buildings).
Forward outlook
- Local home prices are declining (-3.0%/yr); year-one equity from $380 of loan paydown is wiped out by about $2k of value loss. Plan a longer hold.
- At projected returns (-3.0% appreciation + 3.0% rent growth), your $15k cash investment doubles in ~3 years — after that, you're playing with house money.
Negotiation context
- Only 1 days on market — expect competitive offers; lowballing is unlikely to land.
- 4 sale attempts since 2y ago with the ask held roughly flat each time — persistent listings suggest the price (not the market) is what's stuck; bring a comps-based counter.
Questions for the listing agent
- What does the HOA fee cover, when was the last increase, and are there any pending special assessments or reserve-fund shortfalls?
- Is there a deadline driving the sale (1031 exchange, divorce, estate, relocation)? That informs how much negotiation room exists.
- Schools are D-rated, which usually means shorter tenancies and higher turnover. Who's the typical renter profile here, and what's been the actual vacancy rate?
- What's the average days-on-market for RENTAL listings here right now (not sales)? A rising rental-DOM trend means longer vacancies and softer asking-rent achievability than the comps imply.
- What's the recent tenant-quality profile in this submarket — average credit score on applications, eviction rate, late-payment / NSF rate, and stable-employment percentage? A property-management company in the area should have these aggregated.
- How much new for-sale + rental construction is in the pipeline within 1–3 miles? Heavy new supply typically softens prices + rents 12–24 months out; constrained supply supports both.
Investment metrics
- 1% rule
- 2.12% ✓
- Cap rate
- 17.82%
- Cash-on-cash
- 41.18%
- DSCR
- 2.83
- GRM
- 3.9
CMA / ARV
- ARV (on-the-fly)
- $54,940
- Comps found
- 2
Show comp detail 2 sales within ~0.75 mi
| Address | Dist | Beds/Ba | Sqft | Sold | Price | $/sf | Match |
|---|---|---|---|---|---|---|---|
| 700 N Rue Chambord | 0.00mi | 2/2.0 (-1) | 1,340 (0%) | 8mo | $44,900 | $34 | 84 |
| 819 Rue Dauphine #817 | 0.10mi | 3/2.0 | 1,216 (-9%) | 6mo | $49,900 | $41 | 71 |
Match score weights: distance 35% · size 25% · config 20% · recency 20%. Top-matched comps best support the ARV.
Projected returns pro-forma
-3.0% appreciation · 3.0% rent growth · sell at horizon
- IRR
- 37.7%
- Equity multiple
- 2.61×
- Total profit
- $24,730
- Equity at exit
- $8,186
- IRR
- 44.3%
- Equity multiple
- 5.22×
- Total profit
- $64,903
- Equity at exit
- $4,747
Cash invested: $15,372 (down + closing). Projections, not guarantees.
Landlord ↔ Tenant lean methodology
- Overall (STATE)
- 81 Strongly Landlord-Friendly
- State Missouri
- 81 Strongly Landlord-Friendly · R+10
- County
- — inherits STATE
- City
- — inherits STATE
ZIP-level market 63628
- Home prices YoY
- -7.2%
- Active inventory
- 131
- Price-to-rent
- 3.9×
Monthly cashflow live
- Estimated rent
- $1,163 medium interval (Pro) →
- Mortgage (P&I)
- −$288
- Tax from tax record
- −$12 /mo · $149/yr
- Insurance
- −$23
- HOA
- −$68
- Vacancy / Maint / Mgmt
- −$244
- Net cashflow
- $528
Break-even live
UW: 25.0% down · 7.5% · 30yr · 1.5% tax · 5.0% vac · 8.0% maint · 8.0% mgmt
Financing live
Cash to close
- Down payment
- $13,725
- Closing costs
- $1,647
- Reserves months
- —
- Total cash needed
- —
Loan-product check · same deal, 3 products live
Conventional
25% down · 7.5% · 30yr
- Down + closing
- —
- Monthly P&I
- —
- Monthly cashflow
- —
- DSCR
- —
- Eligible?
- —
Personal DTI + credit; lowest rate.
DSCR
20% down · 8.5% · 30yr
- Down + closing
- —
- Monthly P&I
- —
- Monthly cashflow
- —
- DSCR
- —
- Eligible?
- —
No personal income docs; deal must DSCR.
Hard money
10% down · 12.0% · 12mo
- Down + closing
- —
- Monthly P&I
- —
- Monthly cashflow
- —
- DSCR
- —
- Eligible?
- —
Short-term bridge; refi at stabilization.
HOA detail
- Monthly dues
- $68 · $816/yr
Listing history 2 events
-
2026-06-16remarks 315-char remark
-
2026-06-16$54,900 Active 1 DOM
ⓘ Source: listings_history table (triggers on properties + properties_extension) + one-shot
backfill from property_details.listing_events for pre-trigger history.
Tax reassessment forecast MO · Resets to sale price
- Current annual tax
- $149 · $12/mo
- Projected year-2 tax
- $533 · $44/mo
- Expected delta
- +$384/yr (+$32/mo · 257.4%)
ⓘ Screening estimate from a state-policy table — verify with the county assessor before closing.
Climate risk First Street
- Flood 1/10 Low FEMA zone X (unshaded) · 0% chance over 30 yrs
- Wildfire 3/10 Moderate
- Heat 4/10 Moderate 7 d/yr ≥106°F today · 18 d/yr by 30 yrs out
- Wind 2/10 Low 100% chance of damaging wind over 30 yrs
- Air quality 1/10 Low 0 unhealthy d/yr today · 0 by 30 yrs out
Nearby sold comps map
Loading sold comps map…
Walkable amenities ~0.75 mi
Loading nearby amenities…
Taxation est. · year 1
- Rental income
- $13,956
- − Mortgage interest
- −$3,075
- − Property taxes
- −$149
- − Insurance
- −$274
- − Repairs & maintenance
- −$1,116
- − Management
- −$1,116
- − HOA
- −$816
- − Depreciation
- −$1,597
- Taxable income
- $5,811
- Est. tax owed @ 24.0%
- −$1,395
- After-tax cash flow
- $4,936/yr
For passive investors: Depreciation is non-cash, so a rental often shows a tax loss while cash-flowing — sheltering income. Rental losses are passive: they offset passive income freely, and up to $25,000/yr can offset ordinary (W-2) income if you actively participate and your MAGI is under $100k (phasing out to $0 by $150k); unused losses carry forward. On sale, claimed depreciation is recaptured at up to 25%, and gains may owe capital-gains tax (a 1031 exchange can defer both). Figures are a year-1 estimate at your 24.0% rate — not tax advice; consult a CPA.
Schools (NCES district)
- District
- North St. Francois County R-I
- NCES district ID
- 2905430
- Math proficiency
- 29% ▼ -15.00%
- Reading proficiency
- 42% ▼ -5.00%
- Median HH income
- $40,156
- Composite
- 29.77/100
- National rank
- #6431
- State rank
- #214 of 324 in MO
Livability — Terre du Lac
- Score
- 65/100
- State rank
- #267
- US rank
- #12617
Category grades
Schools grade is shown separately in the Schools card above.
Census & demographics
- Census place
- Terre du Lac, MO
- Population (ZIP)
- 15,864
Population outlook (St. Francois County) Hauer SSP2
- Today (2025)
- 68,683 people
- By 2030
- 69,574 · +1.3%
- By 2040
- 70,665 · +2.9%
- By 2050
- 70,708 · +2.9%
- By 2075
- 67,917 · -1.1%
- By 2100
- 56,563 · -17.6%
Race, ethnicity, and origin ACS 2023
- Neighborhood character
- Predominantly White (87%)
- Race & ethnicity
- White 87% Black 5% Two or more races 5% Asian 1%
- Common ancestry
- Lithuanian 6% Italian 3% Slovak 2%
- Foreign-born
- 1% · Canada
- Languages at home
- 98% English-only · Other Indo-European 1%
Political lean MEDSL · St. Francois
- 2024 margin
- Solid R (+51.4) · D 23.8% · R 75.2%
- 2008→2024 swing
- -46.8pp toward R · 2008: -4.6pp · 2024: -51.4pp
- All cycles
- 2024: R+51.4 2020: R+48.1 2016: R+45.4 2012: R+19.5 2008: R+4.6
Not yet ingested
- Civics
- —
Market trends
- HPI YoY
- ▼ -18.15%
- Current HPI
- 234.0946
- Rent YoY
- —
- Metro
- —
- State GDP YoY
- ▲ 1.84%
- F500 in state
- 20
Industry mix (Fortune 500 HQ in MO)
| Industry | F500 HQs | Revenue |
|---|---|---|
| Healthcare | 1 | $163B |
|
||
| Insurance | 1 | $21B |
|
||
| Industrial Technology | 1 | $17B |
|
||
| Retail | 1 | $16B |
|
||
| Industrial Distribution | 1 | $10B |
|
||
| Utilities | 1 | $9B |
|
||
Price history
+15.6% since first listed11 events — show timeline
- 2026-06-15 Listed $54,900 MARIS as Distributed by MLS Grid
- 2025-10-08 Sold (MLS) — MARIS as Distributed by MLS Grid
- 2025-09-30 Sold (Public Records) — Public Records
- 2025-08-26 Contingent — MARIS as Distributed by MLS Grid
- 2025-08-23 Listed $44,900 MARIS as Distributed by MLS Grid
- 2024-12-20 Sold (Public Records) — Public Records
- 2024-12-17 Sold (MLS) — MARIS as Distributed by MLS Grid
- 2024-11-16 Pending — MARIS as Distributed by MLS Grid
- 2024-10-11 Relisted — MARIS as Distributed by MLS Grid
- 2024-10-03 Pending — MARIS as Distributed by MLS Grid
- 2024-09-18 Listed $47,500 MARIS as Distributed by MLS Grid
Property tax history
+1.2%/yrLatest (2025): $149 · +15.4% YoY. Source: county tax records.
Cash-flow waterfall
monthlySold comps — $/sqft
last 12 mo · ≤1 miLoading sold comps…