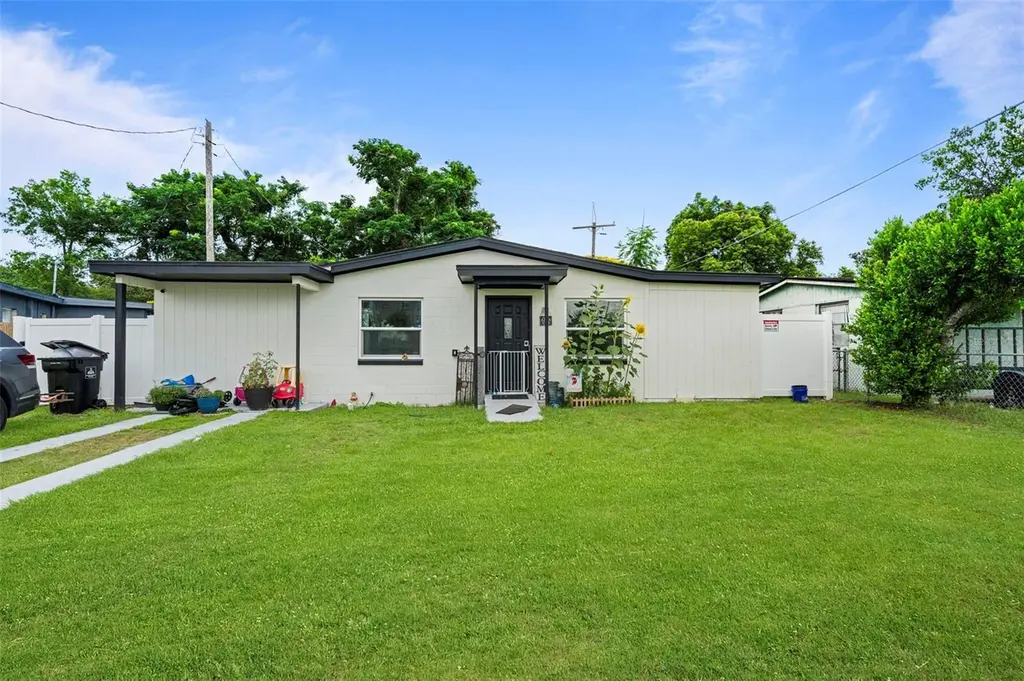
4333 Arch St · Orlando, FL
Flood risk 1/10 · Minimal
- FEMA flood zone
- X (unshaded)
- Chance of flooding over 30 yrs
- 0.0%
- Est. flood insurance / yr
- $507 – $1,088
Fire risk 1/10 · Minimal
- Est. fire insurance / yr
- $947 – $1,759
Heat risk 9/10 · Severe
- Hot days now (above 108°F)
- 7 days/yr
- Hot days in 30 yrs
- 22 days/yr
Wind risk 9/10 · Severe
- Chance of severe wind over 30 yrs
- 99.0%
Air-quality risk 2/10 · Minimal
- Unhealthy air days now
- 0 days/yr
- Unhealthy air days in 30 yrs
- 1 days/yr
Risk factors via First Street. Map © Google.
Why this score? — see what drove the D grade
The composite is a weighted blend of 9 inputs, each scored 0–100. Each bar is that input's sub-score; the figure is the points it added to the 100-point composite (weight × sub-score).
- Cash flow +13.2/30.0
- ARV discount +7.5/15.0
- Livability +4.3/5.0
- Schools +4.1/10.0
- DSCR +4.0/10.0
- 1% rule +3.3/10.0
- Condition / age +2.5/5.0
- Rent growth +2.4/5.0
- Appreciation +0.0/10.0
$239,000
🖨 Deal sheet 📄 Offer letter ✓ Due diligence
Listing remarks MLS
PERFECT FOR A FIRST TIME BUYER OR INVESTOR TO ADD TO THEIR PORTFOLIO! Welcome to this beautifully updated 4-bedroom, 2-bath home located in the heart of Orlando! This charming residence offers a perfect blend of modern amenities and classic appeal, making it an ideal choice for families or those seeking a spacious retreat. As you step inside, you are greeted by a bright and airy open floor plan that flows seamlessly from room to room. The updated kitchen boasts brand new stainless steel appliances, QUARTZ countertops, and ample cabinet space with white shaker cabinets, making it a chef's delight. Each of the four bedrooms is generously sized, offering plenty of space for relaxation and personalization. This home offers tile throughout and updated bathrooms with all new fixtures and vanitites! Step outside to discover a private backyard oasis with white vinyl fencing, perfect for outdoor gatherings or quiet evenings under the stars. Room for a pool and all your toys! This home is conveniently situated near shopping, dining, and entertainment options, as well as the highway. Don't miss the opportunity to make this stunning property your new home in Orlando!
Key facts
- New water heater
- Tile flooring
- Updated kitchen
Tags
Property features AI
Finance
- Other: Zoned R-1/W; Lot about 0.15 acre (approx. 0 to <1/4 acre)
- Financial info: Lease restrictions apply
- HOA & community: Pets allowed: cats and dogs
Exterior
- Parking: Driveway
- Utilities: Public water; Public sewer; Cable available; Electricity available
- Home design: Single-family residence; Residential property; One story; East-facing
- Construction: Block construction; Shingle roof; Block foundation; Completed condition
- Exterior features: Vinyl fencing; Other exterior features
Interior
- Kitchen: Cooktop; Dishwasher; Microwave; Refrigerator
- Bedrooms: 4 bedrooms
- Flooring: Tile
- Bathrooms: 2 full bathrooms
- Heating & cooling: Central heating; Central air conditioning
- Interior features: Open floorplan; Split bedroom layout; Seven total rooms
- Laundry & utility: Laundry closet
Neighborhood map
What this means for you Summary
Snapshot
- This is a 3-bed/1.0-bath single-family listed at $239k.
Deal economics
- At list price, monthly cash flow is $-4 ($-51/yr) — negative.
- To cash-flow at today's rent, offer at most $238k (0.3% below list).
- To meet the 1% rule (rent ≥ 1% of price), the offer needs to be $198k (17.1% below list).
- Recommended offer: $198k (17.1% below list) — sets the bar for 1% rule.
- Cap rate 6.3% vs local median 3.0% in Orlando — top-decile yield for the area; either an underpriced asset or a hidden risk that comps aren't pricing in. Stress-test before assuming the spread holds.
Location & tenants
- Location reads 86/100 on livability (#12 in FL, #360 nationally) — a professional / high-income tenant draw. Strengths: amenities A+, commute A+, housing A+.
- Orange (suburban): math 46% / reading 51% proficiency, ranked #43 of 73 in FL (top 59%) — families likely to look elsewhere, expect single-tenant / working-renter base with shorter leases.
- Zoned schools: Eagle Creek Elementary (math 74% / reading 70%, grade A-, #288 of 2,144 statewide, top 15%, 803 students, 27% FRL); East River High (math 27% / reading 47%, grade F, #340 of 667 statewide, top 52%, 2,050 students, 45% FRL) — zoned schools average 36% FRL vs 56% district-wide (20 pts lower); this property's tenant base skews higher-income than the district average.
- Market conditions: Rents soft (-0.3%/yr); 246 active listings in the ZIP; 4 comparable units currently listed for rent nearby; rentals leasing fast (median 8d on market — plan ~1-2 weeks tenant-placement turnaround); 8,053 units permitted in Orange County in 2024 (3,133 in 5+ unit buildings).
- At $1,980/mo this rent would consume 48% of the median local household income ($50k/yr) (locally 4039% of renters already pay >50% of income on rent) — very limited rent-growth headroom before tenants either downsize or default.
Forward outlook
- Local home prices are declining (-3.0%/yr); year-one equity from $2k of loan paydown is wiped out by about $7k of value loss. Plan a longer hold.
- Orange County population projected at +52% by 2050 — long-run rental-demand tailwind backs the buy-and-hold thesis.
Negotiation context
- It's been on market 17 days — a 2% lower offer ($235k) is reasonable based on typical stale-listing flexibility.
- 11 sale attempts since 15y ago with the ask held roughly flat each time — persistent listings suggest the price (not the market) is what's stuck; bring a comps-based counter.
Risks & watch-outs
- Watch-outs: built in 1958 — expect roof / HVAC / electrical / plumbing capex.
- Climate carrying-cost: severe wind risk, 99% chance of damaging wind over 30y; extreme-heat days projected 7→22/yr by 2055 (HVAC capex compounding) — expect insurance premiums to compound above CPI over the hold.
Questions for the listing agent
- What do current leases actually rent for vs. the listed asking? Can we see a recent rent roll and the last 12 months of T-12 income?
- Built in 1958 — when were the roof, HVAC, electrical panel, plumbing, and water heater last replaced?
- Is there a deadline driving the sale (1031 exchange, divorce, estate, relocation)? That informs how much negotiation room exists.
- Schools are B-rated — typically a magnet for longer-tenancy family renters. What's the average tenant stay here, and is there a school-zone premium baked into asking?
- The area grade is low — what's the realistic commute time and amenity access for the typical tenant pool here? Any planned neighborhood developments (good or bad) we should know about?
- What's the average days-on-market for RENTAL listings here right now (not sales)? A rising rental-DOM trend means longer vacancies and softer asking-rent achievability than the comps imply.
- What's the recent tenant-quality profile in this submarket — average credit score on applications, eviction rate, late-payment / NSF rate, and stable-employment percentage? A property-management company in the area should have these aggregated.
- How much new for-sale + rental construction is in the pipeline within 1–3 miles? Heavy new supply typically softens prices + rents 12–24 months out; constrained supply supports both.
Investment metrics
- 1% rule
- 0.83% ✗
- Cap rate
- 6.27%
- Cash-on-cash
- -0.08%
- DSCR
- 1.00
- GRM
- 10.1
CMA / ARV
No comps found within radius.
Projected returns pro-forma
-3.0% appreciation · 0.0% rent growth · sell at horizon
- IRR
- -19.7%
- Equity multiple
- 0.33×
- Total profit
- $-44,823
- Equity at exit
- $35,636
- IRR
- -20.2%
- Equity multiple
- 0.08×
- Total profit
- $-61,892
- Equity at exit
- $20,664
Cash invested: $66,920 (down + closing). Projections, not guarantees.
Landlord ↔ Tenant lean methodology
- Overall (STATE)
- 87 Strongly Landlord-Friendly
- State Florida
- 87 Strongly Landlord-Friendly · R+3
- County
- — inherits STATE
- City
- — inherits STATE
ZIP-level market 32808
- Home prices YoY
- -22.6%
- Rents YoY
- -0.3%
- Active inventory
- 246
- Price-to-rent
- 10.1×
Monthly cashflow live
- Estimated rent
- $1,980 medium interval (Pro) →
- Mortgage (P&I)
- −$1,253
- Tax from tax record
- −$216 /mo · $2,589/yr
- Insurance
- −$100
- HOA
- −$0
- Vacancy / Maint / Mgmt
- −$416
- Net cashflow
- $-4
Break-even live
UW: 25.0% down · 7.5% · 30yr · 1.5% tax · 5.0% vac · 8.0% maint · 8.0% mgmt
Financing live
Cash to close
- Down payment
- $59,750
- Closing costs
- $7,170
- Reserves months
- —
- Total cash needed
- —
Loan-product check · same deal, 3 products live
Conventional
25% down · 7.5% · 30yr
- Down + closing
- —
- Monthly P&I
- —
- Monthly cashflow
- —
- DSCR
- —
- Eligible?
- —
Personal DTI + credit; lowest rate.
DSCR
20% down · 8.5% · 30yr
- Down + closing
- —
- Monthly P&I
- —
- Monthly cashflow
- —
- DSCR
- —
- Eligible?
- —
No personal income docs; deal must DSCR.
Hard money
10% down · 12.0% · 12mo
- Down + closing
- —
- Monthly P&I
- —
- Monthly cashflow
- —
- DSCR
- —
- Eligible?
- —
Short-term bridge; refi at stabilization.
Rent comps 4 comps
| Address | Beds | Baths | Sqft | Rent | $/sqft | DOM | Units | Dist |
|---|---|---|---|---|---|---|---|---|
| 3750 W D Judge Dr Orlando, FL | 1.0–2.0 | 1.0–2.0 | 805 | $1,612 | $2.00 | 7d | 1 | 0.54mi |
| 1100 N John Young Pkwy Orlando, FL | 1.0–3.0 | 1.0–2.0 | 977 | $2,569 | $2.63 | 1d | 12 | 1.07mi |
| 1020 barnett villas Dr Orlando, FL | 1.0–3.0 | 1.0–2.0 | 934 | $1,930 | $2.07 | 23d | 1 | 1.32mi |
| 4697 Rose Coral Dr Orlando, FL | 2.0 | 1.0 | 576 | $1,437 | $2.49 | 1d | 15 | 1.46mi |
Listing history 14 events
-
2026-06-18days on market $239,000 Active 17 DOM
-
2026-06-17remarks 681-char remark
-
2026-06-17days on market $239,000 Active 16 DOM
-
2026-06-16days on market $239,000 Active 15 DOM
-
2026-06-15days on market $239,000 Active 14 DOM
-
2026-06-13days on market $239,000 Active 12 DOM
-
2026-06-13days on market $239,000 Active 11 DOM
-
2026-06-09days on market $239,000 Active 8 DOM
-
2026-06-08days on market $239,000 Active 7 DOM
-
2026-06-07days on market $239,000 Active 6 DOM
-
2026-06-04days on market $239,000 Active 3 DOM
-
2026-06-03days on market $239,000 Active 2 DOM
-
2026-06-02remarks 675-char remark
-
2026-06-02$239,000 Active 1 DOM
ⓘ Source: listings_history table (triggers on properties + properties_extension) + one-shot
backfill from property_details.listing_events for pre-trigger history.
Tax reassessment forecast FL · Resets to sale price
- Current annual tax
- $2,589 · $216/mo
- Projected year-2 tax
- $2,589 · $216/mo
- Expected delta
- $0/yr ($0/mo · 0.0%)
ⓘ Screening estimate from a state-policy table — verify with the county assessor before closing.
Climate risk First Street
- Flood 1/10 Low FEMA zone X (unshaded) · 0% chance over 30 yrs
- Wildfire 1/10 Low
- Heat 9/10 Extreme 7 d/yr ≥108°F today · 22 d/yr by 30 yrs out
- Wind 9/10 Extreme 99% chance of damaging wind over 30 yrs
- Air quality 2/10 Low 0 unhealthy d/yr today · 1 by 30 yrs out
Nearby sold comps map
Loading sold comps map…
Walkable amenities ~0.75 mi
Loading nearby amenities…
Taxation est. · year 1
- Rental income
- $23,763
- − Mortgage interest
- −$13,388
- − Property taxes
- −$2,589
- − Insurance
- −$1,195
- − Repairs & maintenance
- −$1,901
- − Management
- −$1,901
- − Depreciation
- −$6,953
- Taxable loss
- −$4,163
- Est. tax savings @ 24.0%
- +$999
- After-tax cash flow
- $948/yr
For passive investors: Depreciation is non-cash, so a rental often shows a tax loss while cash-flowing — sheltering income. Rental losses are passive: they offset passive income freely, and up to $25,000/yr can offset ordinary (W-2) income if you actively participate and your MAGI is under $100k (phasing out to $0 by $150k); unused losses carry forward. On sale, claimed depreciation is recaptured at up to 25%, and gains may owe capital-gains tax (a 1031 exchange can defer both). Figures are a year-1 estimate at your 24.0% rate — not tax advice; consult a CPA.
Schools (NCES district)
- District
- Orange
- NCES district ID
- 1201440
- Math proficiency
- 46% ▼ -9.00%
- Reading proficiency
- 51% ▼ -2.00%
- Median HH income
- $49,350
- Composite
- 41.47/100
- National rank
- #3461
- State rank
- #43 of 73 in FL
Livability — Orlando
- Score
- 86/100
- State rank
- #12
- US rank
- #360
Category grades
Schools grade is shown separately in the Schools card above.
Census & demographics
- Census place
- Orlando, FL
- County
- Orange County · 1,471,359 people
- City population
- 964,969
- Metro
- Orlando-Kissimmee-Sanford, FL
- Population (ZIP)
- 60,203
- Household income
- $49,700
- Rent vs Own
- Severe rent burden
- 4039.0
Population outlook (Orange County) Hauer SSP2
- Today (2025)
- 1,618,226 people
- By 2030
- 1,787,404 · +10.5%
- By 2040
- 2,125,621 · +31.4%
- By 2050
- 2,454,016 · +51.6%
- By 2075
- 3,173,711 · +96.1%
- By 2100
- 3,607,781 · +122.9%
Race, ethnicity, and origin ACS 2023
- Neighborhood character
- Predominantly Black (71%)
- Race & ethnicity
- Black 71% Hispanic / Latino 13% White 10% Two or more races 7% Asian 1%
- Hispanic origin (detail)
- Mexican 2% Puerto Rican 5% Dominican 2%
- Common ancestry
- Hispanic 20% Lithuanian 1% Scandinavian 0%
- Foreign-born
- 25% · Canada, Vietnam, Jamaica
- Languages at home
- 69% English-only · French/Haitian/Cajun 18% Spanish 11% Other Indo-European 1%
Political lean MEDSL · Orange
- 2024 margin
- D (+13.6) · D 56.1% · R 42.5% · Other 1.3%
- 2008→2024 swing
- -5.0pp toward R · 2008: 18.6pp · 2024: 13.6pp
- All cycles
- 2024: D+13.6 2020: D+23.1 2016: D+24.6 2012: D+18.2 2008: D+18.6
Not yet ingested
- Civics
- —
Market trends
- HPI YoY
- ▼ -110.15%
- Current HPI
- 376.3801
- Rent YoY
- ▼ -0.27%
- Metro
- Orlando-Kissimmee-Sanford, FL
- State GDP YoY
- ▲ 3.28%
- F500 in state
- 36
Industry mix (Fortune 500 HQ in FL)
| Industry | F500 HQs | Revenue |
|---|---|---|
| Industrial Technology | 2 | $29B |
|
||
| Insurance | 2 | $17B |
|
||
| Retail | 1 | $60B |
|
||
| Technology Distribution | 1 | $58B |
|
||
| Homebuilding | 1 | $35B |
|
||
| Technology Manufacturing | 1 | $35B |
|
||
Price history
+856.0% since first listed40 events — show timeline
- 2026-06-01 Listed $239,000 Stellar MLS as Distributed by MLS Grid
- 2025-06-10 Sold (Public Records) $246,900 Public Records
- 2025-06-06 Sold (MLS) $246,900 Daytona MLS
- 2025-06-06 Sold (MLS) $246,900 Stellar MLS as Distributed by MLS Grid
- 2025-05-22 Pending — Stellar MLS as Distributed by MLS Grid
- 2025-05-22 Relisted — Stellar MLS as Distributed by MLS Grid
- 2025-05-20 Contingent — Daytona MLS
- 2025-05-20 Pending — Stellar MLS as Distributed by MLS Grid
- 2025-05-18 Price Changed $249,900 Stellar MLS as Distributed by MLS Grid
- 2025-05-16 Relisted — Stellar MLS as Distributed by MLS Grid
- 2025-05-06 Listed $249,900 Daytona MLS
- 2025-05-05 Listing Removed — Daytona MLS
- 2025-05-05 Listing Removed — Stellar MLS as Distributed by MLS Grid
- 2025-05-01 Price Changed $255,800 Daytona MLS
- 2025-05-01 Price Changed $255,800 Stellar MLS as Distributed by MLS Grid
- 2025-04-10 Price Changed $256,800 Daytona MLS
- 2025-04-10 Price Changed $256,800 Stellar MLS as Distributed by MLS Grid
- 2025-03-28 Price Changed $256,900 Daytona MLS
- 2025-03-28 Price Changed $256,900 Stellar MLS as Distributed by MLS Grid
- 2025-03-13 Listed $249,900 Daytona MLS
- 2025-03-13 Listed $249,900 Stellar MLS as Distributed by MLS Grid
- 2025-03-09 Listing Removed — Stellar MLS as Distributed by MLS Grid
- 2025-03-04 Relisted — Stellar MLS as Distributed by MLS Grid
- 2025-03-04 Price Changed $253,500 Stellar MLS as Distributed by MLS Grid
- 2025-02-28 Pending — Stellar MLS as Distributed by MLS Grid
- 2025-02-01 Listed $259,900 Stellar MLS as Distributed by MLS Grid
- 2025-01-31 Listing Removed — Stellar MLS as Distributed by MLS Grid
- 2025-01-23 Price Changed $259,900 Stellar MLS as Distributed by MLS Grid
- 2025-01-07 Price Changed $265,000 Stellar MLS as Distributed by MLS Grid
- 2024-12-02 Price Changed $270,000 Stellar MLS as Distributed by MLS Grid
- 2024-11-01 Listed $280,000 Stellar MLS as Distributed by MLS Grid
- 2024-08-23 Sold (Public Records) $159,900 Public Records
- 2024-08-06 Sold (Public Records) $155,000 Public Records
- 2024-08-02 Sold (MLS) $155,000 Stellar MLS as Distributed by MLS Grid
- 2024-07-10 Pending — Stellar MLS as Distributed by MLS Grid
- 2024-06-19 Listed $199,000 Stellar MLS as Distributed by MLS Grid
- 2012-01-12 Sold (MLS) $19,000 Stellar MLS as Distributed by MLS Grid
- 2011-12-01 Listed $19,900 Stellar MLS as Distributed by MLS Grid
- 2005-05-24 Sold (Public Records) $67,300 Public Records
- 1997-09-18 Sold (Public Records) $25,000 Public Records
Property tax history
+15.5%/yrLatest (2025): $2,589 · +72.9% YoY. Source: county tax records.
Cash-flow waterfall
monthlySold comps — $/sqft
last 12 mo · ≤1 miLoading sold comps…