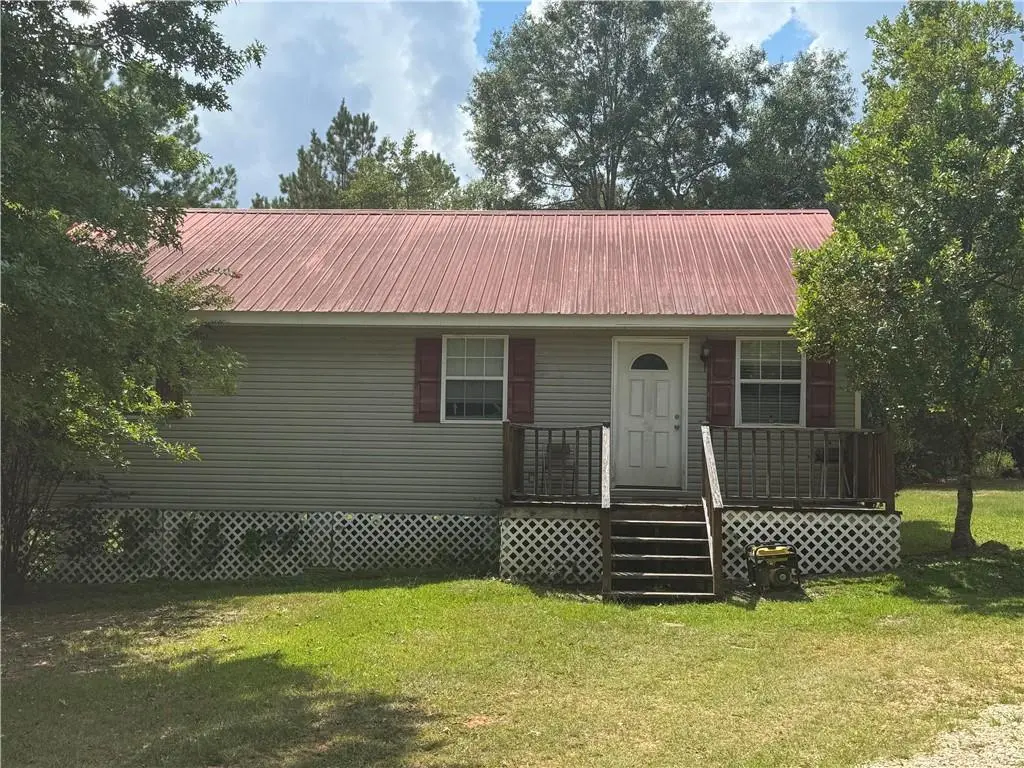
84074 Hill Rd · Folsom, LA
Flood risk 1/10 · Minimal
- FEMA flood zone
- X
- Chance of flooding over 30 yrs
- 0.0%
- Est. flood insurance / yr
- $507 – $1,088
Fire risk 5/10 · Moderate
- Est. fire insurance / yr
- $1,269 – $2,357
Heat risk 8/10 · Major
- Hot days now (above 108°F)
- 7 days/yr
- Hot days in 30 yrs
- 21 days/yr
Wind risk 9/10 · Severe
- Chance of severe wind over 30 yrs
- 99.0%
Air-quality risk 1/10 · Minimal
- Unhealthy air days now
- 0 days/yr
- Unhealthy air days in 30 yrs
- 0 days/yr
Risk factors via First Street. Map © Google.
Why this score? — see what drove the B- grade
The composite is a weighted blend of 9 inputs, each scored 0–100. Each bar is that input's sub-score; the figure is the points it added to the 100-point composite (weight × sub-score).
- Cash flow +24.7/30.0
- ARV discount +15.0/15.0
- DSCR +8.0/10.0
- 1% rule +5.7/10.0
- Schools +4.3/10.0
- Livability +3.6/5.0
- Rent growth +2.5/5.0
- Condition / age +2.5/5.0
- Appreciation +0.0/10.0
$176,500
🖨 Deal sheet (PDF) 📄 Offer letter ✓ Due diligence
Listing remarks MLS
MOTIVATED SELLERS! This three bedroom, two bath home sits in a quiet area on one acre just outside the center of the Village of Folsom!
Key facts
- 1 acre lot
- Parking
- Built 2003
Neighborhood map
What this means for you Summary
Snapshot
- This is a 3-bed/2.0-bath single-family listed at $176k.
Deal economics
- At list price, monthly cash flow is $371 ($4k/yr) — positive.
- The deal already cash-flows at list — no discount required.
- Meets the 1% rule at list price ($2k rent vs $176k).
- Recommended offer: $155k (12.0% below list) — sets the bar for market timing.
- Cap rate 8.8% vs local median 2.8% in Folsom — top-decile yield for the area; either an underpriced asset or a hidden risk that comps aren't pricing in. Stress-test before assuming the spread holds.
Location & tenants
- Location reads 72/100 on livability (#40 in LA) — a middle-class / working-renter tenant base. Strengths: cost of living A+, housing A+, health & safety A+; Watch: amenities F, commute F.
- St. Tammany Parish (suburban): math 43% / reading 55% proficiency, ranked #11 of 98 in LA (top 11%) — families likely to look elsewhere, expect single-tenant / working-renter base with shorter leases.
- Zoned schools: Folsom Elementary School (math 57% / reading 67%, grade B, #50 of 646 statewide, top 9%, 447 students, 48% FRL); Folsom Junior High School (math 37% / reading 52%, grade D, #49 of 218 statewide, top 23%, 208 students, 50% FRL); Covington High School (math 32% / reading 44%, grade F, #90 of 265 statewide, top 34%, 1,660 students, 46% FRL).
- Market conditions: 97 active listings in the ZIP; 1,064 units permitted in St. Tammany Parish in 2024 (0 in 5+ unit buildings).
Forward outlook
- Local home prices are declining (-3.0%/yr); year-one equity from $1k of loan paydown is wiped out by about $5k of value loss. Plan a longer hold.
- St. Tammany County population projected at +27% by 2050 — long-run rental-demand tailwind backs the buy-and-hold thesis.
Negotiation context
- It's been on market 271 days — a 12% lower offer ($155k) is reasonable based on typical stale-listing flexibility.
- 3 sale attempts; this cycle's ask has dropped $10k (5%) from the opening price — seller is motivated, your offer sets the floor, not the list.
Risks & watch-outs
- Climate carrying-cost: severe wind risk, 99% chance of damaging wind over 30y; moderate wildfire risk; extreme-heat days projected 7→21/yr by 2055 (HVAC capex compounding) — expect insurance premiums to compound above CPI over the hold.
Questions for the listing agent
- It's been on market 271 days. Have you received any prior offers? Is the seller open to a 12% concession, seller financing, or rate buy-down credit?
- Why hasn't it sold? Are there any deal-killer items the seller is aware of (foundation, flood, title, zoning, code violations)?
- Is there a deadline driving the sale (1031 exchange, divorce, estate, relocation)? That informs how much negotiation room exists.
- Schools are B-rated — typically a magnet for longer-tenancy family renters. What's the average tenant stay here, and is there a school-zone premium baked into asking?
- What's the average days-on-market for RENTAL listings here right now (not sales)? A rising rental-DOM trend means longer vacancies and softer asking-rent achievability than the comps imply.
- What's the recent tenant-quality profile in this submarket — average credit score on applications, eviction rate, late-payment / NSF rate, and stable-employment percentage? A property-management company in the area should have these aggregated.
- How much new for-sale + rental construction is in the pipeline within 1–3 miles? Heavy new supply typically softens prices + rents 12–24 months out; constrained supply supports both.
Investment metrics
- 1% rule
- 1.07% ✓
- Cap rate
- 8.81%
- Cash-on-cash
- 9.00%
- DSCR
- 1.40
- GRM
- 7.8
CMA / ARV
- ARV (median comp)
- $341,820
- List price
- $176,500
- Delta
- -48.36%
- Verdict
- UNDERPRICED
- Comps
- 2 within 1.0 mi
Projected returns pro-forma
-3.0% appreciation · 3.0% rent growth · sell at horizon
- IRR
- -2.7%
- Equity multiple
- 0.90×
- Total profit
- $-5,027
- Equity at exit
- $26,317
- IRR
- 7.0%
- Equity multiple
- 1.52×
- Total profit
- $25,889
- Equity at exit
- $15,260
Cash invested: $49,420 (down + closing). Projections, not guarantees.
Landlord ↔ Tenant lean methodology
- Overall (STATE)
- 90 Strongly Landlord-Friendly
- State Louisiana
- 90 Strongly Landlord-Friendly · R+12
- County
- — inherits STATE
- City
- — inherits STATE
ZIP-level market 70437
- Active inventory
- 97
- Price-to-rent
- 7.8×
Monthly cashflow live
- Estimated rent
- $1,889 medium interval (Pro) →
- Mortgage (P&I)
- −$926
- Tax from tax record
- −$122 /mo · $1,467/yr
- Insurance
- −$74
- HOA
- −$0
- Vacancy / Maint / Mgmt
- −$397
- Net cashflow
- $371
Break-even live
Sensitivity live
| Price | -10% $471 | -5% $421 | +0% $371 | +5% $321 | +10% $271 |
|---|---|---|---|---|---|
| Rent | -10% $221 | -5% $296 | +0% $371 | +5% $445 | +10% $520 |
| Rate | -1.0pp $460 | -0.5pp $416 | base $371 | +0.5pp $325 | +1.0pp $278 |
UW: 25.0% down · 7.5% · 30yr · 1.5% tax · 5.0% vac · 8.0% maint · 8.0% mgmt
Financing live
Cash to close
- Down payment
- $44,125
- Closing costs
- $5,295
- Reserves months
- —
- Total cash needed
- —
Loan-product check · same deal, 3 products live
Conventional
25% down · 7.5% · 30yr
- Down + closing
- —
- Monthly P&I
- —
- Monthly cashflow
- —
- DSCR
- —
- Eligible?
- —
Personal DTI + credit; lowest rate.
DSCR
20% down · 8.5% · 30yr
- Down + closing
- —
- Monthly P&I
- —
- Monthly cashflow
- —
- DSCR
- —
- Eligible?
- —
No personal income docs; deal must DSCR.
Hard money
10% down · 12.0% · 12mo
- Down + closing
- —
- Monthly P&I
- —
- Monthly cashflow
- —
- DSCR
- —
- Eligible?
- —
Short-term bridge; refi at stabilization.
Listing history 22 events
-
2026-06-21days on market $176,500 Active 271 DOM
-
2026-06-18days on market $176,500 Active 268 DOM
-
2026-06-17days on market $176,500 Active 267 DOM
-
2026-06-16days on market $176,500 Active 266 DOM
-
2026-06-15days on market $176,500 Active 265 DOM
-
2026-06-13days on market $176,500 Active 263 DOM
-
2026-06-10days on market $176,500 Active 260 DOM
-
2026-06-09days on market $176,500 Active 259 DOM
-
2026-06-08days on market $176,500 Active 258 DOM
-
2026-06-07days on market $176,500 Active 257 DOM
-
2026-06-03days on market $176,500 Active 253 DOM
-
2026-06-02days on market $176,500 Active 252 DOM
-
2026-06-01days on market $176,500 Active 251 DOM
-
2026-05-31days on market $176,500 Active 250 DOM
-
2026-05-05price $176,500 135-char remark
Show marketing remark (135 chars)
MOTIVATED SELLERS! This three bedroom, two bath home sits in a quiet area on one acre just outside the center of the Village of Folsom!
-
2026-05-05price $176,500 135-char remark
Show marketing remark (135 chars)
MOTIVATED SELLERS! This three bedroom, two bath home sits in a quiet area on one acre just outside the center of the Village of Folsom!
-
2026-01-13price $180,000 135-char remark
Show marketing remark (135 chars)
MOTIVATED SELLERS! This three bedroom, two bath home sits in a quiet area on one acre just outside the center of the Village of Folsom!
-
2026-01-13price $180,000 135-char remark
Show marketing remark (135 chars)
MOTIVATED SELLERS! This three bedroom, two bath home sits in a quiet area on one acre just outside the center of the Village of Folsom!
-
2025-09-23$186,000 Active 135-char remark
Show marketing remark (135 chars)
MOTIVATED SELLERS! This three bedroom, two bath home sits in a quiet area on one acre just outside the center of the Village of Folsom!
-
2025-09-23$186,000 Active 135-char remark
Show marketing remark (135 chars)
MOTIVATED SELLERS! This three bedroom, two bath home sits in a quiet area on one acre just outside the center of the Village of Folsom!
-
2025-09-23$186,000 Active
Show marketing remark (135 chars)
MOTIVATED SELLERS! This three bedroom, two bath home sits in a quiet area on one acre just outside the center of the Village of Folsom!
-
2003-06-11soldstatus
ⓘ Source: listings_history table (triggers on properties + properties_extension) + one-shot
backfill from property_details.listing_events for pre-trigger history.
Tax reassessment forecast LA · Resets to sale price
- Current annual tax
- $1,467 · $122/mo
- Projected year-2 tax
- $1,467 · $122/mo
- Expected delta
- $0/yr ($0/mo · 0.0%)
ⓘ Screening estimate from a state-policy table — verify with the county assessor before closing.
Climate risk First Street
- Flood 1/10 Low FEMA zone X · 0% chance over 30 yrs
- Wildfire 5/10 Major
- Heat 8/10 Severe 7 d/yr ≥108°F today · 21 d/yr by 30 yrs out
- Wind 9/10 Extreme 99% chance of damaging wind over 30 yrs
- Air quality 1/10 Low 0 unhealthy d/yr today · 0 by 30 yrs out
Nearby sold comps map
Loading sold comps map…
Walkable amenities ~0.75 mi
Loading nearby amenities…
Taxation est. · year 1
- Rental income
- $22,663
- − Mortgage interest
- −$9,887
- − Property taxes
- −$1,467
- − Insurance
- −$882
- − Repairs & maintenance
- −$1,813
- − Management
- −$1,813
- − Depreciation
- −$5,135
- Taxable income
- $1,666
- Est. tax owed @ 24.0%
- −$400
- After-tax cash flow
- $4,048/yr
For passive investors: Depreciation is non-cash, so a rental often shows a tax loss while cash-flowing — sheltering income. Rental losses are passive: they offset passive income freely, and up to $25,000/yr can offset ordinary (W-2) income if you actively participate and your MAGI is under $100k (phasing out to $0 by $150k); unused losses carry forward. On sale, claimed depreciation is recaptured at up to 25%, and gains may owe capital-gains tax (a 1031 exchange can defer both). Figures are a year-1 estimate at your 24.0% rate — not tax advice; consult a CPA.
Schools (NCES district)
- District
- St. Tammany Parish
- NCES district ID
- 2201650
- Math proficiency
- 43% ▼ -32.00%
- Reading proficiency
- 55% ▼ -26.00%
- Median HH income
- $61,752
- Composite
- 43.04/100
- National rank
- #3098
- State rank
- #11 of 98 in LA
Livability — Folsom
- Score
- 72/100
- State rank
- #40
- US rank
- #6135
Category grades
Schools grade is shown separately in the Schools card above.
Census & demographics
- Population (ZIP)
- 7,696
Population outlook (St. Tammany County) Hauer SSP2
- Today (2025)
- 286,725 people
- By 2030
- 304,175 · +6.1%
- By 2040
- 336,203 · +17.3%
- By 2050
- 364,590 · +27.2%
- By 2075
- 433,362 · +51.1%
- By 2100
- 470,333 · +64.0%
Race, ethnicity, and origin ACS 2023
- Neighborhood character
- Predominantly White (85%)
- Race & ethnicity
- White 85% Two or more races 7% Hispanic / Latino 7% Black 5%
- Hispanic origin (detail)
- Mexican 2%
- Common ancestry
- Lithuanian 15% Italian 1% Slovak 1%
- Foreign-born
- 1% · Canada
- Languages at home
- 98% English-only · Spanish 1%
Political lean MEDSL · St. Tammany
- 2024 margin
- Solid R (+43.8) · D 27.3% · R 71.1% · Other 1.6%
- 2008→2024 swing
- +9.6pp toward D · 2008: -53.4pp · 2024: -43.8pp
- All cycles
- 2024: R+43.8 2020: R+44.2 2016: R+50.8 2012: R+52.2 2008: R+53.4
Not yet ingested
- Civics
- —
Market trends
- HPI YoY
- ▼ -118.16%
- Current HPI
- 123.3397
- Rent YoY
- —
- Metro
- —
- State GDP YoY
- ▲ 3.29%
- F500 in state
- 10
Industry mix (Fortune 500 HQ in LA)
| Industry | F500 HQs | Revenue |
|---|---|---|
| Telecommunications | 2 | $23B |
|
||
| Utilities | 1 | $12B |
|
||
| Wholesale / Distribution | 1 | $5B |
|
||
| Advertising | 1 | $2B |
|
||
Price history
-5.1% since first listed8 events — show timeline
- 2026-05-05 Price Changed $176,500 AcadianaMLS
- 2026-05-05 Price Changed $176,500 GSREIN
- 2026-01-13 Price Changed $180,000 AcadianaMLS
- 2026-01-13 Price Changed $180,000 GSREIN
- 2025-09-23 Listed $186,000 AcadianaMLS
- 2025-09-23 Listed $186,000 GSREIN
- 2025-09-23 Listed $186,000 AcadianaMLS
- 2003-06-11 Sold (Public Records) — Public Records
Property tax history
+0.1%/yrLatest (2025): $1,467 · -3.4% YoY. Source: county tax records.
Cash-flow waterfall
monthlySold comps — $/sqft
last 12 mo · ≤1 miLoading sold comps…