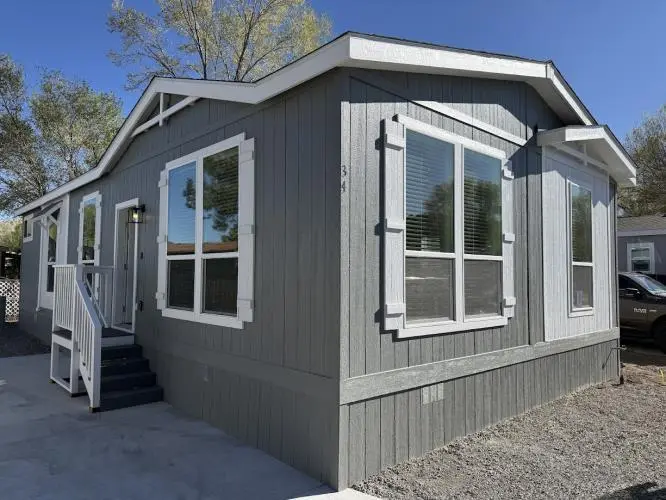
34 Tiger Dr · Carson City, NV
Flood risk 4/10 · Minor
- FEMA flood zone
- X (shaded)
- Chance of flooding over 30 yrs
- 0.22%
- Est. flood insurance / yr
- $507 – $1,088
Fire risk 6/10 · Moderate
- Est. fire insurance / yr
- $490 – $910
Heat risk 4/10 · Minor
- Hot days now (above 92°F)
- 7 days/yr
- Hot days in 30 yrs
- 18 days/yr
Wind risk 1/10 · Minimal
- Chance of severe wind over 30 yrs
- —
Air-quality risk 8/10 · Major
- Unhealthy air days now
- 17 days/yr
- Unhealthy air days in 30 yrs
- 18 days/yr
Risk factors via First Street. Map © Google.
Why this score? — see what drove the C- grade
The composite is a weighted blend of 9 inputs, each scored 0–100. Each bar is that input's sub-score; the figure is the points it added to the 100-point composite (weight × sub-score).
- Cash flow +19.9/30.0
- ARV discount +7.5/15.0
- DSCR +6.3/10.0
- 1% rule +5.3/10.0
- Condition / age +4.8/5.0
- Livability +3.6/5.0
- Schools +3.0/10.0
- Rent growth +2.5/5.0
- Appreciation +0.0/10.0
$174,910
🖨 Deal sheet 📄 Offer letter ✓ Due diligence
Listing remarks MLS
Brand New, modern, Energy Star certified home in a highly sought-after Family park. The Harmony series offers a spacious, modern living space designed for today’s homeowners. With 9’ flat ceilings and large 80” windows, this home provides an open, airy feel that is perfect for families or first-time buyers looking for a comfortable yet stylish living environment. Equipped with eBuilt Zero Energy Ready Homes™ technology and ecobee smart thermostats ensures energy efficiency, helping you save on utility bills while maintaining a cozy atmosphere. New air conditioner. Includes a 1-year limited factory warranty and a 1-year appliance warranty. Schedule your showing today! BUYER INCENTIVE: Use your tax refund toward the purchase of this home, and the park will match it up to $2500 Offer ends: 3/31/26 * Once the transaction closes, the lease is signed, and move-in funds are received, the park will process a refund of up to $2500 *
Key facts
- New air conditioner
- Built 2025
- Listed 134 days
Tags
Neighborhood map
What this means for you Summary
Snapshot
- This is a 3-bed/2.0-bath manufactured listed at $175k. Condition is rated excellent.
Deal economics
- At list price, monthly cash flow is $212 ($3k/yr) — positive.
- The deal already cash-flows at list — no discount required.
- Meets the 1% rule at list price ($2k rent vs $175k).
- Recommended offer: $154k (12.0% below list) — sets the bar for market timing.
- Cap rate 7.7% vs local median 2.4% in Carson City — top-decile yield for the area; either an underpriced asset or a hidden risk that comps aren't pricing in. Stress-test before assuming the spread holds.
Location & tenants
- Location reads 71/100 on livability (#25 in NV) — a middle-class / working-renter tenant base. Strengths: housing A+, health & safety B+; Watch: commute C-, schools D-, amenities F.
- Carson City School District (urban): math 27% / reading 41% proficiency, ranked #7 of 17 in NV (top 41%) — families likely to look elsewhere, expect single-tenant / working-renter base with shorter leases.
- Market conditions: 37 active listings in the ZIP; 12 comparable units currently listed for rent nearby; rentals lingering (median 44d on market — plan ~5-8 weeks vacancy on turnover, expect pricing pressure); 83% of comp listings sitting > 30 days — soft ceiling on asking rent; 264 units permitted in Carson City in 2024 (81 in 5+ unit buildings).
- This rent runs 34% of the median local income ($63k/yr) — at the standard rent-burdened threshold; future hikes will face affordability resistance.
Forward outlook
- Local home prices are declining (-3.0%/yr); year-one equity from $1k of loan paydown is wiped out by about $5k of value loss. Plan a longer hold.
- Carson City County population projected at -11% by 2050 — secular population decline; favor cash flow + early exit over multi-decade hold.
Negotiation context
- It's been on market 134 days — a 12% lower offer ($154k) is reasonable based on typical stale-listing flexibility.
Risks & watch-outs
- Climate carrying-cost: major wildfire risk — expect insurance premiums to compound above CPI over the hold.
Questions for the listing agent
- It's been on market 134 days. Have you received any prior offers? Is the seller open to a 12% concession, seller financing, or rate buy-down credit?
- Why hasn't it sold? Are there any deal-killer items the seller is aware of (foundation, flood, title, zoning, code violations)?
- Is there a deadline driving the sale (1031 exchange, divorce, estate, relocation)? That informs how much negotiation room exists.
- Schools are D-rated, which usually means shorter tenancies and higher turnover. Who's the typical renter profile here, and what's been the actual vacancy rate?
- What's the average days-on-market for RENTAL listings here right now (not sales)? A rising rental-DOM trend means longer vacancies and softer asking-rent achievability than the comps imply.
- What's the recent tenant-quality profile in this submarket — average credit score on applications, eviction rate, late-payment / NSF rate, and stable-employment percentage? A property-management company in the area should have these aggregated.
- How much new for-sale + rental construction is in the pipeline within 1–3 miles? Heavy new supply typically softens prices + rents 12–24 months out; constrained supply supports both.
Investment metrics
- 1% rule
- 1.03% ✓
- Cap rate
- 7.75%
- Cash-on-cash
- 5.20%
- DSCR
- 1.23
- GRM
- 8.1
CMA / ARV
- ARV (median comp)
- $350,033
- List price
- $174,910
- Delta
- -50.03%
- Verdict
- UNDERPRICED
- Comps
- 4 within 2.0 mi
Projected returns pro-forma
-3.0% appreciation · 3.0% rent growth · sell at horizon
- IRR
- -8.2%
- Equity multiple
- 0.70×
- Total profit
- $-14,805
- Equity at exit
- $26,080
- IRR
- 1.3%
- Equity multiple
- 1.09×
- Total profit
- $4,615
- Equity at exit
- $15,123
Cash invested: $48,975 (down + closing). Projections, not guarantees.
Landlord ↔ Tenant lean methodology
- Overall (STATE)
- 71 Landlord-Friendly
- State Nevada
- 71 Landlord-Friendly · R+1
- County
- — inherits STATE
- City
- — inherits STATE
ZIP-level market 89706
- Active inventory
- 37
- Price-to-rent
- 8.1×
Monthly cashflow live
- Estimated rent
- $1,799 high interval (Pro) →
- Mortgage (P&I)
- −$917
- Tax est. 1.5%
- −$219 /mo · $2,624/yr
- Insurance
- −$73
- HOA
- −$0
- Vacancy / Maint / Mgmt
- −$378
- Net cashflow
- $212
Break-even live
UW: 25.0% down · 7.5% · 30yr · 1.5% tax · 5.0% vac · 8.0% maint · 8.0% mgmt
Financing live
Cash to close
- Down payment
- $43,728
- Closing costs
- $5,247
- Reserves months
- —
- Total cash needed
- —
Loan-product check · same deal, 3 products live
Conventional
25% down · 7.5% · 30yr
- Down + closing
- —
- Monthly P&I
- —
- Monthly cashflow
- —
- DSCR
- —
- Eligible?
- —
Personal DTI + credit; lowest rate.
DSCR
20% down · 8.5% · 30yr
- Down + closing
- —
- Monthly P&I
- —
- Monthly cashflow
- —
- DSCR
- —
- Eligible?
- —
No personal income docs; deal must DSCR.
Hard money
10% down · 12.0% · 12mo
- Down + closing
- —
- Monthly P&I
- —
- Monthly cashflow
- —
- DSCR
- —
- Eligible?
- —
Short-term bridge; refi at stabilization.
Rent comps 12 comps
| Address | Beds | Baths | Sqft | Rent | $/sqft | DOM | Units | Dist |
|---|---|---|---|---|---|---|---|---|
| 504 Jeanell Dr Unit 17 Carson City, NV | 2.0 | 1.5 | 1100 | $1,700 | $1.55 | 43d | 1 | 0.34mi |
| 1901 N Peter's St Apt B Carson City, NV | 2.0 | 1.0 | 940 | $1,200 | $1.28 | 43d | 1 | 0.46mi |
| 404 Lee St Apt 1 Carson City, NV | 2.0 | 1.0 | 710 | $1,500 | $2.11 | 43d | 1 | 0.56mi |
| 1101 Beverly Dr Carson City, NV | 1.0–2.0 | 1.0 | 700 | $1,263 | $1.80 | 43d | 1 | 0.70mi |
| 420 Corbett St Carson City, NV | 3.0 | 2.0 | 960 | $1,950 | $2.03 | 43d | 1 | 0.77mi |
| 1249 Correlli Ct Carson City, NV | 3.0 | 2.5 | 1439 | $2,383 | $1.66 | 43d | 1 | 0.92mi |
| 730 Silver Oak Dr Carson City, NV | 3.0 | 1.0–2.0 | 1013 | $2,750 | $2.71 | 21d | 1 | 0.92mi |
| 1825 E Long St Unit 7 Carson City, NV | 2.0 | 1.0 | 864 | $1,350 | $1.56 | 43d | 1 | 1.10mi |
| 1841 E Long St Unit 6 Carson City, NV | 2.0 | 1.0 | 864 | $1,350 | $1.56 | 43d | 1 | 1.12mi |
| 1820 Russell Way Carson City, NV | 1.0–2.0 | 1.0 | 715 | $1,042 | $1.46 | 23d | 1 | 1.18mi |
| 1800 Russell Way Carson City, NV | 1.0–2.0 | 1.0 | 740 | $1,467 | $1.98 | 43d | 1 | 1.21mi |
| 221 S Harbin Ave Unit 9 Carson City, NV | 2.0 | 1.0 | 720 | $1,325 | $1.84 | 43d | 1 | 1.47mi |
Listing history 19 events
-
2026-06-19days on market $174,910 Active 134 DOM
-
2026-06-18days on market $174,910 Active 133 DOM
-
2026-06-17price $174,910 Active 132 DOM
-
2026-06-17days on market $174,900 Active 132 DOM
-
2026-06-16days on market $174,900 Active 131 DOM
-
2026-06-15days on market $174,900 Active 130 DOM
-
2026-06-14days on market $174,900 Active 128 DOM
-
2026-06-13days on market $174,900 Active 127 DOM
-
2026-06-10days on market $174,900 Active 125 DOM
-
2026-06-09days on market $174,900 Active 124 DOM
-
2026-06-08days on market $174,900 Active 123 DOM
-
2026-06-07days on market $174,900 Active 122 DOM
-
2026-06-05days on market $174,900 Active 119 DOM
-
2026-06-03days on market $174,900 Active 118 DOM
-
2026-06-02days on market $174,900 Active 117 DOM
-
2026-06-01days on market $174,900 Active 116 DOM
-
2026-05-31days on market $174,900 Active 115 DOM
-
2026-05-30days on market $174,900 Active 114 DOM
-
2026-02-04$174,900 Active 963-char remark
Show marketing remark (963 chars)
Brand New, modern, Energy Star certified home in a highly sought-after Family park. The Harmony series offers a spacious, modern living space designed for today’s homeowners. With 9’ flat ceilings and large 80” windows, this home provides an open, airy feel that is perfect for families or first-time buyers looking for a comfortable yet stylish living environment. Equipped with eBuilt Zero Energy Ready Homes™ technology and ecobee smart thermostats ensures energy efficiency, helping you save on utility bills while maintaining a cozy atmosphere. New air conditioner. Includes a 1-year limited factory warranty and a 1-year appliance warranty. Schedule your showing today! BUYER INCENTIVE: Use your tax refund toward the purchase of this home, and the park will match it up to $2500 Offer ends: 3/31/26 * Once the transaction closes, the lease is signed, and move-in funds are received, the park will process a refund of up to $2500 *
ⓘ Source: listings_history table (triggers on properties + properties_extension) + one-shot
backfill from property_details.listing_events for pre-trigger history.
Climate risk First Street
- Flood 4/10 Moderate FEMA zone X (shaded) · 22% chance over 30 yrs
- Wildfire 6/10 Major
- Heat 4/10 Moderate 7 d/yr ≥92°F today · 18 d/yr by 30 yrs out
- Wind 1/10 Low
- Air quality 8/10 Severe 17 unhealthy d/yr today · 18 by 30 yrs out
Nearby sold comps map
Loading sold comps map…
Walkable amenities ~0.75 mi
Loading nearby amenities…
Taxation est. · year 1
- Rental income
- $21,583
- − Mortgage interest
- −$9,798
- − Property taxes
- −$2,624
- − Insurance
- −$875
- − Repairs & maintenance
- −$1,727
- − Management
- −$1,727
- − Depreciation
- −$5,088
- Taxable loss
- −$254
- Est. tax savings @ 24.0%
- +$61
- After-tax cash flow
- $2,607/yr
For passive investors: Depreciation is non-cash, so a rental often shows a tax loss while cash-flowing — sheltering income. Rental losses are passive: they offset passive income freely, and up to $25,000/yr can offset ordinary (W-2) income if you actively participate and your MAGI is under $100k (phasing out to $0 by $150k); unused losses carry forward. On sale, claimed depreciation is recaptured at up to 25%, and gains may owe capital-gains tax (a 1031 exchange can defer both). Figures are a year-1 estimate at your 24.0% rate — not tax advice; consult a CPA.
Condition & rehab AI · 5 photos
This modern, energy-efficient manufactured home in a sought-after location is move-in ready with no visible repairs needed.
Value-add opportunities
- Both Landscaping — Enhances curb appeal and adds value
- Both Smart home integration — Improves energy efficiency and comfort
Renovation cost estimate screening
Value-add ROI direction
- Both Landscaping — Enhances curb appeal and adds value ↑
- Both Smart home integration — Improves energy efficiency and comfort ↑
ⓘ Cost ranges are severity-bucket heuristics (US national rule-of-thumb). Get contractor quotes + a written scope before underwriting a rehab budget.
Schools (NCES district)
- District
- Carson City School District
- NCES district ID
- 3200390
- Math proficiency
- 27% ▼ -7.00%
- Reading proficiency
- 41% ▼ -2.00%
- Median HH income
- $50,437
- Composite
- 29.51/100
- National rank
- #6502
- State rank
- #7 of 17 in NV
Livability — Carson City
- Score
- 71/100
- State rank
- #25
- US rank
- #7307
Category grades
Schools grade is shown separately in the Schools card above.
Census & demographics
- Census place
- Carson City, NV
- County
- Carson City · 59,982 people
- City population
- 59,982
- Metro
- Carson City, NV
- Population (ZIP)
- 20,478
- Household income
- $62,815
- Rent vs Own
- Severe rent burden
- 585.0
Population outlook (Carson City County) Hauer SSP2
- Today (2025)
- 53,423 people
- By 2030
- 52,474 · -1.8%
- By 2040
- 50,098 · -6.2%
- By 2050
- 47,664 · -10.8%
- By 2075
- 43,925 · -17.8%
- By 2100
- 38,752 · -27.5%
Race, ethnicity, and origin ACS 2023
- Neighborhood character
- Majority White (58%)
- Race & ethnicity
- White 58% Hispanic / Latino 35% Two or more races 13% Asian 2%
- Hispanic origin (detail)
- Mexican 28%
- Common ancestry
- Lithuanian 2% Slovak 2% Romanian 2%
- Foreign-born
- 15% · Canada, Jamaica
- Languages at home
- 73% English-only · Spanish 25% Tagalog/Filipino 1% Other Indo-European 1%
Political lean MEDSL · Carson City
- 2024 margin
- R (+11.3) · D 43.0% · R 54.3% · Other 2.6%
- 2008→2024 swing
- -12.1pp toward R · 2008: 0.9pp · 2024: -11.3pp
- All cycles
- 2024: R+11.3 2020: R+11.4 2016: R+14.1 2012: R+9.0 2008: D+0.9
Not yet ingested
- Civics
- —
Market trends
- HPI YoY
- ▼ -197.60%
- Current HPI
- 346.25
- Rent YoY
- —
- Metro
- Carson City, NV
- State GDP YoY
- ▲ 3.08%
- F500 in state
- 6
Industry mix (Fortune 500 HQ in NV)
| Industry | F500 HQs | Revenue |
|---|---|---|
| Hotels / Casinos | 3 | $36B |
|
||
Price history
1 event — show timeline
- 2026-02-04 Listed $174,900 Fizber.com
Cash-flow waterfall
monthlySold comps — $/sqft
last 12 mo · ≤1 miLoading sold comps…