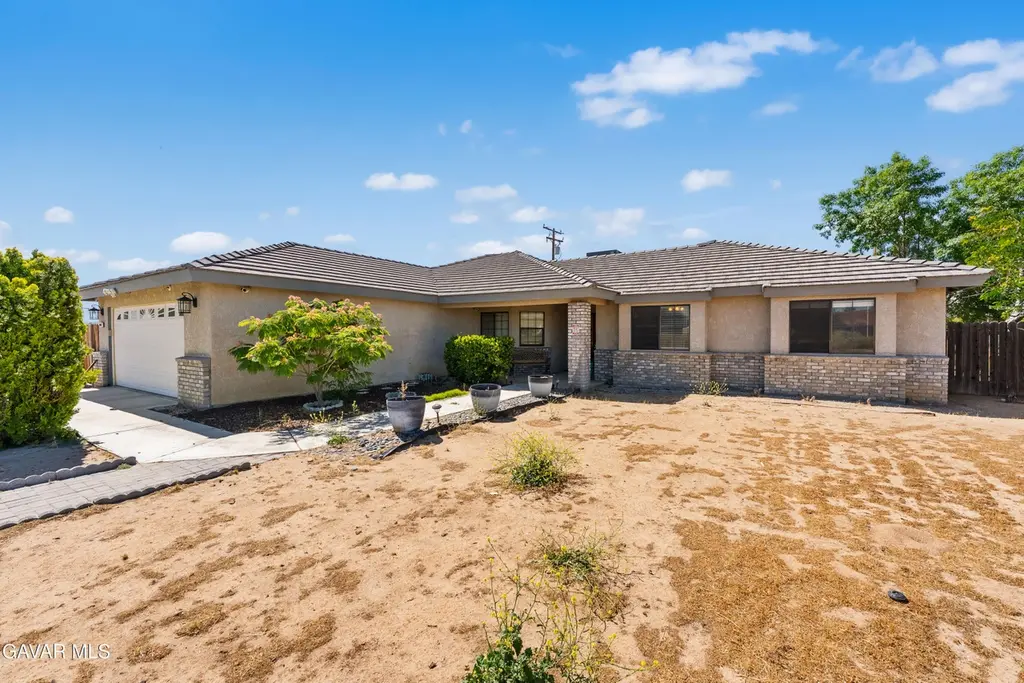
9948 Irene · California City, CA
Flood risk 1/10 · Minimal
- FEMA flood zone
- X (unshaded)
- Chance of flooding over 30 yrs
- 0.0%
- Est. flood insurance / yr
- $507 – $1,088
Fire risk 1/10 · Minimal
- Est. fire insurance / yr
- $659 – $1,223
Heat risk 8/10 · Major
- Hot days now (above 101°F)
- 6 days/yr
- Hot days in 30 yrs
- 16 days/yr
Wind risk 1/10 · Minimal
- Chance of severe wind over 30 yrs
- —
Air-quality risk 7/10 · Major
- Unhealthy air days now
- 13 days/yr
- Unhealthy air days in 30 yrs
- 17 days/yr
Risk factors via First Street. Map © Google.
Why this score? — see what drove the D+ grade
The composite is a weighted blend of 9 inputs, each scored 0–100. Each bar is that input's sub-score; the figure is the points it added to the 100-point composite (weight × sub-score).
- ARV discount +15.0/15.0
- Appreciation +10.0/10.0
- Cash flow +9.0/30.0
- Rent growth +3.9/5.0
- DSCR +2.5/10.0
- Condition / age +2.5/5.0
- 1% rule +2.3/10.0
- Livability +2.2/5.0
- Schools +2.1/10.0
$320,000
🖨 Deal sheet (PDF) 📄 Offer letter ✓ Due diligence
Listing remarks MLS
Located on the north side of California City, this custom-built 4-bedroom plus office, 2-bathroom home offers over 2,400 square feet of living space, making it one of the larger floor plans available in the area. With spacious rooms, flexible living areas, and recent updates, this home is designed for comfortable everyday living. The heart of the home is the expansive kitchen, featuring a center island, abundant cabinet storage, and plenty of counter space for meal preparation, entertaining, and all your kitchen essentials. Enjoy multiple dining options with space for a table in the kitchen, a formal dining room, and additional seating at the breakfast bar. The large living room is perfect for gathering with family and friends and features a cozy fireplace to enjoy on chilly desert evenings. With ample square footage, there's plenty of room for oversized furniture, including a large sectional or L-shaped couch. A versatile bonus room provides flexibility to fit your lifestyle and can be used as a home office, playroom, hobby room, or even a potential fifth bedroom. The primary suite is generously sized with room for large furniture and includes a private en-suite bathroom, creating a comfortable retreat. Outside, you'll find a gazebo and plenty of space for entertaining, relaxing, or creating your ideal backyard setup. The roof has been recently redone, providing added value and peace of mind for the next owner. Conveniently located on the desirable north side of California City, this spacious custom home offers the room, flexibility, and features you've been searching for.
Key facts
- Expansive kitchen
- Cozy fireplace
- Center island
Tags
Property features AI
Finance
- HOA & community: Urban community setting
Exterior
- Parking: Attached garage; 2 garage parking spaces (2 total parking spaces)
- Utilities: Septic tank; Public/District water; Natural gas connected; Electricity connected
- Home design: Single-family house; One story; Entry at front; No ADU
- Construction: Tile roof; No shared/common walls; Year built reported from assessor
- Exterior features: Covered slab patio; Wood fencing; No pool
Interior
- Kitchen: Dishwasher; Garbage disposal; Microwave; Gas range and gas oven; Eating area in the kitchen
- Bedrooms: Primary bedroom with attached primary suite (main level); Total of 4 bedrooms on the main level
- Flooring: Tile; Carpet; Laminate
- Bathrooms: 2 full bathrooms on the main level
- Heating & cooling: Central cooling
- Interior features: Front entry; Single-level home; Main level contains all bedrooms and bathrooms; Fireplace in the family room
- Laundry & utility: Dedicated laundry room
Neighborhood map
What this means for you Summary
Snapshot
- This is a 4-bed/2.0-bath single-family listed at $320k.
Deal economics
- At list price, monthly cash flow is $-254 ($-3k/yr) — negative.
- To cash-flow at today's rent, offer at most $275k (14.0% below list).
- To meet the 1% rule (rent ≥ 1% of price), the offer needs to be $234k (26.9% below list).
- Recommended offer: $234k (26.9% below list) — sets the bar for 1% rule.
Location & tenants
- Location reads 44/100 on livability (#1,329 in CA) — a working-class tenant base; expect higher turnover. Strengths: housing A+; Watch: crime F, amenities F, commute F.
- Mojave Unified (town): math 25% / reading 25% proficiency, ranked #411 of 517 in CA (top 80%) — low school quality limits family demand, transient renter base, plan for 1-2y turnover; 76% free/reduced lunch — lower-income household profile, screen leases tightly.
- Zoned schools: Hacienda Elementary (528 students, 92% FRL); California City Middle (501 students, 87% FRL); California City High (655 students, 85% FRL).
- Market conditions: Rents rising fast (+5.5%/yr); 704 active listings in the ZIP; 5 comparable units currently listed for rent nearby; rentals at typical pace (median 21d on market — plan ~3-4 weeks tenant-placement turnaround); 3,244 units permitted in Kern County in 2024 (73 in 5+ unit buildings).
- At $2,339/mo this rent would consume 47% of the median local household income ($60k/yr) (locally 883% of renters already pay >50% of income on rent) — very limited rent-growth headroom before tenants either downsize or default.
Forward outlook
- In year one you build about $34k of equity ($2k loan paydown + $32k appreciation (10.0% local appreciation)).
- Kern County population projected at +17% by 2050 — long-run rental-demand tailwind backs the buy-and-hold thesis.
- By year 2, paydown + projected appreciation supports a ~$55k cash-out refi (75% LTV) — recoverable capital for the next deal without selling this one.
Negotiation context
- Only 13 days on market — expect competitive offers; lowballing is unlikely to land.
- 2 sale attempts with the ask held roughly flat each time — persistent listings suggest the price (not the market) is what's stuck; bring a comps-based counter.
- Current owner paid $156k; list at $320k implies a 105% gain — meaningful room to come down on a strong offer.
Risks & watch-outs
- Climate carrying-cost: extreme-heat days projected 6→16/yr by 2055 (HVAC capex compounding) — expect insurance premiums to compound above CPI over the hold.
Questions for the listing agent
- What do current leases actually rent for vs. the listed asking? Can we see a recent rent roll and the last 12 months of T-12 income?
- Is there a deadline driving the sale (1031 exchange, divorce, estate, relocation)? That informs how much negotiation room exists.
- Schools are F-rated, which usually means shorter tenancies and higher turnover. Who's the typical renter profile here, and what's been the actual vacancy rate?
- Crime grade is F in this area — have there been break-ins, vandalism, or insurance claims at this property in the last 3 years? What carrier currently insures it and at what premium?
- The area grade is low — what's the realistic commute time and amenity access for the typical tenant pool here? Any planned neighborhood developments (good or bad) we should know about?
- What's the average days-on-market for RENTAL listings here right now (not sales)? A rising rental-DOM trend means longer vacancies and softer asking-rent achievability than the comps imply.
- What's the recent tenant-quality profile in this submarket — average credit score on applications, eviction rate, late-payment / NSF rate, and stable-employment percentage? A property-management company in the area should have these aggregated.
- How much new for-sale + rental construction is in the pipeline within 1–3 miles? Heavy new supply typically softens prices + rents 12–24 months out; constrained supply supports both.
Investment metrics
- 1% rule
- 0.73% ✗
- Cap rate
- 5.34%
- Cash-on-cash
- -3.40%
- DSCR
- 0.85
- GRM
- 11.4
CMA / ARV
- ARV (on-the-fly)
- $395,240
- Comps found
- 9
Show comp detail 9 sales within ~0.75 mi
| Address | Dist | Beds/Ba | Sqft | Sold | Price | $/sf | Match |
|---|---|---|---|---|---|---|---|
| 9941 Susan Ave | 0.10mi | 4/2.0 | 2,134 (-12%) | 7mo | $410,000 | $192 | 70 |
| 9848 Karen Ave | 0.16mi | 3/2.5 (-1) | 2,137 (-11%) | 2mo | $222,000 | $104 | 65 |
| 21840 Conklin Blvd | 0.27mi | 4/2.0 | 2,192 (-9%) | 12mo | $360,500 | $164 | 62 |
| 21641 Darrow Dr | 0.35mi | 4/2.0 | 2,220 (-8%) | 13mo | $409,000 | $184 | 60 |
| 9817 Susan Ave | 0.19mi | 4/3.0 | 2,103 (-13%) | 8mo | $330,000 | $157 | 59 |
| 10431 N Loop Blvd | 0.49mi | 4/2.5 | 2,575 (+7%) | 12mo | $233,333 | $91 | 54 |
| 9508 Rea Ave | 0.60mi | 4/3.0 | 2,760 (+14%) | 9mo | $400,000 | $145 | 36 |
| 10651 Keller Dr | 0.72mi | 4/2.5 | 2,137 (-11%) | 21mo | $400,000 | $187 | 28 |
| 21624 Ives Dr | 0.71mi | 5/2.5 (+1) | 2,129 (-12%) | 17mo | $400,000 | $188 | 26 |
Match score weights: distance 35% · size 25% · config 20% · recency 20%. Top-matched comps best support the ARV.
Projected returns pro-forma
10.0% appreciation · 5.45% rent growth · sell at horizon
- IRR
- 22.6%
- Equity multiple
- 2.83×
- Total profit
- $163,991
- Equity at exit
- $288,281
- IRR
- 20.7%
- Equity multiple
- 6.68×
- Total profit
- $508,807
- Equity at exit
- $621,690
Cash invested: $89,600 (down + closing). Projections, not guarantees.
Landlord ↔ Tenant lean methodology
- Overall (STATE)
- 18 Strongly Tenant-Friendly
- State California
- 18 Strongly Tenant-Friendly · D+13
- County
- — inherits STATE
- City
- — inherits STATE
ZIP-level market 93505
- Home prices YoY
- 13.0%
- Rents YoY
- 5.5%
- Active inventory
- 704
- Price-to-rent
- 11.4×
Monthly cashflow live
- Estimated rent
- $2,339 high interval (Pro) →
- Mortgage (P&I)
- −$1,678
- Tax from tax record
- −$290 /mo · $3,479/yr
- Insurance
- −$133
- HOA
- −$0
- Vacancy / Maint / Mgmt
- −$491
- Net cashflow
- $-254
Break-even live
Sensitivity live
| Price | -10% $-73 | -5% $-163 | +0% $-254 | +5% $-344 | +10% $-435 |
|---|---|---|---|---|---|
| Rent | -10% $-439 | -5% $-346 | +0% $-254 | +5% $-161 | +10% $-69 |
| Rate | -1.0pp $-93 | -0.5pp $-172 | base $-254 | +0.5pp $-337 | +1.0pp $-421 |
UW: 25.0% down · 7.5% · 30yr · 1.5% tax · 5.0% vac · 8.0% maint · 8.0% mgmt
Financing live
Cash to close
- Down payment
- $80,000
- Closing costs
- $9,600
- Reserves months
- —
- Total cash needed
- —
Loan-product check · same deal, 3 products live
Conventional
25% down · 7.5% · 30yr
- Down + closing
- —
- Monthly P&I
- —
- Monthly cashflow
- —
- DSCR
- —
- Eligible?
- —
Personal DTI + credit; lowest rate.
DSCR
20% down · 8.5% · 30yr
- Down + closing
- —
- Monthly P&I
- —
- Monthly cashflow
- —
- DSCR
- —
- Eligible?
- —
No personal income docs; deal must DSCR.
Hard money
10% down · 12.0% · 12mo
- Down + closing
- —
- Monthly P&I
- —
- Monthly cashflow
- —
- DSCR
- —
- Eligible?
- —
Short-term bridge; refi at stabilization.
Rent comps 5 comps
| Address | Beds | Baths | Sqft | Rent | $/sqft | DOM | Units | Dist |
|---|---|---|---|---|---|---|---|---|
| 21850 101st St California City, CA | 4.0 | 3.0 | 2698 | $2,150 | $0.80 | 21d | 1 | 0.31mi |
| 21235 Windsong St California City, CA | 3.0 | 3.0 | 1780 | $2,100 | $1.18 | 25d | 1 | 0.37mi |
| 10193 Evelyn Ave California City, CA | 3.0 | 2.0 | 1616 | $2,150 | $1.33 | 16d | 1 | 0.40mi |
| 9019 Evelyn Ave California City, CA | 4.0 | 2.0 | 1731 | $2,600 | $1.50 | 5d | 1 | 0.93mi |
| 21231 Corwin St California City, CA | 3.0 | 2.0 | 1632 | $2,500 | $1.53 | 25d | 1 | 1.08mi |
Listing history 10 events
-
2026-06-22days on market $320,000 Active 13 DOM
-
2026-06-18days on market $320,000 Active 10 DOM
-
2026-06-17days on market $320,000 Active 9 DOM
-
2026-06-16days on market $320,000 Active 8 DOM
-
2026-06-15days on market $320,000 Active 7 DOM
-
2026-06-14days on market $320,000 Active 5 DOM
-
2026-06-13days on market $320,000 Active 4 DOM
-
2026-06-10days on market $320,000 Active 2 DOM
-
2026-06-09remarks 699-char remark
-
2026-06-09$320,000 Active 1 DOM
ⓘ Source: listings_history table (triggers on properties + properties_extension) + one-shot
backfill from property_details.listing_events for pre-trigger history.
Tax reassessment forecast CA · Resets to sale price
- Current annual tax
- $3,479 · $290/mo
- Projected year-2 tax
- $3,479 · $290/mo
- Expected delta
- $0/yr ($0/mo · 0.0%)
ⓘ Screening estimate from a state-policy table — verify with the county assessor before closing.
Climate risk First Street
- Flood 1/10 Low FEMA zone X (unshaded) · 0% chance over 30 yrs
- Wildfire 1/10 Low
- Heat 8/10 Severe 6 d/yr ≥101°F today · 16 d/yr by 30 yrs out
- Wind 1/10 Low
- Air quality 7/10 Severe 13 unhealthy d/yr today · 17 by 30 yrs out
Nearby sold comps map
Loading sold comps map…
Walkable amenities ~0.75 mi
Loading nearby amenities…
Taxation est. · year 1
- Rental income
- $28,064
- − Mortgage interest
- −$17,925
- − Property taxes
- −$3,479
- − Insurance
- −$1,600
- − Repairs & maintenance
- −$2,245
- − Management
- −$2,245
- − Depreciation
- −$9,309
- Taxable loss
- −$8,739
- Est. tax savings @ 24.0%
- +$2,097
- After-tax cash flow
- $-948/yr
For passive investors: Depreciation is non-cash, so a rental often shows a tax loss while cash-flowing — sheltering income. Rental losses are passive: they offset passive income freely, and up to $25,000/yr can offset ordinary (W-2) income if you actively participate and your MAGI is under $100k (phasing out to $0 by $150k); unused losses carry forward. On sale, claimed depreciation is recaptured at up to 25%, and gains may owe capital-gains tax (a 1031 exchange can defer both). Figures are a year-1 estimate at your 24.0% rate — not tax advice; consult a CPA.
Schools (NCES district)
- District
- Mojave Unified
- NCES district ID
- 0625230
- Math proficiency
- 25% ▲ 11.00%
- Reading proficiency
- 25% ▼ -1.00%
- Median HH income
- $43,017
- Composite
- 21.4/100
- National rank
- #8350
- State rank
- #411 of 517 in CA
Livability — California City
- Score
- 44/100
- State rank
- #1329
- US rank
- #26753
Category grades
Schools grade is shown separately in the Schools card above.
Census & demographics
- Census place
- California City, CA
- County
- Kern County · 710,371 people
- City population
- 14,353
- Metro
- Bakersfield, CA
- Population (ZIP)
- 14,353
- Household income
- $59,827
- Rent vs Own
- Severe rent burden
- 883.0
Population outlook (Kern County) Hauer SSP2
- Today (2025)
- 947,286 people
- By 2030
- 978,984 · +3.3%
- By 2040
- 1,045,018 · +10.3%
- By 2050
- 1,105,232 · +16.7%
- By 2075
- 1,229,538 · +29.8%
- By 2100
- 1,238,059 · +30.7%
Race, ethnicity, and origin ACS 2023
- Neighborhood character
- Highly diverse neighborhood (Simpson 0.70)
- Race & ethnicity
- Hispanic / Latino 40% White 30% Black 22% Two or more races 16% Native American 3% Asian 1%
- Hispanic origin (detail)
- Mexican 29%
- Common ancestry
- Italian 3% Lithuanian 1% Romanian 1%
- Foreign-born
- 13% · Canada, Dominican Republic
- Languages at home
- 68% English-only · Spanish 29%
Political lean MEDSL · Kern
- 2024 margin
- Strong R (+21.1) · D 38.2% · R 59.3% · Other 2.5%
- 2008→2024 swing
- -3.3pp toward R · 2008: -17.8pp · 2024: -21.1pp
- All cycles
- 2024: R+21.1 2020: R+10.2 2016: R+15.0 2012: R+20.9 2008: R+17.8
Not yet ingested
- Civics
- —
Market trends
- HPI YoY
- ▲ 46.32%
- Current HPI
- 402.4192
- Rent YoY
- ▲ 5.45%
- Metro
- Bakersfield, CA
- State GDP YoY
- ▲ 3.21%
- F500 in state
- 116
Industry mix (Fortune 500 HQ in CA)
| Industry | F500 HQs | Revenue |
|---|---|---|
| Technology | 27 | $1,492B |
|
||
| Financial Services | 3 | $174B |
|
||
| Retail | 3 | $44B |
|
||
| Insurance | 3 | $26B |
|
||
| Media / Entertainment | 2 | $115B |
|
||
| Pharmaceuticals / Biotech | 2 | $62B |
|
||
Price history
+1291.3% since first listed4 events — show timeline
- 2026-06-08 Listed $320,000 CRMLS
- 2026-06-08 Listed $320,000 AVMLS
- 1991-04-22 Sold (Public Records) $156,000 Public Records
- 1989-07-06 Sold (Public Records) $23,000 Public Records
Property tax history
+6.9%/yrLatest (2025): $3,479 · -5.3% YoY. Source: county tax records.
Cash-flow waterfall
monthlySold comps — $/sqft
last 12 mo · ≤1 miLoading sold comps…