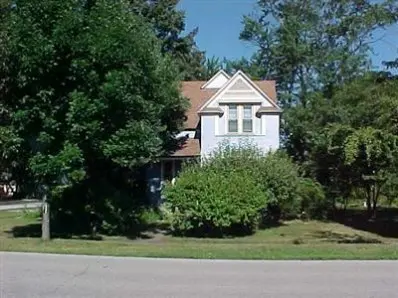
201 N Main St · Wanatah, IN
Flood risk 4/10 · Minor
- FEMA flood zone
- X (unshaded)
- Chance of flooding over 30 yrs
- 0.22%
- Est. flood insurance / yr
- $473 – $860
Fire risk 1/10 · Minimal
- Est. fire insurance / yr
- $717 – $1,331
Heat risk 2/10 · Minimal
- Hot days now (above 100°F)
- 7 days/yr
- Hot days in 30 yrs
- 16 days/yr
Wind risk 2/10 · Minimal
- Chance of severe wind over 30 yrs
- —
Air-quality risk 2/10 · Minimal
- Unhealthy air days now
- 1 days/yr
- Unhealthy air days in 30 yrs
- 2 days/yr
Risk factors via First Street. Map © Google.
Why this score? — see what drove the C+ grade
The composite is a weighted blend of 9 inputs, each scored 0–100. Each bar is that input's sub-score; the figure is the points it added to the 100-point composite (weight × sub-score).
- Cash flow +21.0/30.0
- ARV discount +15.0/15.0
- DSCR +6.7/10.0
- Schools +5.0/10.0
- 1% rule +4.5/10.0
- Livability +3.6/5.0
- Rent growth +2.5/5.0
- Condition / age +2.5/5.0
- Appreciation +0.0/10.0
$200,000
🖨 Deal sheet 📄 Offer letter ✓ Due diligence
Listing remarks MLS
LOTS OF VICTORIAN CHARM WITH POCKET DOORS, FRENCH DOORS, OPEN STAIRCASE, TRANSOMS AND WIDE YELLOW PINE BOARD FLOORS. THIRD FLOOR POTENTIAL. HOME COMES WITH AN ADDITIONAL LANDSCAPED LOT.
Key facts
- 0.4 acre lot
- Garage
- Built 1902
Property features AI
Finance
- Other: Property is currently vacant
Exterior
- Parking: Detached garage; Garage faces side; Off-street parking; 1 garage space
- Utilities: Public water; Public sewer; 100 Amp electric service; Natural gas connected; Electricity connected; Cable available
- Home design: Two-story house; Built in 1902; Entry includes a foyer
- Construction: Vinyl siding; Shingle roof; Crawl space basement (unfinished) with storage space and sump pump; Has basement
- Exterior features: Covered front porch; Enclosed porch; Deck; Neighborhood and park/greenbelt views; Other detached garage structure
Interior
- Kitchen: Gas range; Refrigerator
- Bedrooms: Primary bedroom; Bedroom 2; Bedroom 3; Office (can be used as bedroom/office); Bedrooms located on multiple levels
- Flooring: Hardwood; Carpet; Linoleum
- Bathrooms: 1 full bathroom
- Heating & cooling: Forced air heating (natural gas); Ceiling fans for cooling
- Interior features: Ceiling fans; High ceilings; Entrance foyer; Crown molding
- Laundry & utility: Washer hookup on main level; Gas dryer hookup; Gas water heater
Neighborhood map
What this means for you Summary
Snapshot
- This is a 3-bed/1.0-bath single-family listed at $200k.
Deal economics
- At list price, monthly cash flow is $283 ($3k/yr) — positive.
- The deal already cash-flows at list — no discount required.
- To meet the 1% rule (rent ≥ 1% of price), the offer needs to be $190k (5.0% below list).
- Recommended offer: $190k (5.0% below list) — sets the bar for 1% rule.
Location & tenants
- Location reads 72/100 on livability (#113 in IN) — a middle-class / working-renter tenant base. Strengths: crime A+, cost of living A+, housing A+; Watch: schools C-, employment C-, amenities F.
- Market conditions: 6 active listings in the ZIP; 1 comparable units currently listed for rent nearby; 216 units permitted in LaPorte County in 2024 (75 in 5+ unit buildings).
Forward outlook
- Local home prices are declining (-3.0%/yr); year-one equity from $1k of loan paydown is wiped out by about $6k of value loss. Plan a longer hold.
- LaPorte County population projected to shrink 7% by 2050 — rents likely to lag national; underwrite the cash flow, not the appreciation.
Negotiation context
- Only 4 days on market — expect competitive offers; lowballing is unlikely to land.
- 4 sale attempts since 26y ago with the ask held roughly flat each time — persistent listings suggest the price (not the market) is what's stuck; bring a comps-based counter.
- Current owner paid $119k; list at $200k implies a 68% gain — meaningful room to come down on a strong offer.
Risks & watch-outs
- Watch-outs: built in 1902 — expect roof / HVAC / electrical / plumbing capex.
Questions for the listing agent
- Built in 1902 — when were the roof, HVAC, electrical panel, plumbing, and water heater last replaced?
- Is there a deadline driving the sale (1031 exchange, divorce, estate, relocation)? That informs how much negotiation room exists.
- What's the average days-on-market for RENTAL listings here right now (not sales)? A rising rental-DOM trend means longer vacancies and softer asking-rent achievability than the comps imply.
- What's the recent tenant-quality profile in this submarket — average credit score on applications, eviction rate, late-payment / NSF rate, and stable-employment percentage? A property-management company in the area should have these aggregated.
- How much new for-sale + rental construction is in the pipeline within 1–3 miles? Heavy new supply typically softens prices + rents 12–24 months out; constrained supply supports both.
Investment metrics
- 1% rule
- 0.95% ✗
- Cap rate
- 7.99%
- Cash-on-cash
- 6.06%
- DSCR
- 1.27
- GRM
- 8.8
CMA / ARV
- ARV (on-the-fly)
- $281,248
- Comps found
- 9
Show comp detail 9 sales within ~0.75 mi
| Address | Dist | Beds/Ba | Sqft | Sold | Price | $/sf | Match |
|---|---|---|---|---|---|---|---|
| 106 N Illinois St #266 | 0.05mi | 3/2.5 | 1,467 (-2%) | 8mo | $280,000 | $191 | 82 |
| 405 N Illinois St | 0.19mi | 3/1.5 | 1,530 (+2%) | 24mo | $260,000 | $170 | 66 |
| 604 Condon Rd | 0.44mi | 3/2.0 | 1,500 (+0%) | 20mo | $299,900 | $200 | 58 |
| 111 W Carrie Ave | 0.41mi | 3/3.0 | 1,440 (-4%) | 13mo | $240,000 | $167 | 56 |
| 601 Post St | 0.36mi | 3/1.5 | 1,288 (-14%) | 4mo | $249,900 | $194 | 55 |
| 202 E Cross St | 0.09mi | 3/2.5 | 1,642 (+10%) | 24mo | $309,000 | $188 | 54 |
| 627 Fieldcrest Cir | 0.51mi | 3/2.5 | 1,600 (+7%) | 7mo | $287,000 | $179 | 53 |
| 601 Grassfork Ct | 0.44mi | 3/2.0 | 1,415 (-5%) | 19mo | $255,000 | $180 | 50 |
| 108 Lura St | 0.44mi | 3/2.0 | 1,393 (-7%) | 17mo | $295,000 | $212 | 49 |
Match score weights: distance 35% · size 25% · config 20% · recency 20%. Top-matched comps best support the ARV.
Projected returns pro-forma
-3.0% appreciation · 3.0% rent growth · sell at horizon
- IRR
- -7.0%
- Equity multiple
- 0.74×
- Total profit
- $-14,470
- Equity at exit
- $29,821
- IRR
- 2.6%
- Equity multiple
- 1.18×
- Total profit
- $10,298
- Equity at exit
- $17,292
Cash invested: $56,000 (down + closing). Projections, not guarantees.
Landlord ↔ Tenant lean methodology
- Overall (STATE)
- 90 Strongly Landlord-Friendly
- State Indiana
- 90 Strongly Landlord-Friendly · R+11
- County
- — inherits STATE
- City
- — inherits STATE
ZIP-level market 46390
- Home prices YoY
- -24.5%
- Active inventory
- 6
- Price-to-rent
- 8.8×
Monthly cashflow live
- Estimated rent
- $1,900 medium interval (Pro) →
- Mortgage (P&I)
- −$1,049
- Tax from tax record
- −$86 /mo · $1,033/yr
- Insurance
- −$83
- HOA
- −$0
- Vacancy / Maint / Mgmt
- −$399
- Net cashflow
- $283
Break-even live
UW: 25.0% down · 7.5% · 30yr · 1.5% tax · 5.0% vac · 8.0% maint · 8.0% mgmt
Financing live
Cash to close
- Down payment
- $50,000
- Closing costs
- $6,000
- Reserves months
- —
- Total cash needed
- —
Loan-product check · same deal, 3 products live
Conventional
25% down · 7.5% · 30yr
- Down + closing
- —
- Monthly P&I
- —
- Monthly cashflow
- —
- DSCR
- —
- Eligible?
- —
Personal DTI + credit; lowest rate.
DSCR
20% down · 8.5% · 30yr
- Down + closing
- —
- Monthly P&I
- —
- Monthly cashflow
- —
- DSCR
- —
- Eligible?
- —
No personal income docs; deal must DSCR.
Hard money
10% down · 12.0% · 12mo
- Down + closing
- —
- Monthly P&I
- —
- Monthly cashflow
- —
- DSCR
- —
- Eligible?
- —
Short-term bridge; refi at stabilization.
Rent comps 1 comps
| Address | Beds | Baths | Sqft | Rent | $/sqft | DOM | Units | Dist |
|---|---|---|---|---|---|---|---|---|
| 110 W Carrie Ave Wanatah, IN | 3.0 | 2.0 | 1550 | $1,900 | $1.23 | 1d | 1 | 0.36mi |
Listing history 7 events
-
2026-05-01status Pending
-
2026-04-27$200,000 Active
-
2007-04-02historical
-
2006-09-25$149,990
-
2005-11-07soldstatus $119,019
-
2005-04-18$119,900 185-char remark
Show marketing remark (185 chars)
LOTS OF VICTORIAN CHARM WITH POCKET DOORS, FRENCH DOORS, OPEN STAIRCASE, TRANSOMS AND WIDE YELLOW PINE BOARD FLOORS. THIRD FLOOR POTENTIAL. HOME COMES WITH AN ADDITIONAL LANDSCAPED LOT.
-
2000-10-03$93,900
ⓘ Source: listings_history table (triggers on properties + properties_extension) + one-shot
backfill from property_details.listing_events for pre-trigger history.
Tax reassessment forecast IN · Partial reset (capped growth)
- Current annual tax
- $1,033 · $86/mo
- Projected year-2 tax
- $1,366 · $114/mo
- Expected delta
- +$334/yr (+$28/mo · 32.3%)
ⓘ Screening estimate from a state-policy table — verify with the county assessor before closing.
Climate risk First Street
- Flood 4/10 Moderate FEMA zone X (unshaded) · 22% chance over 30 yrs
- Wildfire 1/10 Low
- Heat 2/10 Low 7 d/yr ≥100°F today · 16 d/yr by 30 yrs out
- Wind 2/10 Low
- Air quality 2/10 Low 1 unhealthy d/yr today · 2 by 30 yrs out
Nearby sold comps map
Loading sold comps map…
Walkable amenities ~0.75 mi
Loading nearby amenities…
Taxation est. · year 1
- Rental income
- $22,800
- − Mortgage interest
- −$11,203
- − Property taxes
- −$1,033
- − Insurance
- −$1,000
- − Repairs & maintenance
- −$1,824
- − Management
- −$1,824
- − Depreciation
- −$5,818
- Taxable income
- $98
- Est. tax owed @ 24.0%
- −$24
- After-tax cash flow
- $3,370/yr
For passive investors: Depreciation is non-cash, so a rental often shows a tax loss while cash-flowing — sheltering income. Rental losses are passive: they offset passive income freely, and up to $25,000/yr can offset ordinary (W-2) income if you actively participate and your MAGI is under $100k (phasing out to $0 by $150k); unused losses carry forward. On sale, claimed depreciation is recaptured at up to 25%, and gains may owe capital-gains tax (a 1031 exchange can defer both). Figures are a year-1 estimate at your 24.0% rate — not tax advice; consult a CPA.
Schools (NCES district)
No district data.
Livability — Wanatah
- Score
- 72/100
- State rank
- #113
- US rank
- #6153
Category grades
Schools grade is shown separately in the Schools card above.
Census & demographics
- Census place
- Wanatah, IN
- Population (ZIP)
- 2,965
Population outlook (LaPorte County) Hauer SSP2
- Today (2025)
- 109,757 people
- By 2030
- 108,288 · -1.3%
- By 2040
- 105,070 · -4.3%
- By 2050
- 102,330 · -6.8%
- By 2075
- 97,009 · -11.6%
- By 2100
- 86,459 · -21.2%
Race, ethnicity, and origin ACS 2023
- Neighborhood character
- Predominantly White (94%)
- Race & ethnicity
- White 94% Two or more races 3% Hispanic / Latino 2% Asian 2%
- Common ancestry
- Romanian 11% Iranian 2% Hungarian 1%
- Foreign-born
- 2%
- Languages at home
- 97% English-only · Other Asian/Pacific 1%
Political lean MEDSL · LaPorte
- 2024 margin
- R (+14.1) · D 42.1% · R 56.2% · Other 1.7%
- 2008→2024 swing
- -19.1pp toward R · 2008: 5.0pp · 2024: -14.1pp
- All cycles
- 2024: R+14.1 2020: R+7.2 2016: R+6.4 2012: D+12.6 2008: D+5.0
Not yet ingested
- Civics
- —
Market trends
- HPI YoY
- ▼ -68.92%
- Current HPI
- 212.6215
- Rent YoY
- —
- Metro
- —
- State GDP YoY
- ▲ 2.90%
- F500 in state
- 18
Industry mix (Fortune 500 HQ in IN)
| Industry | F500 HQs | Revenue |
|---|---|---|
| Industrial Machinery | 2 | $37B |
|
||
| Healthcare | 1 | $177B |
|
||
| Pharmaceuticals | 1 | $45B |
|
||
| Metals / Steel | 1 | $18B |
|
||
| Agriculture | 1 | $17B |
|
||
| Packaging | 1 | $12B |
|
||
Price history
+113.0% since first listed7 events — show timeline
- 2026-05-01 Pending — NIRA MLS as Distributed by MLS Grid
- 2026-04-27 Listed $200,000 NIRA MLS as Distributed by MLS Grid
- 2007-04-02 Listing Removed — NIRA MLS as Distributed by MLS Grid
- 2006-09-25 Listed $149,990 NIRA MLS as Distributed by MLS Grid
- 2005-11-07 Sold (Public Records) $119,019 Public Records
- 2005-04-18 Listed $119,900 NIRA MLS as Distributed by MLS Grid
- 2000-10-03 Listed $93,900 NIRA MLS as Distributed by MLS Grid
Property tax history
+14.2%/yrLatest (2024): $1,033 · +9.4% YoY. Source: county tax records.
Cash-flow waterfall
monthlySold comps — $/sqft
last 12 mo · ≤1 miLoading sold comps…