 🏷️ Likely Rental
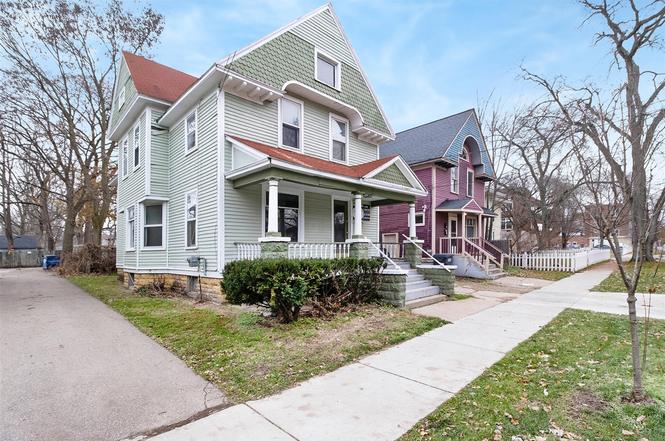
712 W Vine St · Kalamazoo, MI
Flood risk 3/10 · Minor
- FEMA flood zone
- X (unshaded)
- Chance of flooding over 30 yrs
- 0.2%
- Est. flood insurance / yr
- $507 – $1,088
Fire risk 1/10 · Minimal
- Est. fire insurance / yr
- $784 – $1,456
Heat risk 3/10 · Minor
- Hot days now (above 100°F)
- 7 days/yr
- Hot days in 30 yrs
- 16 days/yr
Wind risk 2/10 · Minimal
- Chance of severe wind over 30 yrs
- —
Air-quality risk 2/10 · Minimal
- Unhealthy air days now
- 1 days/yr
- Unhealthy air days in 30 yrs
- 2 days/yr
Risk factors via First Street. Map © Google.
Why this score? — see what drove the B+ grade
The composite is a weighted blend of 9 inputs, each scored 0–100. Each bar is that input's sub-score; the figure is the points it added to the 100-point composite (weight × sub-score).
- Cash flow +29.9/30.0
- ARV discount +15.0/15.0
- DSCR +10.0/10.0
- 1% rule +8.4/10.0
- Schools +4.7/10.0
- Livability +3.8/5.0
- Rent growth +3.1/5.0
- Condition / age +2.5/5.0
- Appreciation +0.0/10.0
$139,900
🖨 Deal sheet 📄 Offer letter ✓ Due diligence
Listing remarks MLS
Great historic 4 bedroom 1.5 bath house in the heart of the Vine Neighborhood. Home has some of its original woodwork still intact. Property shares the driveway with adjacent home 708 Vine. Tenant moving at end of April.
Key facts
- Vine neighborhood
- Historic
- Original woodwork
Tags
Property features AI
Exterior
- Utilities: Public water
- Home design: Traditional-style single-family home; Built in 1905
- Construction: Wood siding; Composition/shingle roof
- Exterior features: Public water
Interior
- Bathrooms: One full bathroom; One half bathroom
- Heating & cooling: Forced air heating
- Interior features: Eight total rooms; Full basement
Neighborhood map
What this means for you Summary
Snapshot
- This is a 3-bed/2.0-bath single-family listed at $140k.
Deal economics
- At list price, monthly cash flow is $519 ($6k/yr) — positive.
- The deal already cash-flows at list — no discount required.
- Meets the 1% rule at list price ($2k rent vs $140k).
- Recommended offer: $132k (6.0% below list) — sets the bar for market timing.
- Cap rate 10.7% vs local median 4.1% in Kalamazoo — top-decile yield for the area; either an underpriced asset or a hidden risk that comps aren't pricing in. Stress-test before assuming the spread holds.
Location & tenants
- Location reads 76/100 on livability (#141 in MI, #3,492 nationally) — a middle-class / working-renter tenant base. Strengths: commute A+, cost of living A+, housing A+; Watch: crime F, employment D-.
- Kalamazoo Public Schools (urban): math 43% / reading 72% proficiency, ranked #71 of 540 in MI (top 13%) — acceptable for families but not a draw, mixed tenant base, ~2y average lease; 66% free/reduced lunch — lower-income household profile, screen leases tightly.
- Market conditions: Rents rising (+2.4%/yr); 116 active listings in the ZIP; 10 comparable units currently listed for rent nearby; rentals at typical pace (median 21d on market — plan ~3-4 weeks tenant-placement turnaround); 339 units permitted in Kalamazoo County in 2024 (22 in 5+ unit buildings).
Forward outlook
- Local home prices are declining (-3.0%/yr); year-one equity from $967 of loan paydown is wiped out by about $4k of value loss. Plan a longer hold.
- Kalamazoo County population projected at +18% by 2050 — long-run rental-demand tailwind backs the buy-and-hold thesis.
- At projected returns (-3.0% appreciation + 2.4% rent growth), your $39k cash investment doubles in ~8 years — after that, you're playing with house money.
Negotiation context
- It's been on market 84 days — a 6% lower offer ($132k) is reasonable based on typical stale-listing flexibility.
- 12 sale attempts since 34y ago; this cycle's ask has dropped $10k (7%) from the opening price — seller is motivated, your offer sets the floor, not the list.
Risks & watch-outs
- Watch-outs: built in 1905 — expect roof / HVAC / electrical / plumbing capex.
Questions for the listing agent
- It's been on market 84 days. Have you received any prior offers? Is the seller open to a 6% concession, seller financing, or rate buy-down credit?
- Built in 1905 — when were the roof, HVAC, electrical panel, plumbing, and water heater last replaced?
- Why hasn't it sold? Are there any deal-killer items the seller is aware of (foundation, flood, title, zoning, code violations)?
- Is there a deadline driving the sale (1031 exchange, divorce, estate, relocation)? That informs how much negotiation room exists.
- Crime grade is F in this area — have there been break-ins, vandalism, or insurance claims at this property in the last 3 years? What carrier currently insures it and at what premium?
- What's the average days-on-market for RENTAL listings here right now (not sales)? A rising rental-DOM trend means longer vacancies and softer asking-rent achievability than the comps imply.
- What's the recent tenant-quality profile in this submarket — average credit score on applications, eviction rate, late-payment / NSF rate, and stable-employment percentage? A property-management company in the area should have these aggregated.
- How much new for-sale + rental construction is in the pipeline within 1–3 miles? Heavy new supply typically softens prices + rents 12–24 months out; constrained supply supports both.
Investment metrics
- 1% rule
- 1.34% ✓
- Cap rate
- 10.75%
- Cash-on-cash
- 15.90%
- DSCR
- 1.71
- GRM
- 6.2
CMA / ARV
- ARV (on-the-fly)
- $189,123
- Comps found
- 12
Show comp detail 12 sales within ~0.75 mi
| Address | Dist | Beds/Ba | Sqft | Sold | Price | $/sf | Match |
|---|---|---|---|---|---|---|---|
| 612 Oak St | 0.11mi | 4/2.0 (+1) | 1,540 (-2%) | 2mo | $145,000 | $94 | 86 |
| 1009 Oak St | 0.19mi | 4/2.0 (+1) | 1,526 (-2%) | 7mo | $141,000 | $92 | 76 |
| 517 Oak St | 0.18mi | 4/1.5 (+1) | 1,540 (-2%) | 8mo | $110,000 | $71 | 76 |
| 819 Oakland Dr | 0.30mi | 3/2.0 | 1,510 (-3%) | 7mo | $125,000 | $83 | 74 |
| 622 S Rose St | 0.41mi | 4/1.5 (+1) | 1,526 (-2%) | 8mo | $214,000 | $140 | 63 |
| 212 Rose Pl | 0.39mi | 4/2.0 (+1) | 1,496 (-4%) | 10mo | $199,900 | $134 | 61 |
| 726 Forest St | 0.37mi | 4/1.5 (+1) | 1,437 (-8%) | 2mo | $133,000 | $93 | 61 |
| 1411 Oak St | 0.47mi | 3/2.0 | 1,389 (-11%) | 6mo | $79,900 | $58 | 55 |
| 519 Walnut Ct | 0.41mi | 3/1.0 | 1,344 (-14%) | 1mo | $162,600 | $121 | 53 |
| 812 Wheaton Ave | 0.25mi | 3/1.0 | 1,334 (-15%) | 9mo | $167,500 | $126 | 52 |
| 1317 John St | 0.72mi | 4/2.0 (+1) | 1,428 (-9%) | 0mo | $187,000 | $131 | 47 |
| 1606 Merrill St | 0.59mi | 3/1.0 | 1,344 (-14%) | 3mo | $291,000 | $217 | 43 |
Match score weights: distance 35% · size 25% · config 20% · recency 20%. Top-matched comps best support the ARV.
Projected returns pro-forma
-3.0% appreciation · 2.41% rent growth · sell at horizon
- IRR
- 6.1%
- Equity multiple
- 1.24×
- Total profit
- $9,311
- Equity at exit
- $20,860
- IRR
- 15.0%
- Equity multiple
- 2.18×
- Total profit
- $46,297
- Equity at exit
- $12,096
Cash invested: $39,172 (down + closing). Projections, not guarantees.
Landlord ↔ Tenant lean methodology
- Overall (STATE)
- 62 Landlord-Friendly
- State Michigan
- 62 Landlord-Friendly · EVEN
- County
- — inherits STATE
- City
- — inherits STATE
ZIP-level market 49008
- Rents YoY
- 2.4%
- Active inventory
- 116
- Price-to-rent
- 6.2×
Monthly cashflow live
- Estimated rent
- $1,871 high interval (Pro) →
- Mortgage (P&I)
- −$734
- Tax from tax record
- −$167 /mo · $2,008/yr
- Insurance
- −$58
- HOA
- −$0
- Vacancy / Maint / Mgmt
- −$393
- Net cashflow
- $519
Break-even live
UW: 25.0% down · 7.5% · 30yr · 1.5% tax · 5.0% vac · 8.0% maint · 8.0% mgmt
Financing live
Cash to close
- Down payment
- $34,975
- Closing costs
- $4,197
- Reserves months
- —
- Total cash needed
- —
Loan-product check · same deal, 3 products live
Conventional
25% down · 7.5% · 30yr
- Down + closing
- —
- Monthly P&I
- —
- Monthly cashflow
- —
- DSCR
- —
- Eligible?
- —
Personal DTI + credit; lowest rate.
DSCR
20% down · 8.5% · 30yr
- Down + closing
- —
- Monthly P&I
- —
- Monthly cashflow
- —
- DSCR
- —
- Eligible?
- —
No personal income docs; deal must DSCR.
Hard money
10% down · 12.0% · 12mo
- Down + closing
- —
- Monthly P&I
- —
- Monthly cashflow
- —
- DSCR
- —
- Eligible?
- —
Short-term bridge; refi at stabilization.
Rent comps 10 comps
| Address | Beds | Baths | Sqft | Rent | $/sqft | DOM | Units | Dist |
|---|---|---|---|---|---|---|---|---|
| 807 Central Park Cir Kalamazoo, MI | 1.0–3.0 | 1.0–2.0 | 1089 | $2,345 | $2.15 | 13d | 12 | 0.12mi |
| 211 Rose Pl Kalamazoo, MI | 2.0 | 2.0 | 1695 | $1,200 | $0.71 | 21d | 1 | 0.40mi |
| 525 S Burdick St Kalamazoo, MI | 2.0 | 2.0 | 1555 | $2,928 | $1.88 | 13d | 2 | 0.57mi |
| 838 W Main St Kalamazoo, MI | 4.0 | 1.0 | 1470 | $1,300 | $0.88 | 21d | 1 | 0.57mi |
| 232 Woodward Ave Unit 5 Kalamazoo, MI | 2.0 | 1.0 | 1400 | $999 | $0.71 | 13d | 1 | 0.66mi |
| 125 S Kalamazoo Mall Kalamazoo, MI | 2.0 | 2.0 | 1833 | $3,088 | $1.68 | 13d | 1 | 0.71mi |
| 722 W Kalamazoo Ave Unit 2 Kalamazoo, MI | 3.0 | 1.0 | 1800 | $1,600 | $0.89 | 21d | 1 | 0.73mi |
| 310 E Michigan Ave Kalamazoo, MI | 2.0 | 2.0 | 1100 | $1,385 | $1.26 | 21d | 1 | 0.88mi |
| 708 Elizabeth St Kalamazoo, MI | 3.0 | 1.5 | 1128 | $1,250 | $1.11 | 13d | 1 | 1.23mi |
| 525 E Ransom St Kalamazoo, MI | 1.0–2.0 | 1.0–2.0 | 807 | $1,625 | $2.01 | 21d | 1 | 1.24mi |
Listing history 44 events
-
2026-06-18days on market $139,900 Active 84 DOM
-
2026-06-17days on market $139,900 Active 83 DOM
-
2026-06-16days on market $139,900 Active 82 DOM
-
2026-06-15remarks 256-char remark
-
2026-06-15price $139,900 Active 81 DOM
-
2026-06-15days on market $143,900 Active 81 DOM
-
2026-06-14days on market $143,900 Active 79 DOM
-
2026-06-13days on market $143,900 Active 78 DOM
-
2026-06-10days on market $143,900 Active 76 DOM
-
2026-06-09days on market $143,900 Active 75 DOM
-
2026-06-08days on market $143,900 Active 74 DOM
-
2026-06-07days on market $143,900 Active 73 DOM
-
2026-06-05remarks 246-char remark
-
2026-06-05pricedays on market $143,900 Active 70 DOM
-
2026-06-03days on market $144,900 Active 69 DOM
-
2026-06-02days on market $144,900 Active 68 DOM
-
2026-06-01days on market $144,900 Active 67 DOM
-
2026-05-31days on market $144,900 Active 66 DOM
-
2026-05-30pricedays on market $144,900 Active 65 DOM
-
2026-05-13price $145,900 220-char remark
Show marketing remark (220 chars)
Great historic 4 bedroom 1.5 bath house in the heart of the Vine Neighborhood. Home has some of its original woodwork still intact. Property shares the driveway with adjacent home 708 Vine. Tenant moving at end of April.
-
2026-05-12price $145,900 220-char remark
Show marketing remark (220 chars)
Great historic 4 bedroom 1.5 bath house in the heart of the Vine Neighborhood. Home has some of its original woodwork still intact. Property shares the driveway with adjacent home 708 Vine. Tenant moving at end of April.
-
2026-05-12price $145,900
Show marketing remark (220 chars)
Great historic 4 bedroom 1.5 bath house in the heart of the Vine Neighborhood. Home has some of its original woodwork still intact. Property shares the driveway with adjacent home 708 Vine. Tenant moving at end of April.
-
2026-04-21status Active 220-char remark
Show marketing remark (220 chars)
Great historic 4 bedroom 1.5 bath house in the heart of the Vine Neighborhood. Home has some of its original woodwork still intact. Property shares the driveway with adjacent home 708 Vine. Tenant moving at end of April.
-
2026-04-21status Active 220-char remark
Show marketing remark (220 chars)
Great historic 4 bedroom 1.5 bath house in the heart of the Vine Neighborhood. Home has some of its original woodwork still intact. Property shares the driveway with adjacent home 708 Vine. Tenant moving at end of April.
-
2026-04-21status Active
Show marketing remark (220 chars)
Great historic 4 bedroom 1.5 bath house in the heart of the Vine Neighborhood. Home has some of its original woodwork still intact. Property shares the driveway with adjacent home 708 Vine. Tenant moving at end of April.
-
2026-03-15status Pending 220-char remark
Show marketing remark (220 chars)
Great historic 4 bedroom 1.5 bath house in the heart of the Vine Neighborhood. Home has some of its original woodwork still intact. Property shares the driveway with adjacent home 708 Vine. Tenant moving at end of April.
-
2026-03-15status Pending 220-char remark
Show marketing remark (220 chars)
Great historic 4 bedroom 1.5 bath house in the heart of the Vine Neighborhood. Home has some of its original woodwork still intact. Property shares the driveway with adjacent home 708 Vine. Tenant moving at end of April.
-
2026-03-15status Pending
Show marketing remark (220 chars)
Great historic 4 bedroom 1.5 bath house in the heart of the Vine Neighborhood. Home has some of its original woodwork still intact. Property shares the driveway with adjacent home 708 Vine. Tenant moving at end of April.
-
2026-02-17$149,900 Active 220-char remark
Show marketing remark (220 chars)
Great historic 4 bedroom 1.5 bath house in the heart of the Vine Neighborhood. Home has some of its original woodwork still intact. Property shares the driveway with adjacent home 708 Vine. Tenant moving at end of April.
-
2026-02-17$149,900 Active 220-char remark
Show marketing remark (220 chars)
Great historic 4 bedroom 1.5 bath house in the heart of the Vine Neighborhood. Home has some of its original woodwork still intact. Property shares the driveway with adjacent home 708 Vine. Tenant moving at end of April.
-
2026-02-17$149,900 Active
Show marketing remark (220 chars)
Great historic 4 bedroom 1.5 bath house in the heart of the Vine Neighborhood. Home has some of its original woodwork still intact. Property shares the driveway with adjacent home 708 Vine. Tenant moving at end of April.
-
2014-09-15historical
-
2014-09-15historical
-
2014-04-04soldstatus $210,000
-
2009-04-24historical
-
2008-11-28$49,000
-
2008-11-28$49,000
-
2008-10-24historical
-
2008-04-24$57,000
-
2008-04-24$57,000
-
1992-10-26soldstatus $33,000
-
1992-10-26soldstatus $33,000
-
1992-08-20$32,900
-
1992-08-20$32,900
ⓘ Source: listings_history table (triggers on properties + properties_extension) + one-shot
backfill from property_details.listing_events for pre-trigger history.
Tax reassessment forecast MI · Partial reset (capped growth)
- Current annual tax
- $2,008 · $167/mo
- Projected year-2 tax
- $2,081 · $173/mo
- Expected delta
- +$73/yr (+$6/mo · 3.6%)
ⓘ Screening estimate from a state-policy table — verify with the county assessor before closing.
Climate risk First Street
- Flood 3/10 Moderate FEMA zone X (unshaded) · 20% chance over 30 yrs
- Wildfire 1/10 Low
- Heat 3/10 Moderate 7 d/yr ≥100°F today · 16 d/yr by 30 yrs out
- Wind 2/10 Low
- Air quality 2/10 Low 1 unhealthy d/yr today · 2 by 30 yrs out
Nearby sold comps map
Loading sold comps map…
Walkable amenities ~0.75 mi
Loading nearby amenities…
Taxation est. · year 1
- Rental income
- $22,456
- − Mortgage interest
- −$7,837
- − Property taxes
- −$2,008
- − Insurance
- −$700
- − Repairs & maintenance
- −$1,797
- − Management
- −$1,797
- − Depreciation
- −$4,070
- Taxable income
- $4,249
- Est. tax owed @ 24.0%
- −$1,020
- After-tax cash flow
- $5,209/yr
For passive investors: Depreciation is non-cash, so a rental often shows a tax loss while cash-flowing — sheltering income. Rental losses are passive: they offset passive income freely, and up to $25,000/yr can offset ordinary (W-2) income if you actively participate and your MAGI is under $100k (phasing out to $0 by $150k); unused losses carry forward. On sale, claimed depreciation is recaptured at up to 25%, and gains may owe capital-gains tax (a 1031 exchange can defer both). Figures are a year-1 estimate at your 24.0% rate — not tax advice; consult a CPA.
Schools (NCES district)
- District
- Kalamazoo Public Schools
- NCES district ID
- 2619950
- Math proficiency
- 43% ▲ 13.00%
- Reading proficiency
- 72% ▲ 33.00%
- Median HH income
- $35,291
- Composite
- 47.48/100
- National rank
- #2275
- State rank
- #71 of 540 in MI
Livability — Kalamazoo
- Score
- 76/100
- State rank
- #141
- US rank
- #3492
Category grades
Schools grade is shown separately in the Schools card above.
Census & demographics
- Census place
- Kalamazoo, MI
- County
- Kalamazoo County · 224,317 people
- City population
- 121,397
- Metro
- Kalamazoo-Portage, MI
- Population (ZIP)
- 16,137
- Household income
- $74,943
- Rent vs Own
- Severe rent burden
- 513.0
Population outlook (Kalamazoo County) Hauer SSP2
- Today (2025)
- 280,982 people
- By 2030
- 292,068 · +3.9%
- By 2040
- 312,191 · +11.1%
- By 2050
- 331,196 · +17.9%
- By 2075
- 379,021 · +34.9%
- By 2100
- 396,579 · +41.1%
Race, ethnicity, and origin ACS 2023
- Neighborhood character
- Predominantly White (75%)
- Race & ethnicity
- White 75% Black 12% Two or more races 6% Hispanic / Latino 5% Asian 3%
- Common ancestry
- Iranian 5% Slovak 3% Romanian 3%
- Foreign-born
- 8% · Canada, China, South Korea
- Languages at home
- 91% English-only · Spanish 2% Other Indo-European 2% French/Haitian/Cajun 1%
Political lean MEDSL · Kalamazoo
- 2024 margin
- D (+17.7) · D 58.0% · R 40.3% · Other 1.7%
- 2008→2024 swing
- -1.8pp toward R · 2008: 19.5pp · 2024: 17.7pp
- All cycles
- 2024: D+17.7 2020: D+18.7 2016: D+12.8 2012: D+13.3 2008: D+19.5
Not yet ingested
- Civics
- —
Market trends
- HPI YoY
- ▼ -170.52%
- Current HPI
- 230.6876
- Rent YoY
- ▲ 2.41%
- Metro
- Kalamazoo-Portage, MI
- State GDP YoY
- ▲ 1.37%
- F500 in state
- 28
Industry mix (Fortune 500 HQ in MI)
| Industry | F500 HQs | Revenue |
|---|---|---|
| Automotive Parts | 3 | $48B |
|
||
| Automotive | 2 | $372B |
|
||
| Chemicals | 1 | $45B |
|
||
| Automotive Retail | 1 | $29B |
|
||
| Healthcare / Medical Devices | 1 | $23B |
|
||
| Automotive Technology | 1 | $20B |
|
||
Price history
+343.5% since first listed25 events — show timeline
- 2026-05-13 Price Changed $145,900 MiRealSource-MiMLS
- 2026-05-12 Price Changed $145,900 REALCOMP
- 2026-05-12 Price Changed $145,900 SW Michigan MLS
- 2026-04-21 Relisted — MiRealSource-MiMLS
- 2026-04-21 Relisted — REALCOMP
- 2026-04-21 Relisted — SW Michigan MLS
- 2026-03-15 Pending — MiRealSource-MiMLS
- 2026-03-15 Pending — REALCOMP
- 2026-03-15 Pending — SW Michigan MLS
- 2026-02-17 Listed $149,900 REALCOMP
- 2026-02-17 Listed $149,900 SW Michigan MLS
- 2026-02-17 Listed $149,900 MiRealSource-MiMLS
- 2014-09-15 Listing Removed — SW Michigan MLS
- 2014-09-15 Listing Removed — SW Michigan MLS
- 2014-04-04 Sold (Public Records) $210,000 Public Records
- 2009-04-24 Listing Removed — REALCOMP
- 2008-11-28 Listed $49,000 REALCOMP
- 2008-11-28 Listed $49,000 SW Michigan MLS
- 2008-10-24 Listing Removed — REALCOMP
- 2008-04-24 Listed $57,000 REALCOMP
- 2008-04-24 Listed $57,000 SW Michigan MLS
- 1992-10-26 Sold (MLS) $33,000 REALCOMP
- 1992-10-26 Sold (MLS) $33,000 SW Michigan MLS
- 1992-08-20 Listed $32,900 REALCOMP
- 1992-08-20 Listed $32,900 SW Michigan MLS
Property tax history
+3.7%/yrLatest (2025): $2,008 · +3.0% YoY. Source: county tax records.
Cash-flow waterfall
monthlySold comps — $/sqft
last 12 mo · ≤1 miLoading sold comps…