 Duplex
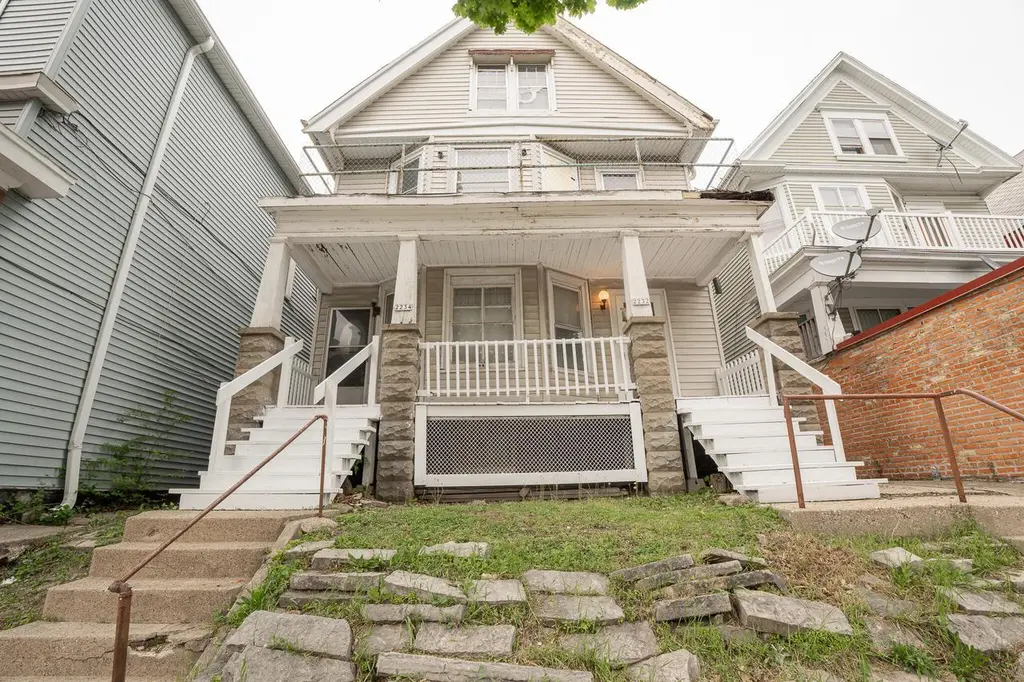
2232 W Mitchell St #2234 · Milwaukee, WI
Flood risk 1/10 · Minimal
- FEMA flood zone
- X (unshaded)
- Chance of flooding over 30 yrs
- 0.0%
- Est. flood insurance / yr
- $473 – $860
Fire risk 1/10 · Minimal
- Est. fire insurance / yr
- $636 – $1,182
Heat risk 2/10 · Minimal
- Hot days now (above 97°F)
- 7 days/yr
- Hot days in 30 yrs
- 13 days/yr
Wind risk 2/10 · Minimal
- Chance of severe wind over 30 yrs
- —
Air-quality risk 3/10 · Minor
- Unhealthy air days now
- 3 days/yr
- Unhealthy air days in 30 yrs
- 3 days/yr
Risk factors via First Street. Map © Google.
Why this score? — see what drove the A- grade
The composite is a weighted blend of 9 inputs, each scored 0–100. Each bar is that input's sub-score; the figure is the points it added to the 100-point composite (weight × sub-score).
- Cash flow +30.0/30.0
- ARV discount +15.0/15.0
- 1% rule +10.0/10.0
- DSCR +10.0/10.0
- Appreciation +10.0/10.0
- Livability +4.0/5.0
- Rent growth +3.0/5.0
- Condition / age +1.5/5.0
- Schools +1.2/10.0
$99,900
🖨 Deal sheet 📄 Offer letter ✓ Due diligence
Multi-family units
County records classify this as Multi-Family (2-4 Unit). Listing-text estimate: 2 units. confirmed
Listing remarks
Attention investors, rehabbers and landlords! Make this LARGE 3/2 duplex w/ 2-car garage your next value-add project! Each of the spacious units feature an eat-in kitchen, and formal dining room/living rooms. Large attic could be finished for additional living space. City has total sq. ft. at 2,600, and current assessed value of $161,000! Bona fide CASH OFFERS ONLY as this property will unlikely qualify for conventional financing. The property needs a roof and other work, but appears to have solid bones! Sold in as-is condition.
Key facts
- 3,920 sq ft lot
- 2 garage spots
- Built 1910
Property features AI
Finance
- Financial info: Property is a two-unit income property
Exterior
- Parking: Detached 2-car garage (total 2 garage parking spaces)
- Utilities: Municipal water; Municipal sewer; 2 electric meters; 2 gas meters
- Home design: 2-story duplex; Multi-family property; Estimated finished living area range: 1,251–1,500 per unit
- Construction: Built (year per assessor/public record); Block foundation
- Exterior features: Vinyl exterior; Lot is approximately 0.09 acres (less than 1/2 acre); Zoned LB2
Interior
- Kitchen: Unit 2 kitchen on upper level (approx. 12 x 12)
- Bedrooms: Unit 1: 2 bedrooms; Unit 2: 3 bedrooms (master and other bedrooms on upper level; dimensions: master 12 x 11, bedroom 2 11 x 10)
- Bathrooms: Unit 1: 1 full bathroom; Unit 2: 1 full bathroom
- Interior features: Full basement with block construction
- Laundry & utility: Separate electric and gas meters (2 electric meters, 2 gas meters)
Neighborhood map
What this means for you Summary
Snapshot
- This is a 2 × 2-bed/1.0-bath units multifamily listed at $100k. Condition is rated poor.
Deal economics
- At list price, monthly cash flow is $1k ($16k/yr) — positive. Per door: $669/mo.
- The deal already cash-flows at list — no discount required.
- Meets the 1% rule at list price ($3k rent vs $100k).
- Cap rate 22.4% vs local median 5.1% in Milwaukee — top-decile yield for the area; either an underpriced asset or a hidden risk that comps aren't pricing in. Stress-test before assuming the spread holds.
Location & tenants
- Location reads 81/100 on livability (#55 in WI, #1,534 nationally) — a professional / high-income tenant draw. Strengths: amenities A+, commute A+, cost of living A+; Watch: employment D+, schools F, crime F.
- Milwaukee School District (urban): math 10% / reading 18% proficiency, ranked #337 of 342 in WI (top 98%) — low school quality limits family demand, transient renter base, plan for 1-2y turnover; 77% free/reduced lunch — lower-income household profile, screen leases tightly.
- Market conditions: Rents rising (+2.0%/yr); 55 active listings in the ZIP; 1,017 units permitted in Milwaukee County in 2024 (803 in 5+ unit buildings).
- At $2,568/mo this rent would consume 67% of the median local household income ($46k/yr) (locally 2357% of renters already pay >50% of income on rent) — very limited rent-growth headroom before tenants either downsize or default.
Forward outlook
- In year one you build about $11k of equity ($691 loan paydown + $10k appreciation (10.0% local appreciation)).
- Milwaukee County population projected at +4% by 2050 — modest demand growth; plan on rents tracking national, not racing it.
- At projected returns (10.0% appreciation + 2.0% rent growth), your $28k cash investment doubles in ~2 years — after that, you're playing with house money.
- By year 4, paydown + projected appreciation supports a ~$38k cash-out refi (75% LTV) — recoverable capital for the next deal without selling this one.
Negotiation context
- Only 5 days on market — expect competitive offers; lowballing is unlikely to land.
Risks & watch-outs
- Watch-outs: built in 1910 — expect roof / HVAC / electrical / plumbing capex.
Questions for the listing agent
- Can we see the unit-by-unit rent roll, current vacancy, and any below-market leases? What's the average tenancy length?
- What capital expenditures (roof, boiler, parking lot, exteriors) have been made in the last 5 years, and what's planned in the next 2?
- Have any recent inspections been done? Can we get a copy of the seller's disclosures and any deferred-maintenance estimates?
- Built in 1910 — when were the roof, HVAC, electrical panel, plumbing, and water heater last replaced?
- Is there a deadline driving the sale (1031 exchange, divorce, estate, relocation)? That informs how much negotiation room exists.
- Schools are F-rated, which usually means shorter tenancies and higher turnover. Who's the typical renter profile here, and what's been the actual vacancy rate?
- Crime grade is F in this area — have there been break-ins, vandalism, or insurance claims at this property in the last 3 years? What carrier currently insures it and at what premium?
- What's the average days-on-market for RENTAL listings here right now (not sales)? A rising rental-DOM trend means longer vacancies and softer asking-rent achievability than the comps imply.
- What's the recent tenant-quality profile in this submarket — average credit score on applications, eviction rate, late-payment / NSF rate, and stable-employment percentage? A property-management company in the area should have these aggregated.
- How much new apartment / multifamily construction is in the pipeline within 1–3 miles? Heavy new supply (>2% of stock underway) typically softens rents 12–24 months out; light construction supports rent growth.
Investment metrics
- 1% rule
- 2.57% ✓
- Cap rate
- 22.37%
- Cash-on-cash
- 57.41%
- DSCR
- 3.55
- GRM
- 3.2
CMA / ARV
- ARV (on-the-fly)
- $176,800
- Comps found
- 9
Show comp detail 9 sales within ~0.75 mi
| Address | Dist | Beds/Ba | Sqft | Sold | Price | $/sf | Match |
|---|---|---|---|---|---|---|---|
| 2232 W Mitchell St #2234 | 0.00mi | 5/2.0 (+1) | 2,600 (0%) | 0mo | $160,000 | $62 | 95 |
| 2206 W Burnham St #2208 | 0.15mi | 4/2.0 | 2,430 (-6%) | 15mo | $151,500 | $62 | 69 |
| 2055 S 25th St #2057 | 0.41mi | 4/2.0 | 2,344 (-10%) | 2mo | $280,000 | $119 | 63 |
| 2121 S Muskego Ave #2123 | 0.45mi | 4/2.0 | 2,400 (-8%) | 22mo | $175,000 | $73 | 48 |
| 1633 S 30th St | 0.50mi | 5/2.0 (+1) | 2,303 (-11%) | 6mo | $126,467 | $55 | 48 |
| 742 S 25th St #744 | 0.74mi | 4/2.0 | 2,566 (-1%) | 21mo | $165,000 | $64 | 46 |
| 1117 S Layton Blvd #1119 | 0.58mi | 5/2.0 (+1) | 2,896 (+11%) | 6mo | $310,000 | $107 | 44 |
| 1131 S 19th St | 0.53mi | 4/2.0 | 2,255 (-13%) | 19mo | $195,000 | $86 | 38 |
| 2104 W Lincoln Ave | 0.65mi | 5/2.0 (+1) | 2,293 (-12%) | 15mo | $155,000 | $68 | 32 |
Match score weights: distance 35% · size 25% · config 20% · recency 20%. Top-matched comps best support the ARV.
Projected returns pro-forma
10.0% appreciation · 2.0% rent growth · sell at horizon
- IRR
- 69.2%
- Equity multiple
- 5.90×
- Total profit
- $137,128
- Equity at exit
- $89,998
- IRR
- 62.5%
- Equity multiple
- 12.86×
- Total profit
- $331,881
- Equity at exit
- $194,084
Cash invested: $27,972 (down + closing). Projections, not guarantees.
Landlord ↔ Tenant lean methodology
- Overall (STATE)
- 73 Landlord-Friendly
- State Wisconsin
- 73 Landlord-Friendly · R+2
- County
- — inherits STATE
- City
- — inherits STATE
ZIP-level market 53204
- Home prices YoY
- 19.0%
- Rents YoY
- 2.0%
- Active inventory
- 55
- Price-to-rent
- 6.5×
Monthly cashflow live
- Estimated rent
- $2,568 high interval (Pro) →
- Mortgage (P&I)
- −$524
- Tax est. 1.5%
- −$125 /mo · $1,498/yr
- Insurance
- −$42
- HOA
- −$0
- Vacancy / Maint / Mgmt
- −$539
- Net cashflow
- $1,338
Break-even live
2-unit breakdown (identical units grouped — click to expand)
| Units | Beds | Baths | Est. rent |
|---|---|---|---|
| 2× units | 2 | 1 | $2,568 |
| #1 | 2 | 1 | $1,284 |
| #2 | 2 | 1 | $1,284 |
| Total (2 units) | $2,568 | ||
UW: 25.0% down · 7.5% · 30yr · 1.5% tax · 5.0% vac · 8.0% maint · 8.0% mgmt
Financing live
Cash to close
- Down payment
- $24,975
- Closing costs
- $2,997
- Reserves months
- —
- Total cash needed
- —
Loan-product check · same deal, 3 products live
Conventional
25% down · 7.5% · 30yr
- Down + closing
- —
- Monthly P&I
- —
- Monthly cashflow
- —
- DSCR
- —
- Eligible?
- —
Personal DTI + credit; lowest rate.
DSCR
20% down · 8.5% · 30yr
- Down + closing
- —
- Monthly P&I
- —
- Monthly cashflow
- —
- DSCR
- —
- Eligible?
- —
No personal income docs; deal must DSCR.
Hard money
10% down · 12.0% · 12mo
- Down + closing
- —
- Monthly P&I
- —
- Monthly cashflow
- —
- DSCR
- —
- Eligible?
- —
Short-term bridge; refi at stabilization.
Listing history 3 events
-
2026-05-23historical Contingent
-
2026-05-21$99,900 Active
-
2026-05-19historical $99,900
ⓘ Source: listings_history table (triggers on properties + properties_extension) + one-shot
backfill from property_details.listing_events for pre-trigger history.
Climate risk First Street
- Flood 1/10 Low FEMA zone X (unshaded) · 0% chance over 30 yrs
- Wildfire 1/10 Low
- Heat 2/10 Low 7 d/yr ≥97°F today · 13 d/yr by 30 yrs out
- Wind 2/10 Low
- Air quality 3/10 Moderate 3 unhealthy d/yr today · 3 by 30 yrs out
Nearby sold comps map
Loading sold comps map…
Walkable amenities ~0.75 mi
Loading nearby amenities…
Taxation est. · year 1
- Rental income
- $30,816
- − Mortgage interest
- −$5,596
- − Property taxes
- −$1,498
- − Insurance
- −$500
- − Repairs & maintenance
- −$2,465
- − Management
- −$2,465
- − Depreciation
- −$2,906
- Taxable income
- $15,385
- Est. tax owed @ 24.0%
- −$3,692
- After-tax cash flow
- $12,368/yr
For passive investors: Depreciation is non-cash, so a rental often shows a tax loss while cash-flowing — sheltering income. Rental losses are passive: they offset passive income freely, and up to $25,000/yr can offset ordinary (W-2) income if you actively participate and your MAGI is under $100k (phasing out to $0 by $150k); unused losses carry forward. On sale, claimed depreciation is recaptured at up to 25%, and gains may owe capital-gains tax (a 1031 exchange can defer both). Figures are a year-1 estimate at your 24.0% rate — not tax advice; consult a CPA.
Condition & rehab AI · 5 photos
This property requires extensive repairs and updates to bring it up to a livable condition. Significant investments in the roof, exterior, and interior systems are necessary to increase its value.
Repairs flagged
- Major roof — No visible roof condition
- Major exterior siding — Worn siding
- Major steps — Damaged steps
- Major kitchen cabinets — Worn cabinets
- Major bathroom fixtures — Exposed pipes
- Major HVAC radiators — Exposed pipes
- Major landscaping — Overgrown lawn
Value-add opportunities
- Both New roof — Critical to the structural integrity and appearance
- Both New exterior siding — Improves curb appeal and durability
- Both New steps — Enhances safety and appearance
- Both New kitchen cabinets — Modernizes the space and increases functionality
- Both New bathroom fixtures — Enhances functionality and appearance
- Both New HVAC radiators — Improves comfort and energy efficiency
- Both Landscaping — Enhances curb appeal and property value
Renovation cost estimate screening
| Repair item | Severity | Est. cost |
|---|---|---|
| roof · No visible roof condition | Major | $15,000–50,000 |
| exterior siding · Worn siding | Major | $15,000–50,000 |
| steps · Damaged steps | Major | $15,000–50,000 |
| kitchen cabinets · Worn cabinets | Major | $15,000–50,000 |
| bathroom fixtures · Exposed pipes | Major | $15,000–50,000 |
| HVAC radiators · Exposed pipes | Major | $15,000–50,000 |
| landscaping · Overgrown lawn | Major | $15,000–50,000 |
| Total estimated repair cost · 7 items | $105,000–350,000 |
Value-add ROI direction
- Both New roof — Critical to the structural integrity and appearance ↑
- Both New exterior siding — Improves curb appeal and durability ↑
- Both New steps — Enhances safety and appearance ↑
- Both New kitchen cabinets — Modernizes the space and increases functionality ↑
- Both New bathroom fixtures — Enhances functionality and appearance ↑
- Both New HVAC radiators — Improves comfort and energy efficiency ↑
- Both Landscaping — Enhances curb appeal and property value ↑
ⓘ Cost ranges are severity-bucket heuristics (US national rule-of-thumb). Get contractor quotes + a written scope before underwriting a rehab budget.
Schools (NCES district)
- District
- Milwaukee School District
- NCES district ID
- 5509600
- Math proficiency
- 10% ▼ -5.00%
- Reading proficiency
- 18% ▬ 0.00%
- Median HH income
- $36,339
- Composite
- 11.61/100
- National rank
- #9696
- State rank
- #337 of 342 in WI
Livability — Milwaukee
- Score
- 81/100
- State rank
- #55
- US rank
- #1534
Category grades
Schools grade is shown separately in the Schools card above.
Census & demographics
- Census place
- Milwaukee, WI
- County
- Milwaukee County · 926,379 people
- City population
- 573,768
- Metro
- Milwaukee-Waukesha, WI
- Population (ZIP)
- 39,996
- Household income
- $45,934
- Rent vs Own
- Severe rent burden
- 2357.0
Population outlook (Milwaukee County) Hauer SSP2
- Today (2025)
- 995,758 people
- By 2030
- 1,009,124 · +1.3%
- By 2040
- 1,028,128 · +3.3%
- By 2050
- 1,040,066 · +4.4%
- By 2075
- 1,057,849 · +6.2%
- By 2100
- 1,039,774 · +4.4%
Race, ethnicity, and origin ACS 2023
- Neighborhood character
- Predominantly Hispanic (68%)
- Race & ethnicity
- Hispanic / Latino 68% Two or more races 35% White 15% Black 11% Asian 3% Native American 1%
- Hispanic origin (detail)
- Mexican 51% Puerto Rican 13%
- Common ancestry
- Romanian 3% Portuguese 1% Lithuanian 1%
- Foreign-born
- 28% · Canada
- Languages at home
- 35% English-only · Spanish 61% Other Asian/Pacific 1%
Political lean MEDSL · Milwaukee
- 2024 margin
- Solid D (+38.5) · D 68.3% · R 29.8% · Other 1.8%
- 2008→2024 swing
- +2.7pp toward D · 2008: 35.9pp · 2024: 38.5pp
- All cycles
- 2024: D+38.5 2020: D+39.9 2016: D+37.5 2012: D+34.6 2008: D+35.9
Not yet ingested
- Civics
- —
Market trends
- HPI YoY
- ▲ 64.27%
- Current HPI
- 403.236
- Rent YoY
- ▲ 2.00%
- Metro
- Milwaukee-Waukesha, WI
- State GDP YoY
- ▲ 2.10%
- F500 in state
- 20
Industry mix (Fortune 500 HQ in WI)
| Industry | F500 HQs | Revenue |
|---|---|---|
| Industrial Machinery | 4 | $23B |
|
||
| Industrial Technology | 2 | $36B |
|
||
| Insurance | 1 | $36B |
|
||
| Professional Services | 1 | $19B |
|
||
| Utilities | 1 | $9B |
|
||
| Consumer Goods | 1 | $3B |
|
||
Price history
+0.0% since first listed3 events — show timeline
- 2026-05-23 Contingent — METROMLS
- 2026-05-21 Listed $99,900 METROMLS
- 2026-05-19 Coming Soon $99,900 METROMLS
Cash-flow waterfall
monthlySold comps — $/sqft
last 12 mo · ≤1 miLoading sold comps…