 🏗️ New Construction
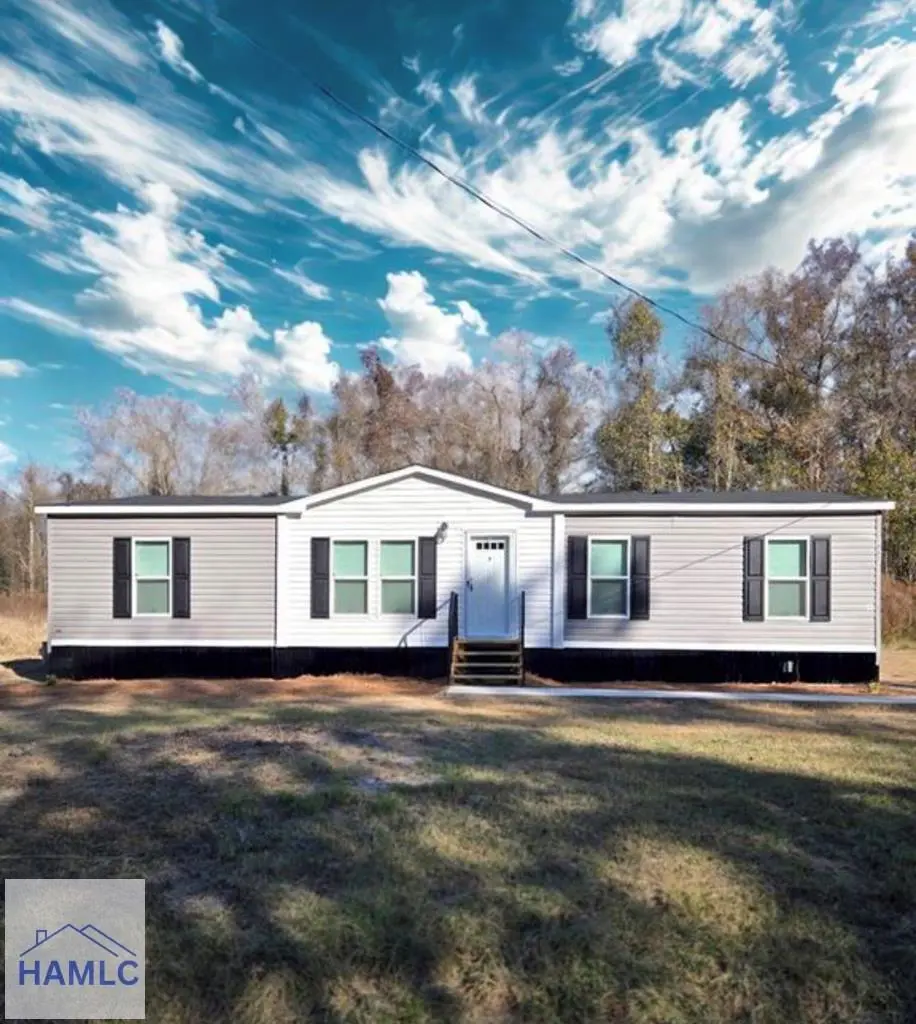
lot 1 Griffin Rd · Walthourville, GA
Flood risk No data
- FEMA flood zone
- —
- Chance of flooding over 30 yrs
- —
- Est. flood insurance / yr
- —
Fire risk No data
- Est. fire insurance / yr
- —
Heat risk No data
- Hot days now (above threshold)
- —
- Hot days in 30 yrs
- —
Wind risk No data
- Chance of severe wind over 30 yrs
- —
Air-quality risk No data
- Unhealthy air days now
- —
- Unhealthy air days in 30 yrs
- —
Risk factors via First Street. Map © Google.
Why this score? — see what drove the D grade
The composite is a weighted blend of 9 inputs, each scored 0–100. Each bar is that input's sub-score; the figure is the points it added to the 100-point composite (weight × sub-score).
- Cash flow +10.0/30.0
- ARV discount +7.5/15.0
- Appreciation +5.6/10.0
- Condition / age +4.0/5.0
- Livability +3.2/5.0
- 1% rule +3.0/10.0
- DSCR +2.8/10.0
- Rent growth +2.5/5.0
- Schools +2.3/10.0
$199,944
🖨 Deal sheet 📄 Offer letter ✓ Due diligence
Listing remarks
LOT 1 SIT ON ABOUT HALF AN ACRE!!! Don't miss out on this Charming NEW 4 bedroom / 2-bathroom home that HAS IT ALL!!! Open and inviting floor plan, elegant white cabinetry, upgraded lighting fixtures and recessed lighting. Complete modern home essentials with a comfortable layout. Double vanity in master bathroom with a tub/shower. Brand new appliances! Home has a 1-year manufacture warranty. VISIT the property today. Seller is a licensed Realtor in GA. Grass Seed has been planted. Homes qualify for FHA and VA loans with a permanent foundation. Home is not on lot yet will be by July 10 2026!
Key facts
- 0.34 acre lot
- Built 2026
- Listed 43 days
Property features AI
Finance
- Other: Listing broker: Seaside Realty Services
Exterior
- Parking: No designated parking
- Utilities: Public water; Septic tank sewer
- Home design: Single-family manufactured home; Under construction
- Construction: Vinyl siding; Manufactured house construction
- Exterior features: No exterior features specified; No fencing; Shingle roof; Lot fronts a highway; Other lot features; Approximately 0.34-acre lot
Interior
- Kitchen: Electric oven; Microwave; Refrigerator
- Bathrooms: 2 full bathrooms
- Interior features: Electric water heater; No fireplace; Crawl space basement; 6 total rooms
Neighborhood map
What this means for you Summary
Snapshot
- This is a 4-bed/2.0-bath single-family listed at $200k. Condition is rated good.
Deal economics
- At list price, monthly cash flow is $-168 ($-2k/yr) — negative.
- The deal already cash-flows at list — no discount required.
- Meets the 1% rule at list price ($2k rent vs $200k).
- Recommended offer: $194k (3.0% below list) — sets the bar for market timing.
Location & tenants
- Location reads 64/100 on livability (#255 in GA) — a middle-class / working-renter tenant base. Strengths: cost of living A+, housing A+, crime B; Watch: employment D, schools F, amenities F.
- Long County (rural): math 26% / reading 26% proficiency, ranked #115 of 174 in GA (top 66%) — low school quality limits family demand, transient renter base, plan for 1-2y turnover; 61% free/reduced lunch — lower-income household profile, screen leases tightly.
- Market conditions: 409 active listings in the ZIP; 1 comparable units currently listed for rent nearby; 298 units permitted in Long County in 2024 (0 in 5+ unit buildings).
- This rent runs 36% of the median local income ($75k/yr) — at the standard rent-burdened threshold; future hikes will face affordability resistance.
Forward outlook
- In year one you build about $5k of equity ($2k loan paydown + $3k appreciation (1.2% local appreciation)).
- Long County population projected at +72% by 2050 — long-run rental-demand tailwind backs the buy-and-hold thesis.
- By year 7, paydown + projected appreciation supports a ~$35k cash-out refi (75% LTV) — recoverable capital for the next deal without selling this one.
Negotiation context
- It's been on market 44 days — a 3% lower offer ($194k) is reasonable based on typical stale-listing flexibility.
- 2 sale attempts with the ask held roughly flat each time — persistent listings suggest the price (not the market) is what's stuck; bring a comps-based counter.
Questions for the listing agent
- What do current leases actually rent for vs. the listed asking? Can we see a recent rent roll and the last 12 months of T-12 income?
- It's been on market 44 days. Have you received any prior offers? Is the seller open to a 3% concession, seller financing, or rate buy-down credit?
- Is there a deadline driving the sale (1031 exchange, divorce, estate, relocation)? That informs how much negotiation room exists.
- Schools are F-rated, which usually means shorter tenancies and higher turnover. Who's the typical renter profile here, and what's been the actual vacancy rate?
- The area grade is low — what's the realistic commute time and amenity access for the typical tenant pool here? Any planned neighborhood developments (good or bad) we should know about?
- What's the average days-on-market for RENTAL listings here right now (not sales)? A rising rental-DOM trend means longer vacancies and softer asking-rent achievability than the comps imply.
- What's the recent tenant-quality profile in this submarket — average credit score on applications, eviction rate, late-payment / NSF rate, and stable-employment percentage? A property-management company in the area should have these aggregated.
- How much new for-sale + rental construction is in the pipeline within 1–3 miles? Heavy new supply typically softens prices + rents 12–24 months out; constrained supply supports both.
Investment metrics
- 1% rule
- 0.80% ✗
- Cap rate
- 5.57%
- Cash-on-cash
- -2.59%
- DSCR
- 0.88
- GRM
- 10.4
CMA / ARV
- ARV (median comp)
- $277,772
- List price
- $199,944
- Delta
- -28.02%
- Verdict
- UNDERPRICED
- Comps
- 20 within 1.0 mi
Show comp detail 12 sales within ~0.75 mi
| Address | Dist | Beds/Ba | Sqft | Sold | Price | $/sf | Match |
|---|---|---|---|---|---|---|---|
| 9955 Tibet Highway Hwy SE | 0.10mi | 4/2.0 | 1,565 (+3%) | 22mo | $266,475 | $170 | 73 |
| 9659 Tibet Highway Hwy SE | 0.10mi | 4/2.0 | 1,565 (+3%) | 22mo | $268,425 | $172 | 72 |
| 9997 Tibet Highway Hwy SE | 0.10mi | 4/2.0 | 1,620 (+6%) | 20mo | $275,975 | $170 | 68 |
| 9201 Tibet Hwy | 0.10mi | 3/2.0 (-1) | 1,477 (-3%) | 21mo | $275,000 | $186 | 68 |
| 9247 Tibet Highway Hwy SE | 0.10mi | 4/2.0 | 1,620 (+6%) | 23mo | $277,825 | $171 | 66 |
| 9851 Tibet Highway Hwy SE | 0.10mi | 4/2.0 | 1,653 (+8%) | 20mo | $285,000 | $172 | 65 |
| 10009 Tibet Highway Hwy SE | 0.10mi | 4/2.0 | 1,653 (+8%) | 21mo | $277,325 | $168 | 64 |
| 9955 Tibet Hwy SE | 0.38mi | 4/2.0 | 1,565 (+3%) | 22mo | $266,475 | $170 | 60 |
| 9997 Tibet Hwy SE | 0.34mi | 4/2.0 | 1,620 (+6%) | 20mo | $275,975 | $170 | 57 |
| 10009 Tibet Hwy SE | 0.32mi | 4/2.0 | 1,653 (+8%) | 21mo | $277,325 | $168 | 54 |
| 9851 Tibet Hwy SE | 0.49mi | 4/2.0 | 1,653 (+8%) | 20mo | $285,000 | $172 | 47 |
| 9659 Tibet Hwy SE | 0.68mi | 4/2.0 | 1,565 (+3%) | 22mo | $268,425 | $172 | 45 |
Match score weights: distance 35% · size 25% · config 20% · recency 20%. Top-matched comps best support the ARV.
Projected returns pro-forma
1.16% appreciation · 3.0% rent growth · sell at horizon
- IRR
- -0.8%
- Equity multiple
- 0.96×
- Total profit
- $-3,297
- Equity at exit
- $97,125
- IRR
- 4.0%
- Equity multiple
- 1.49×
- Total profit
- $38,346
- Equity at exit
- $130,866
Cash invested: $77,776 (down + closing). Projections, not guarantees.
Landlord ↔ Tenant lean methodology
- Overall (STATE)
- 90 Strongly Landlord-Friendly
- State Georgia
- 90 Strongly Landlord-Friendly · R+3
- County
- — inherits STATE
- City
- — inherits STATE
ZIP-level market 31316
- Home prices YoY
- 0.6%
- Active inventory
- 409
- Price-to-rent
- 7.5×
Monthly cashflow live
- Estimated rent
- $2,218 medium interval (Pro) →
- Mortgage (P&I)
- −$1,457
- Tax est. 1.5%
- −$347 /mo · $4,167/yr
- Insurance
- −$116
- HOA
- −$0
- Vacancy / Maint / Mgmt
- −$466
- Net cashflow
- $-168
Break-even live
UW: 25.0% down · 7.5% · 30yr · 1.5% tax · 5.0% vac · 8.0% maint · 8.0% mgmt
Financing live
Cash to close
- Down payment
- $69,443
- Closing costs
- $8,333
- Reserves months
- —
- Total cash needed
- —
Loan-product check · same deal, 3 products live
Conventional
25% down · 7.5% · 30yr
- Down + closing
- —
- Monthly P&I
- —
- Monthly cashflow
- —
- DSCR
- —
- Eligible?
- —
Personal DTI + credit; lowest rate.
DSCR
20% down · 8.5% · 30yr
- Down + closing
- —
- Monthly P&I
- —
- Monthly cashflow
- —
- DSCR
- —
- Eligible?
- —
No personal income docs; deal must DSCR.
Hard money
10% down · 12.0% · 12mo
- Down + closing
- —
- Monthly P&I
- —
- Monthly cashflow
- —
- DSCR
- —
- Eligible?
- —
Short-term bridge; refi at stabilization.
Rent comps 1 comps
| Address | Beds | Baths | Sqft | Rent | $/sqft | DOM | Units | Dist |
|---|---|---|---|---|---|---|---|---|
| 43 Sandy Run Rd SE Allenhurst, GA | 4.0 | 2.0 | 1450 | $1,800 | $1.24 | 43d | 1 | 0.57mi |
Listing history 27 events
-
2026-06-19days on market $199,944 Active 44 DOM
-
2026-06-18days on market $199,944 Active 43 DOM
-
2026-06-17days on market $199,944 Active 42 DOM
-
2026-06-16days on market $199,944 Active 41 DOM
-
2026-06-15days on market $199,944 Active 40 DOM
-
2026-06-14days on market $199,944 Active 38 DOM
-
2026-06-13pricedays on market $199,944 Active 37 DOM
-
2026-06-10pricedays on market $199,946 Active 35 DOM
-
2026-06-09days on market $199,947 Active 34 DOM
-
2026-06-08pricedays on market $199,947 Active 33 DOM
-
2026-06-07remarks 598-char remark
-
2026-06-07pricedays on market $199,948 Active 32 DOM
-
2026-06-05pricedays on market $199,949 Active 29 DOM
-
2026-06-03days on market $199,951 Active 28 DOM
-
2026-06-03price $199,951 Active 27 DOM
-
2026-06-02days on market $199,954 Active 27 DOM
-
2026-06-01days on market $199,954 Active 26 DOM
-
2026-05-31days on market $199,954 Active 25 DOM
-
2026-05-30days on market $199,954 Active 24 DOM
-
2026-05-18price $199,957 550-char remark
-
2026-05-16price $199,959 550-char remark
-
2026-05-13price $199,960 550-char remark
-
2026-05-13price $199,961 550-char remark
-
2026-05-05price $199,962 550-char remark
-
2026-05-04price $199,963 550-char remark
-
2026-05-01price $199,964 550-char remark
-
2026-03-10$199,965 Active 550-char remark
ⓘ Source: listings_history table (triggers on properties + properties_extension) + one-shot
backfill from property_details.listing_events for pre-trigger history.
Nearby sold comps map
Loading sold comps map…
Walkable amenities ~0.75 mi
Loading nearby amenities…
Taxation est. · year 1
- Rental income
- $26,610
- − Mortgage interest
- −$15,560
- − Property taxes
- −$4,167
- − Insurance
- −$1,389
- − Repairs & maintenance
- −$2,129
- − Management
- −$2,129
- − Depreciation
- −$8,081
- Taxable loss
- −$6,843
- Est. tax savings @ 24.0%
- +$1,642
- After-tax cash flow
- $-371/yr
For passive investors: Depreciation is non-cash, so a rental often shows a tax loss while cash-flowing — sheltering income. Rental losses are passive: they offset passive income freely, and up to $25,000/yr can offset ordinary (W-2) income if you actively participate and your MAGI is under $100k (phasing out to $0 by $150k); unused losses carry forward. On sale, claimed depreciation is recaptured at up to 25%, and gains may owe capital-gains tax (a 1031 exchange can defer both). Figures are a year-1 estimate at your 24.0% rate — not tax advice; consult a CPA.
Condition & rehab AI · 12 photos
This charming new home is move-in ready with a good condition score and modern updates. It offers a good investment opportunity with potential for value increase through minor exterior and interior enhancements.
Value-add opportunities
- Resale Paint exterior siding — Fresh paint can enhance curb appeal and home value
- Resale Install new window treatments — Updated window treatments can improve the home's aesthetic
- Both Add a small front porch — A front porch can increase both resale and rental value by enhancing curb appeal and providing a welcoming entrance
Renovation cost estimate screening
Value-add ROI direction
- Resale Paint exterior siding — Fresh paint can enhance curb appeal and home value ↑
- Resale Install new window treatments — Updated window treatments can improve the home's aesthetic ↑
- Both Add a small front porch — A front porch can increase both resale and rental value by enhancing curb appeal and providing a welcoming entrance ↑
ⓘ Cost ranges are severity-bucket heuristics (US national rule-of-thumb). Get contractor quotes + a written scope before underwriting a rehab budget.
Schools (NCES district)
- District
- Long County
- NCES district ID
- 1303360
- Math proficiency
- 26% ▼ -14.00%
- Reading proficiency
- 26% ▼ -13.00%
- Median HH income
- $45,958
- Composite
- 22.51/100
- National rank
- #8090
- State rank
- #115 of 174 in GA
Livability — Walthourville
- Score
- 64/100
- State rank
- #255
- US rank
- #14108
Category grades
Schools grade is shown separately in the Schools card above.
Census & demographics
- County
- Long County · 13,812 people
- City population
- 4,933
- Metro
- Hinesville, GA
- Population (ZIP)
- 13,812
- Household income
- $74,766
- Rent vs Own
- Severe rent burden
- 109.0
Population outlook (Long County) Hauer SSP2
- Today (2025)
- 24,669 people
- By 2030
- 28,223 · +14.4%
- By 2040
- 35,430 · +43.6%
- By 2050
- 42,403 · +71.9%
- By 2075
- 56,996 · +131.0%
- By 2100
- 64,185 · +160.2%
Race, ethnicity, and origin ACS 2023
- Neighborhood character
- Diverse neighborhood (Simpson 0.56)
- Race & ethnicity
- White 61% Black 23% Hispanic / Latino 8% Two or more races 8%
- Hispanic origin (detail)
- Mexican 2% Puerto Rican 5%
- Common ancestry
- Serbian 1% Italian 1% Romanian 1%
- Foreign-born
- 3% · Canada
- Languages at home
- 92% English-only · Spanish 6% Other Asian/Pacific 1% German/W. Germanic 1%
Political lean MEDSL · Long
- 2024 margin
- Strong R (+29.5) · D 35.1% · R 64.6%
- 2008→2024 swing
- -5.4pp toward R · 2008: -24.1pp · 2024: -29.5pp
- All cycles
- 2024: R+29.5 2020: R+26.4 2016: R+30.8 2012: R+22.9 2008: R+24.1
Not yet ingested
- Civics
- —
Market trends
- HPI YoY
- ▲ 1.16%
- Current HPI
- 195.2978
- Rent YoY
- —
- Metro
- Hinesville, GA
- State GDP YoY
- ▲ 2.66%
- F500 in state
- 28
Industry mix (Fortune 500 HQ in GA)
| Industry | F500 HQs | Revenue |
|---|---|---|
| Paper / Packaging | 2 | $29B |
|
||
| Retail | 1 | $160B |
|
||
| Transportation / Logistics | 1 | $91B |
|
||
| Airlines | 1 | $62B |
|
||
| Consumer Goods | 1 | $47B |
|
||
| Utilities | 1 | $25B |
|
||
Price history
-0.0% since first listed20 events — show timeline
- 2026-06-12 Price Changed $199,944 HABR
- 2026-06-11 Price Changed $199,945 HABR
- 2026-06-10 Price Changed $199,946 HABR
- 2026-06-07 Price Changed $199,947 HABR
- 2026-06-05 Price Changed $199,948 HABR
- 2026-06-03 Price Changed $199,949 HABR
- 2026-06-02 Price Changed $199,951 HABR
- 2026-05-29 Price Changed $199,954 HABR
- 2026-05-27 Price Changed $199,955 HABR
- 2026-05-26 Relisted — HABR
- 2026-05-26 Price Changed $199,956 HABR
- 2026-05-21 Delisted — HABR
- 2026-05-18 Price Changed $199,957 HABR
- 2026-05-16 Price Changed $199,959 HABR
- 2026-05-13 Price Changed $199,960 HABR
- 2026-05-13 Price Changed $199,961 HABR
- 2026-05-05 Price Changed $199,962 HABR
- 2026-05-04 Price Changed $199,963 HABR
- 2026-05-01 Price Changed $199,964 HABR
- 2026-03-10 Listed $199,965 HABR
Cash-flow waterfall
monthlySold comps — $/sqft
last 12 mo · ≤1 miLoading sold comps…