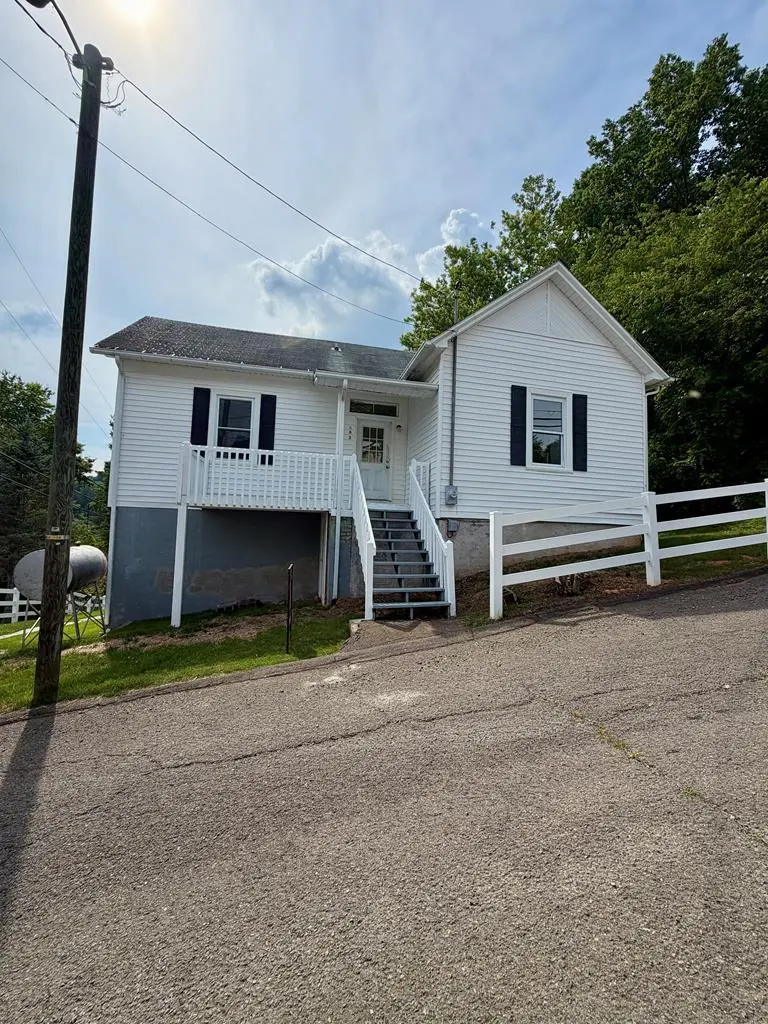
102 Boss Row · Fries, VA
Flood risk 1/10 · Minimal
- FEMA flood zone
- X (unshaded)
- Chance of flooding over 30 yrs
- 0.0%
- Est. flood insurance / yr
- $507 – $1,088
Fire risk 3/10 · Minor
- Est. fire insurance / yr
- $666 – $1,236
Heat risk 3/10 · Minor
- Hot days now (above 93°F)
- 7 days/yr
- Hot days in 30 yrs
- 21 days/yr
Wind risk 2/10 · Minimal
- Chance of severe wind over 30 yrs
- 1.0%
Air-quality risk 1/10 · Minimal
- Unhealthy air days now
- 0 days/yr
- Unhealthy air days in 30 yrs
- 0 days/yr
Risk factors via First Street. Map © Google.
Why this score? — see what drove the D- grade
The composite is a weighted blend of 9 inputs, each scored 0–100. Each bar is that input's sub-score; the figure is the points it added to the 100-point composite (weight × sub-score).
- Appreciation +9.1/10.0
- ARV discount +7.5/15.0
- Cash flow +6.5/30.0
- Schools +5.9/10.0
- Livability +3.1/5.0
- Rent growth +2.5/5.0
- Condition / age +2.5/5.0
- DSCR +0.8/10.0
- 1% rule +0.2/10.0
$199,000
🖨 Deal sheet 📄 Offer letter ✓ Due diligence
Listing remarks
This two story home provides year round and seasonal views of the New River from the front and back decks. The Fries Dam is audible year round. Seller has made numerous remodels and upgrades over the last few years. Original hardwood floors. Excellent location in town, being only a five to ten minute walk to the Town Community Center (library, pool, theater), depot, New River Trailhead, and Town Park. 3 bedrooms/1 bath, with a good option for creating a second floor bathroom. Rear entry has only a few stairs to climb. Small, easy to maintain yard, partially fenced, wooded on two sides. Fencing is vinyl. Room to create on-property parking, current parking is on street. Small enclosed storage
Key facts
- Wooded on two sides
- Partially fenced
- Excellent location
Tags
Property features AI
Exterior
- Utilities: Public water; Public sewer
- Home design: Single-family residence; Two levels
- Construction: Frame construction with vinyl siding; Shingle roof
- Exterior features: Deck; Property has a view; Cleared, sloped, and wooded lot
Interior
- Flooring: Tile; Vinyl; Wood
- Bathrooms: 1 full bathroom
- Heating & cooling: Oil heating
- Interior features: Tile, vinyl, and wood flooring; Crawl space basement (unfinished)
Neighborhood map
What this means for you Summary
Snapshot
- This is a 2-bed/1.0-bath single-family listed at $199k.
Deal economics
- At list price, monthly cash flow is $-339 ($-4k/yr) — negative.
- To cash-flow at today's rent, offer at most $139k (30.1% below list).
- To meet the 1% rule (rent ≥ 1% of price), the offer needs to be $104k (47.7% below list).
- Recommended offer: $104k (47.7% below list) — sets the bar for 1% rule.
Location & tenants
- Location reads 61/100 on livability (#416 in VA) — a middle-class / working-renter tenant base. Strengths: cost of living A+, housing B+; Watch: crime D+, amenities F, commute F.
- Grayson County Public School District (rural): math 68% / reading 76% proficiency, ranked #27 of 131 in VA (top 21%) — strong family-tenant draw, lease renewals of 3-5y typical.
- Zoned schools: Fries Elementary (math 62% / reading 77%, grade A-, #313 of 1,108 statewide, top 32%, 253 students, 87% FRL) — zoned schools average 87% FRL vs 53% district-wide (34 pts higher); higher-poverty schools than district average — tighter screening recommended.
- Market conditions: 32 active listings in the ZIP; 38 units permitted in Grayson County in 2024 (0 in 5+ unit buildings).
Forward outlook
- In year one you build about $18k of equity ($1k loan paydown + $16k appreciation (8.2% local appreciation)).
- Grayson County population projected at -24% by 2050 — secular population decline; favor cash flow + early exit over multi-decade hold.
- By year 3, paydown + projected appreciation supports a ~$44k cash-out refi (75% LTV) — recoverable capital for the next deal without selling this one.
Negotiation context
- Only 9 days on market — expect competitive offers; lowballing is unlikely to land.
Risks & watch-outs
- Watch-outs: built in 1900 — expect roof / HVAC / electrical / plumbing capex.
Questions for the listing agent
- What do current leases actually rent for vs. the listed asking? Can we see a recent rent roll and the last 12 months of T-12 income?
- Built in 1900 — when were the roof, HVAC, electrical panel, plumbing, and water heater last replaced?
- Is there a deadline driving the sale (1031 exchange, divorce, estate, relocation)? That informs how much negotiation room exists.
- Schools are A-rated — typically a magnet for longer-tenancy family renters. What's the average tenant stay here, and is there a school-zone premium baked into asking?
- Crime grade is D in this area — have there been break-ins, vandalism, or insurance claims at this property in the last 3 years? What carrier currently insures it and at what premium?
- The area grade is low — what's the realistic commute time and amenity access for the typical tenant pool here? Any planned neighborhood developments (good or bad) we should know about?
- What's the average days-on-market for RENTAL listings here right now (not sales)? A rising rental-DOM trend means longer vacancies and softer asking-rent achievability than the comps imply.
- What's the recent tenant-quality profile in this submarket — average credit score on applications, eviction rate, late-payment / NSF rate, and stable-employment percentage? A property-management company in the area should have these aggregated.
- How much new for-sale + rental construction is in the pipeline within 1–3 miles? Heavy new supply typically softens prices + rents 12–24 months out; constrained supply supports both.
Investment metrics
- 1% rule
- 0.52% ✗
- Cap rate
- 4.25%
- Cash-on-cash
- -7.29%
- DSCR
- 0.68
- GRM
- 15.9
CMA / ARV
No comps found within radius.
Projected returns pro-forma
8.16% appreciation · 3.0% rent growth · sell at horizon
- IRR
- 14.9%
- Equity multiple
- 2.12×
- Total profit
- $62,275
- Equity at exit
- $153,295
- IRR
- 14.6%
- Equity multiple
- 4.53×
- Total profit
- $196,564
- Equity at exit
- $306,323
Cash invested: $55,720 (down + closing). Projections, not guarantees.
Landlord ↔ Tenant lean methodology
- Overall (STATE)
- 55 Moderately Landlord-Leaning
- State Virginia
- 55 Moderately Landlord-Leaning · D+2
- County
- — inherits STATE
- City
- — inherits STATE
ZIP-level market 24330
- Home prices YoY
- 4.0%
- Active inventory
- 32
- Price-to-rent
- 15.9×
Monthly cashflow live
- Estimated rent
- $1,041 medium interval (Pro) →
- Mortgage (P&I)
- −$1,044
- Tax from tax record
- −$34 /mo · $414/yr
- Insurance
- −$83
- HOA
- −$0
- Vacancy / Maint / Mgmt
- −$219
- Net cashflow
- $-339
Break-even live
UW: 25.0% down · 7.5% · 30yr · 1.5% tax · 5.0% vac · 8.0% maint · 8.0% mgmt
Financing live
Cash to close
- Down payment
- $49,750
- Closing costs
- $5,970
- Reserves months
- —
- Total cash needed
- —
Loan-product check · same deal, 3 products live
Conventional
25% down · 7.5% · 30yr
- Down + closing
- —
- Monthly P&I
- —
- Monthly cashflow
- —
- DSCR
- —
- Eligible?
- —
Personal DTI + credit; lowest rate.
DSCR
20% down · 8.5% · 30yr
- Down + closing
- —
- Monthly P&I
- —
- Monthly cashflow
- —
- DSCR
- —
- Eligible?
- —
No personal income docs; deal must DSCR.
Hard money
10% down · 12.0% · 12mo
- Down + closing
- —
- Monthly P&I
- —
- Monthly cashflow
- —
- DSCR
- —
- Eligible?
- —
Short-term bridge; refi at stabilization.
Listing history 8 events
-
2026-06-18days on market $199,000 Active 9 DOM
-
2026-06-17days on market $199,000 Active 8 DOM
-
2026-06-16days on market $199,000 Active 7 DOM
-
2026-06-15days on market $199,000 Active 6 DOM
-
2026-06-15days on market $199,000 Active 5 DOM
-
2026-06-13days on market $199,000 Active 4 DOM
-
2026-06-12remarks 699-char remark
-
2026-06-12$199,000 Active 3 DOM
ⓘ Source: listings_history table (triggers on properties + properties_extension) + one-shot
backfill from property_details.listing_events for pre-trigger history.
Tax reassessment forecast VA · Resets to sale price
- Current annual tax
- $414 · $34/mo
- Projected year-2 tax
- $1,632 · $136/mo
- Expected delta
- +$1,218/yr (+$101/mo · 294.2%)
ⓘ Screening estimate from a state-policy table — verify with the county assessor before closing.
Climate risk First Street
- Flood 1/10 Low FEMA zone X (unshaded) · 0% chance over 30 yrs
- Wildfire 3/10 Moderate
- Heat 3/10 Moderate 7 d/yr ≥93°F today · 21 d/yr by 30 yrs out
- Wind 2/10 Low 100% chance of damaging wind over 30 yrs
- Air quality 1/10 Low 0 unhealthy d/yr today · 0 by 30 yrs out
Nearby sold comps map
Loading sold comps map…
Walkable amenities ~0.75 mi
Loading nearby amenities…
Taxation est. · year 1
- Rental income
- $12,491
- − Mortgage interest
- −$11,147
- − Property taxes
- −$414
- − Insurance
- −$995
- − Repairs & maintenance
- −$999
- − Management
- −$999
- − Depreciation
- −$5,789
- Taxable loss
- −$7,852
- Est. tax savings @ 24.0%
- +$1,885
- After-tax cash flow
- $-2,179/yr
For passive investors: Depreciation is non-cash, so a rental often shows a tax loss while cash-flowing — sheltering income. Rental losses are passive: they offset passive income freely, and up to $25,000/yr can offset ordinary (W-2) income if you actively participate and your MAGI is under $100k (phasing out to $0 by $150k); unused losses carry forward. On sale, claimed depreciation is recaptured at up to 25%, and gains may owe capital-gains tax (a 1031 exchange can defer both). Figures are a year-1 estimate at your 24.0% rate — not tax advice; consult a CPA.
Schools (NCES district)
- District
- Grayson County Public School District
- NCES district ID
- 5101690
- Math proficiency
- 68% ▼ -20.00%
- Reading proficiency
- 76% ▼ -7.00%
- Median HH income
- $31,429
- Composite
- 59.22/100
- National rank
- #942
- State rank
- #27 of 131 in VA
Livability — Fries
- Score
- 61/100
- State rank
- #416
- US rank
- #17459
Category grades
Schools grade is shown separately in the Schools card above.
Census & demographics
- Census place
- Fries, VA
- Population (ZIP)
- 2,870
Population outlook (Grayson County) Hauer SSP2
- Today (2025)
- 14,252 people
- By 2030
- 13,634 · -4.3%
- By 2040
- 12,202 · -14.4%
- By 2050
- 10,811 · -24.1%
- By 2075
- 8,069 · -43.4%
- By 2100
- 5,647 · -60.4%
Race, ethnicity, and origin ACS 2023
- Neighborhood character
- Predominantly White (94%)
- Race & ethnicity
- White 94% Hispanic / Latino 4% Two or more races 2%
- Common ancestry
- Lithuanian 1% Slovak 1%
Political lean MEDSL · Grayson
- 2024 margin
- Solid R (+62.2) · D 18.6% · R 80.8%
- 2008→2024 swing
- -33.7pp toward R · 2008: -28.5pp · 2024: -62.2pp
- All cycles
- 2024: R+62.2 2020: R+61.4 2016: R+57.7 2012: R+37.9 2008: R+28.5
Not yet ingested
- Civics
- —
Market trends
- HPI YoY
- ▲ 8.16%
- Current HPI
- 213.619
- Rent YoY
- —
- Metro
- —
- State GDP YoY
- ▲ 2.40%
- F500 in state
- 50
Industry mix (Fortune 500 HQ in VA)
| Industry | F500 HQs | Revenue |
|---|---|---|
| Aerospace / Defense | 4 | $236B |
|
||
| Technology / Defense | 3 | $32B |
|
||
| Financial Services | 2 | $176B |
|
||
| Utilities | 2 | $27B |
|
||
| Insurance | 2 | $25B |
|
||
| Technology | 2 | $15B |
|
||
Price history
1 event — show timeline
- 2026-06-10 Listed $199,000 SWVAR
Property tax history
+2.2%/yrLatest (2025): $414 · -25.9% YoY. Source: county tax records.
Cash-flow waterfall
monthlySold comps — $/sqft
last 12 mo · ≤1 miLoading sold comps…