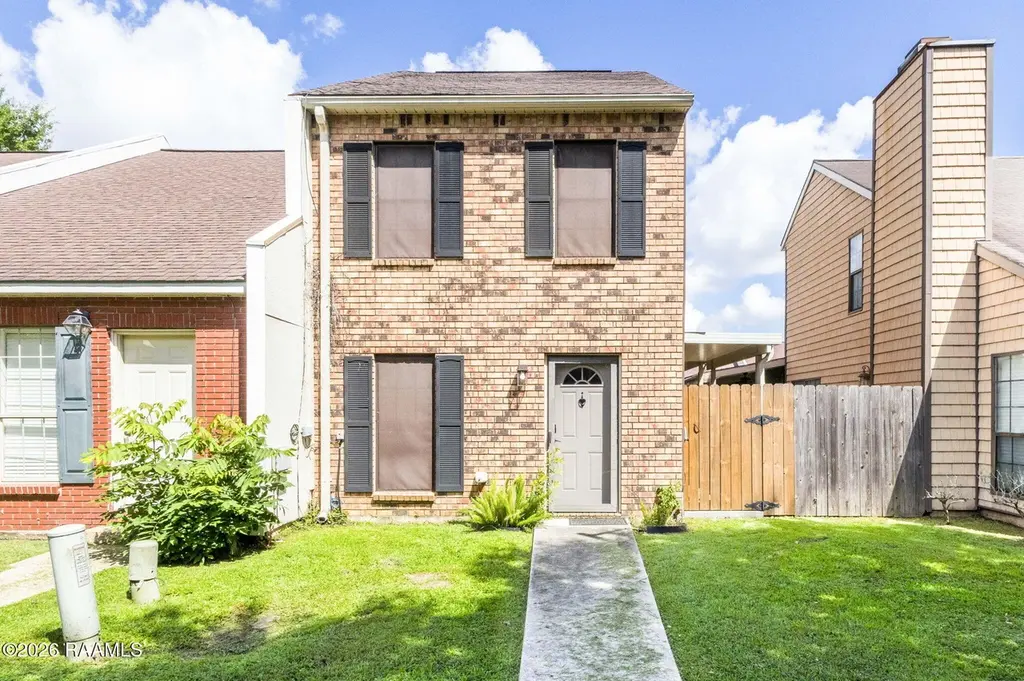
203 Long Plantation Blvd Apt D · Lafayette, LA
Flood risk 8/10 · Major
- FEMA flood zone
- AE
- Chance of flooding over 30 yrs
- 0.99%
- Est. flood insurance / yr
- $1,737 – $8,500
Fire risk 1/10 · Minimal
- Est. fire insurance / yr
- $1,269 – $2,357
Heat risk 9/10 · Severe
- Hot days now (above 108°F)
- 7 days/yr
- Hot days in 30 yrs
- 21 days/yr
Wind risk 9/10 · Severe
- Chance of severe wind over 30 yrs
- 99.0%
Air-quality risk 2/10 · Minimal
- Unhealthy air days now
- 0 days/yr
- Unhealthy air days in 30 yrs
- 1 days/yr
Risk factors via First Street. Map © Google.
Why this score? — see what drove the C+ grade
The composite is a weighted blend of 9 inputs, each scored 0–100. Each bar is that input's sub-score; the figure is the points it added to the 100-point composite (weight × sub-score).
- Cash flow +25.8/30.0
- DSCR +8.6/10.0
- ARV discount +7.5/15.0
- 1% rule +6.6/10.0
- Schools +3.6/10.0
- Livability +3.5/5.0
- Rent growth +2.8/5.0
- Condition / age +2.5/5.0
- Appreciation +0.0/10.0
$165,000
🖨 Deal sheet 📄 Offer letter ✓ Due diligence
Listing remarks MLS
Location, Location, Location! Welcome to this charming 2 bedroom 1 1/2 bath townhome located in the heart of Lafayette across from River Ranch. This home features granite countertops, spacious closets, and a screened-in private back patio perfect for relaxing. Don't miss your opportunity to make this your new home!
Key facts
- Community pool
- Spacious closets
- Granite countertops
Tags
Property features AI
Finance
- HOA & community: Community pool; Monthly association fee of $75; Association covers grounds maintenance and trash
Exterior
- Parking: Assigned carport; 2 covered parking spaces; 2 carport spaces (total parking 2)
- Utilities: Public sewer; City electricity
- Home design: Single family residence / Townhouse
- Construction: Brick veneer and brick with frame construction; Composition roof
- Exterior features: Privacy wood fencing; Porch (screened)
Interior
- Kitchen: Dishwasher; Disposal; Microwave; Refrigerator; Electric stove/oven
- Flooring: Tile; Vinyl plank
- Bathrooms: 1 full bathroom; 1 half bathroom
- Heating & cooling: Central heating (electric); Central air conditioning
- Interior features: Crown molding; Granite counters; Aluminum window frames; Window treatments
- Laundry & utility: Washer hookup; Electric dryer hookup; Washer; Dryer
Neighborhood map
What this means for you Summary
Snapshot
- This is a 2-bed/1.5-bath single-family listed at $165k.
Deal economics
- At list price, monthly cash flow is $-24 ($-291/yr) — negative.
- To cash-flow at today's rent, offer at most $161k (2.6% below list).
- Meets the 1% rule at list price ($2k rent vs $165k).
- Recommended offer: $161k (2.6% below list) — sets the bar for cash-flow.
- Cap rate 9.2% vs local median 4.7% in Lafayette — top-decile yield for the area; either an underpriced asset or a hidden risk that comps aren't pricing in. Stress-test before assuming the spread holds.
Location & tenants
- Location reads 70/100 on livability (#63 in LA) — a middle-class / working-renter tenant base. Strengths: cost of living A+, housing A+, health & safety A+; Watch: amenities C-, employment C-, crime F.
- Lafayette Parish (urban): math 38% / reading 46% proficiency, ranked #19 of 98 in LA (top 19%) — families likely to look elsewhere, expect single-tenant / working-renter base with shorter leases.
- Zoned schools: L.J. Alleman Middle School (math 48% / reading 56%, grade C+, #23 of 218 statewide, top 10%, 952 students, 54% FRL); O. Comeaux High School (math 38% / reading 40%, grade F, #86 of 265 statewide, top 33%, 1,098 students, 56% FRL) — zoned schools at 55% FRL track the district average.
- Market conditions: Rents rising (+1.2%/yr); 464 active listings in the ZIP; 33 comparable units currently listed for rent nearby; rentals at typical pace (median 21d on market — plan ~3-4 weeks tenant-placement turnaround); solid renter incomes; 1,585 units permitted in Lafayette Parish in 2024 (10 in 5+ unit buildings).
Forward outlook
- Local home prices are declining (-3.0%/yr); year-one equity from $1k of loan paydown is wiped out by about $5k of value loss. Plan a longer hold.
- Lafayette County population projected at +34% by 2050 — long-run rental-demand tailwind backs the buy-and-hold thesis.
Negotiation context
- Only 1 days on market — expect competitive offers; lowballing is unlikely to land.
- 2 sale attempts since 2y ago with the ask held roughly flat each time — persistent listings suggest the price (not the market) is what's stuck; bring a comps-based counter.
- Current owner paid $143k; 15% above their basis — modest negotiation headroom, anchor on the comps not their cost.
Risks & watch-outs
- Watch-outs: flood insurance adds $427/mo; built in 1860 — expect roof / HVAC / electrical / plumbing capex.
- Climate carrying-cost: in FEMA flood zone AE (mandatory federal flood insurance); severe wind risk, 99% chance of damaging wind over 30y; extreme-heat days projected 7→21/yr by 2055 (HVAC capex compounding) — expect insurance premiums to compound above CPI over the hold.
Questions for the listing agent
- What do current leases actually rent for vs. the listed asking? Can we see a recent rent roll and the last 12 months of T-12 income?
- Built in 1860 — when were the roof, HVAC, electrical panel, plumbing, and water heater last replaced?
- What's the actual annual flood-insurance premium (NFIP or private), and is the property in a SFHA with mandatory coverage?
- What does the HOA fee cover, when was the last increase, and are there any pending special assessments or reserve-fund shortfalls?
- Is there a deadline driving the sale (1031 exchange, divorce, estate, relocation)? That informs how much negotiation room exists.
- Schools are B-rated — typically a magnet for longer-tenancy family renters. What's the average tenant stay here, and is there a school-zone premium baked into asking?
- Crime grade is F in this area — have there been break-ins, vandalism, or insurance claims at this property in the last 3 years? What carrier currently insures it and at what premium?
- What's the average days-on-market for RENTAL listings here right now (not sales)? A rising rental-DOM trend means longer vacancies and softer asking-rent achievability than the comps imply.
- What's the recent tenant-quality profile in this submarket — average credit score on applications, eviction rate, late-payment / NSF rate, and stable-employment percentage? A property-management company in the area should have these aggregated.
- How much new for-sale + rental construction is in the pipeline within 1–3 miles? Heavy new supply typically softens prices + rents 12–24 months out; constrained supply supports both.
Investment metrics
- 1% rule
- 1.16% ✓
- Cap rate
- 9.22%
- Cash-on-cash
- 10.45%
- DSCR
- 1.46
- GRM
- 7.2
CMA / ARV
- ARV (on-the-fly)
- $165,072
- Comps found
- 12
Show comp detail 12 sales within ~0.75 mi
| Address | Dist | Beds/Ba | Sqft | Sold | Price | $/sf | Match |
|---|---|---|---|---|---|---|---|
| 208 Long Plantation Blvd Unit D | 0.07mi | 2/1.5 | 1,107 (+2%) | 0mo | $165,000 | $149 | 93 |
| 210 Long Plantation Apt A | 0.10mi | 2/1.5 | 1,100 (+1%) | 1mo | $176,000 | $160 | 92 |
| 209 Long Plantation Unit A | 0.06mi | 2/1.5 | 1,072 (-1%) | 4mo | $172,500 | $161 | 92 |
| 210 Long Plantation Blvd Unit N | 0.10mi | 2/1.5 | 1,100 (+1%) | 4mo | $167,500 | $152 | 90 |
| 208 Long Plantation Blvd Unit F | 0.07mi | 2/2.0 | 1,100 (+1%) | 10mo | $172,500 | $157 | 84 |
| 202 Long Plantation Blvd Unit C | 0.08mi | 2/2.0 | 1,103 (+2%) | 9mo | $166,000 | $150 | 84 |
| 208 Long Plantation Blvd Unit G | 0.07mi | 2/2.0 | 1,140 (+5%) | 6mo | $140,000 | $123 | 82 |
| 210 Long Plantation Blvd Unit L | 0.10mi | 2/2.0 | 1,100 (+1%) | 13mo | $165,000 | $150 | 80 |
| 109 Flurry Ln | 0.61mi | 2/2.5 | 1,102 (+2%) | 1mo | $155,000 | $141 | 64 |
| 105 Flurry Ln | 0.61mi | 2/2.5 | 1,119 (+3%) | 3mo | $159,500 | $143 | 60 |
| 126a Steiner Rd | 0.41mi | 2/2.5 | 1,245 (+15%) | 4mo | $310,000 | $249 | 49 |
| 122 Steiner Rd | 0.41mi | 3/2.0 (+1) | 1,200 (+10%) | 12mo | $190,000 | $158 | 47 |
Match score weights: distance 35% · size 25% · config 20% · recency 20%. Top-matched comps best support the ARV.
Projected returns pro-forma
-3.0% appreciation · 1.23% rent growth · sell at horizon
- IRR
- -19.9%
- Equity multiple
- 0.32×
- Total profit
- $-31,369
- Equity at exit
- $24,602
- IRR
- -18.5%
- Equity multiple
- 0.10×
- Total profit
- $-41,497
- Equity at exit
- $14,266
Cash invested: $46,200 (down + closing). Projections, not guarantees.
Landlord ↔ Tenant lean methodology
- Overall (STATE)
- 90 Strongly Landlord-Friendly
- State Louisiana
- 90 Strongly Landlord-Friendly · R+12
- County
- — inherits STATE
- City
- — inherits STATE
ZIP-level market 70508
- Home prices YoY
- -34.7%
- Rents YoY
- 1.2%
- Active inventory
- 464
- Price-to-rent
- 7.2×
Monthly cashflow live
- Estimated rent
- $1,921 high interval (Pro) →
- Mortgage (P&I)
- −$865
- Tax from tax record
- −$106 /mo · $1,271/yr
- Insurance
- −$69
- Flood insurance flood zone
- −$427 /mo · $5,118/yr
- HOA
- −$75
- Vacancy / Maint / Mgmt
- −$403
- Net cashflow
- $-24
Break-even live
UW: 25.0% down · 7.5% · 30yr · 1.5% tax · 5.0% vac · 8.0% maint · 8.0% mgmt
Financing live
Cash to close
- Down payment
- $41,250
- Closing costs
- $4,950
- Reserves months
- —
- Total cash needed
- —
Loan-product check · same deal, 3 products live
Conventional
25% down · 7.5% · 30yr
- Down + closing
- —
- Monthly P&I
- —
- Monthly cashflow
- —
- DSCR
- —
- Eligible?
- —
Personal DTI + credit; lowest rate.
DSCR
20% down · 8.5% · 30yr
- Down + closing
- —
- Monthly P&I
- —
- Monthly cashflow
- —
- DSCR
- —
- Eligible?
- —
No personal income docs; deal must DSCR.
Hard money
10% down · 12.0% · 12mo
- Down + closing
- —
- Monthly P&I
- —
- Monthly cashflow
- —
- DSCR
- —
- Eligible?
- —
Short-term bridge; refi at stabilization.
Rent comps 33 comps
| Address | Beds | Baths | Sqft | Rent | $/sqft | DOM | Units | Dist |
|---|---|---|---|---|---|---|---|---|
| 1521 Camellia Blvd Lafayette, LA | 1.0–3.0 | 1.0–2.0 | 1246 | $1,931 | $1.55 | 13d | 16 | 0.14mi |
| 1510 Kaliste Saloom Rd #404 Lafayette, LA | 3.0 | 2.5 | 1398 | $4,000 | $2.86 | 43d | 1 | 0.34mi |
| 105 Steiner Rd Lafayette, LA | 2.0 | 2.5 | 1190 | $2,900 | $2.44 | 21d | 1 | 0.45mi |
| 201 Settlers Trace Blvd Lafayette, LA | 1.0–3.0 | 1.0–2.0 | 1024 | $1,476 | $1.44 | 13d | 12 | 0.46mi |
| 206 Steiner Oaks Lafayette, LA | 2.0 | 2.5 | 1200 | $2,975 | $2.48 | 43d | 1 | 0.48mi |
| 214 Steiner Oaks Lafayette, LA | 2.0 | 2.5 | 1190 | $1,900 | $1.60 | 43d | 1 | 0.48mi |
| 110 E Martial Ave Lafayette, LA | 1.0–3.0 | 1.0–2.0 | 1047 | $1,305 | $1.25 | 13d | 5 | 0.55mi |
| 402 E Martial Ave Lafayette, LA | 3.0 | 2.0 | 1500 | $4,000 | $2.67 | 43d | 1 | 0.55mi |
| 104 shirekeep Ln Lafayette, LA | 2.0 | 2.5 | 1311 | $1,985 | $1.51 | 13d | 1 | 0.60mi |
| 104 shirekeep Ln Lafayette, LA | 2.0 | 2.5 | 1311 | $2,075 | $1.58 | 43d | 1 | 0.60mi |
| 210 Polly Ln Lafayette, LA | 1.0–3.0 | 1.0–2.0 | 1064 | $1,447 | $1.36 | 13d | 23 | 0.67mi |
| 1019 Kaliste Saloom Rd Lafayette, LA | 1.0–3.0 | 1.0–2.0 | 928 | $1,325 | $1.43 | 13d | 28 | 0.68mi |
| 302 Richland Ave Unit 103C Lafayette, LA | 2.0 | 2.0 | 1409 | $4,200 | $2.98 | 43d | 1 | 0.80mi |
| 302 Richland Ave Unit 103C Lafayette, LA | 2.0 | 2.0 | 1049 | $4,200 | $4.00 | 21d | 1 | 0.80mi |
| 220 Steiner Rd Lafayette, LA | 2.0 | 2.5 | 1200 | $3,200 | $2.67 | 43d | 1 | 0.82mi |
| 215 Republic Ave Lafayette, LA | 1.0–2.0 | 1.0–2.0 | 863 | $1,455 | $1.69 | 13d | 16 | 0.84mi |
| 5530 Ambassador Caffrey Blvd Lafayette, LA | 1.0–3.0 | 1.0–2.0 | 1194 | $1,505 | $1.26 | 13d | 15 | 0.95mi |
| 2314 Kaliste Saloom Rd Lafayette, LA | 1.0–2.0 | 1.0–2.0 | 704 | $1,150 | $1.63 | 13d | 20 | 0.95mi |
| 122 S Beadle Rd Lafayette, LA | 3.0 | 2.0 | 1500 | $1,500 | $1.00 | 43d | 1 | 0.97mi |
| 1042 Camellia Blvd Lafayette, LA | 1.0–2.0 | 1.0–2.0 | 880 | $1,941 | $2.21 | 13d | 10 | 0.98mi |
| 319 Artisan Rd Unit D Lafayette, LA | 2.0 | 2.0 | 1000 | $1,200 | $1.20 | 21d | 1 | 0.99mi |
| 108 Beaulac Ln Lafayette, LA | 2.0 | 2.0 | 1450 | $2,950 | $2.03 | 43d | 1 | 1.08mi |
| 108 Oak Plains Aly Unit A Lafayette, LA | 2.0 | 1.5 | 1000 | $1,895 | $1.90 | 43d | 1 | 1.29mi |
| 111 Oak Plains Aly Lafayette, LA | 2.0 | 2.0 | 1070 | $1,550 | $1.45 | 21d | 1 | 1.29mi |
| 110 Oak Plains Aly Lafayette, LA | 2.0 | 2.0 | 980 | $1,550 | $1.58 | 21d | 1 | 1.29mi |
| 330 Feu Follet Rd Lafayette, LA | 1.0–2.0 | 1.0–2.0 | 806 | $1,488 | $1.85 | 13d | 22 | 1.29mi |
| 112 Vieux Orleans Cir Unit C Lafayette, LA | 2.0 | 1.0 | 900 | $750 | $0.83 | 13d | 1 | 1.30mi |
| 110 Frem Boustany Dr Lafayette, LA | 1.0–3.0 | 1.0–2.0 | 1026 | $1,670 | $1.63 | 21d | 15 | 1.35mi |
| 536 Settlers Trace Blvd Lafayette, LA | 1.0–3.0 | 1.0–2.0 | 1103 | $1,600 | $1.45 | 13d | 10 | 1.35mi |
| 101 Vieux Orleans Cir Unit A Lafayette, LA | 2.0 | 1.0 | 1000 | $800 | $0.80 | 43d | 1 | 1.37mi |
| 610 Pillette Rd #206 Lafayette, LA | 2.0 | 2.0 | 856 | $850 | $0.99 | 43d | 1 | 1.42mi |
| 110 Country Ln Lafayette, LA | 2.0 | 1.5 | 950 | $775 | $0.82 | 21d | 1 | 1.49mi |
| 110 Country Ln Apt C Lafayette, LA | 2.0 | 1.5 | 950 | $775 | $0.82 | 43d | 1 | 1.49mi |
HOA detail
- Monthly dues
- $75 · $900/yr
Listing history 2 events
-
2026-06-18remarks 699-char remark
-
2026-06-18$165,000 Active 1 DOM
ⓘ Source: listings_history table (triggers on properties + properties_extension) + one-shot
backfill from property_details.listing_events for pre-trigger history.
Tax reassessment forecast LA · Resets to sale price
- Current annual tax
- $1,271 · $106/mo
- Projected year-2 tax
- $1,271 · $106/mo
- Expected delta
- $0/yr ($0/mo · 0.0%)
ⓘ Screening estimate from a state-policy table — verify with the county assessor before closing.
Climate risk First Street
- Flood 8/10 Severe FEMA zone AE · 99% chance over 30 yrs
- Wildfire 1/10 Low
- Heat 9/10 Extreme 7 d/yr ≥108°F today · 21 d/yr by 30 yrs out
- Wind 9/10 Extreme 99% chance of damaging wind over 30 yrs
- Air quality 2/10 Low 0 unhealthy d/yr today · 1 by 30 yrs out
Nearby sold comps map
Loading sold comps map…
Walkable amenities ~0.75 mi
Loading nearby amenities…
Taxation est. · year 1
- Rental income
- $23,046
- − Mortgage interest
- −$9,243
- − Property taxes
- −$1,271
- − Insurance
- −$5,944
- − Repairs & maintenance
- −$1,844
- − Management
- −$1,844
- − HOA
- −$900
- − Depreciation
- −$4,800
- Taxable loss
- −$2,798
- Est. tax savings @ 24.0%
- +$672
- After-tax cash flow
- $380/yr
For passive investors: Depreciation is non-cash, so a rental often shows a tax loss while cash-flowing — sheltering income. Rental losses are passive: they offset passive income freely, and up to $25,000/yr can offset ordinary (W-2) income if you actively participate and your MAGI is under $100k (phasing out to $0 by $150k); unused losses carry forward. On sale, claimed depreciation is recaptured at up to 25%, and gains may owe capital-gains tax (a 1031 exchange can defer both). Figures are a year-1 estimate at your 24.0% rate — not tax advice; consult a CPA.
Schools (NCES district)
- District
- Lafayette Parish
- NCES district ID
- 2200870
- Math proficiency
- 38% ▼ -32.00%
- Reading proficiency
- 46% ▼ -24.00%
- Median HH income
- $50,238
- Composite
- 36.15/100
- National rank
- #4741
- State rank
- #19 of 98 in LA
Livability — Lafayette
- Score
- 70/100
- State rank
- #63
- US rank
- #8133
Category grades
Schools grade is shown separately in the Schools card above.
Census & demographics
- Census place
- Lafayette, LA
- County
- Lafayette Parish · 207,544 people
- City population
- 158,114
- Metro
- Lafayette, LA
- Population (ZIP)
- 40,592
- Household income
- $86,005
- Rent vs Own
- Severe rent burden
- 1860.0
Population outlook (Lafayette County) Hauer SSP2
- Today (2025)
- 280,930 people
- By 2030
- 301,092 · +7.2%
- By 2040
- 339,456 · +20.8%
- By 2050
- 375,156 · +33.5%
- By 2075
- 451,672 · +60.8%
- By 2100
- 497,203 · +77.0%
Race, ethnicity, and origin ACS 2023
- Neighborhood character
- Predominantly White (75%)
- Race & ethnicity
- White 75% Black 13% Two or more races 7% Hispanic / Latino 5% Asian 3%
- Common ancestry
- Lithuanian 20% Slovak 2% Italian 1%
- Foreign-born
- 5% · Canada, China
- Languages at home
- 91% English-only · Spanish 3% French/Haitian/Cajun 2% Other Indo-European 1%
Political lean MEDSL · Lafayette
- 2024 margin
- Solid R (+31.4) · D 33.5% · R 64.8% · Other 1.7%
- 2008→2024 swing
- -0.1pp no change · 2008: -31.3pp · 2024: -31.4pp
- All cycles
- 2024: R+31.4 2020: R+28.7 2016: R+33.6 2012: R+33.7 2008: R+31.3
Not yet ingested
- Civics
- —
Market trends
- HPI YoY
- ▼ -76.28%
- Current HPI
- 143.6305
- Rent YoY
- ▲ 1.23%
- Metro
- Lafayette, LA
- State GDP YoY
- ▲ 3.29%
- F500 in state
- 10
Industry mix (Fortune 500 HQ in LA)
| Industry | F500 HQs | Revenue |
|---|---|---|
| Telecommunications | 2 | $23B |
|
||
| Utilities | 1 | $12B |
|
||
| Wholesale / Distribution | 1 | $5B |
|
||
| Advertising | 1 | $2B |
|
||
Price history
-2.4% since first listed7 events — show timeline
- 2026-06-18 Listed $165,000 AcadianaMLS
- 2025-02-05 Sold (Public Records) $143,000 Public Records
- 2025-02-03 Sold (MLS) $143,000 AcadianaMLS
- 2025-01-14 Pending — AcadianaMLS
- 2025-01-05 Price Changed $149,000 AcadianaMLS
- 2024-11-19 Price Changed $159,000 AcadianaMLS
- 2024-10-11 Listed $169,000 AcadianaMLS
Property tax history
+15.6%/yrLatest (2025): $1,271 · -1.1% YoY. Source: county tax records.
Cash-flow waterfall
monthlySold comps — $/sqft
last 12 mo · ≤1 miLoading sold comps…