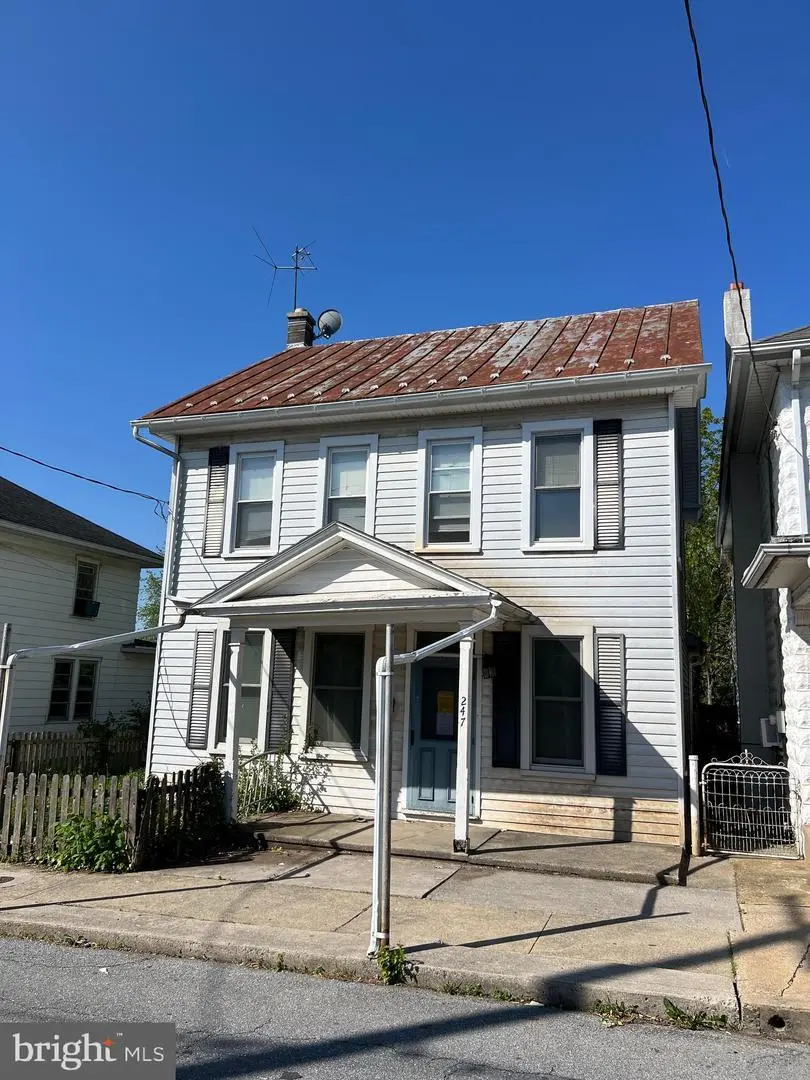
247 N College St · Palmyra, PA
Flood risk 1/10 · Minimal
- FEMA flood zone
- X (unshaded)
- Chance of flooding over 30 yrs
- 0.0%
- Est. flood insurance / yr
- $473 – $860
Fire risk 3/10 · Minor
- Est. fire insurance / yr
- $511 – $949
Heat risk 5/10 · Moderate
- Hot days now (above 101°F)
- 7 days/yr
- Hot days in 30 yrs
- 15 days/yr
Wind risk 3/10 · Minor
- Chance of severe wind over 30 yrs
- 8.0%
Air-quality risk 3/10 · Minor
- Unhealthy air days now
- 3 days/yr
- Unhealthy air days in 30 yrs
- 5 days/yr
Risk factors via First Street. Map © Google.
Why this score? — see what drove the B- grade
The composite is a weighted blend of 9 inputs, each scored 0–100. Each bar is that input's sub-score; the figure is the points it added to the 100-point composite (weight × sub-score).
- Cash flow +23.0/30.0
- ARV discount +15.0/15.0
- DSCR +7.4/10.0
- 1% rule +7.0/10.0
- Schools +5.3/10.0
- Livability +4.0/5.0
- Rent growth +2.5/5.0
- Condition / age +2.5/5.0
- Appreciation +0.0/10.0
$148,500
🖨 Deal sheet 📄 Offer letter ✓ Due diligence
Listing remarks
* * FIXER UPPER PUBLIC AUCTION ALERT * * Property is up for public auction on Wednesday, May 27th @ 2PM and is sold as is, where is with no contingencies. For auction terms and conditions please visit auction website. Starting Bid: ONLY $50,000!! This property is in need of a cosmetic renovation - Single Family Home with 3 bedrooms and 1 bathroom in Palmyra Borough. Auction Terms - $10,000 deposit on the day of the auction with the balance due in 14 days. A 10% buyer premium will be added to the high bid price and become part of the purchase price. The buyer will be responsible for the 2% PA real estate transfer tax. Buyer will assume contents at the property.
Key facts
- 6,970 sq ft lot
- Built 1930
- Listed 24 days
Property features AI
Finance
- Other: Fee simple ownership; Finished area above grade reported by assessor (1,416)
Exterior
- Parking: Alley access; Off-street parking
- Utilities: Public water; Public sewer
- Home design: Detached property; Metal roof; Vinyl siding construction
- Construction: Block foundation; Above-grade and below-grade structures
- Exterior features: Not in a federal flood zone; Ground rent paid annually
Interior
- Bedrooms: Three bedrooms on the first upper level
- Bathrooms: One full bathroom (all upper levels)
- Heating & cooling: Hot water heating; Oil-fired heating
- Interior features: Unfinished basement; Living area reported by assessor
Neighborhood map
What this means for you Summary
Snapshot
- This is a 3-bed/1.0-bath single-family listed at $148k.
Deal economics
- At list price, monthly cash flow is $265 ($3k/yr) — positive.
- The deal already cash-flows at list — no discount required.
- Meets the 1% rule at list price ($2k rent vs $148k).
- Recommended offer: $146k (1.5% below list) — sets the bar for market timing.
- Cap rate 8.4% vs local median 1.8% in Palmyra — top-decile yield for the area; either an underpriced asset or a hidden risk that comps aren't pricing in. Stress-test before assuming the spread holds.
Location & tenants
- Location reads 79/100 on livability (#246 in PA, #2,112 nationally) — a middle-class / working-renter tenant base. Strengths: cost of living A+, housing A+, health & safety A+; Watch: commute F.
- Palmyra Area SD (suburban): math 52% / reading 70% proficiency, ranked #63 of 539 in PA (top 12%) — acceptable for families but not a draw, mixed tenant base, ~2y average lease; only 16% free/reduced lunch — higher-income household profile.
- Market conditions: 110 active listings in the ZIP; 10 comparable units currently listed for rent nearby; rentals lingering (median 44d on market — plan ~5-8 weeks vacancy on turnover, expect pricing pressure); 70% of comp listings sitting > 30 days — soft ceiling on asking rent; solid renter incomes; 315 units permitted in Lebanon County in 2024 (36 in 5+ unit buildings).
Forward outlook
- Local home prices are declining (-3.0%/yr); year-one equity from $1k of loan paydown is wiped out by about $4k of value loss. Plan a longer hold.
- Lebanon County population projected at +10% by 2050 — modest demand growth; plan on rents tracking national, not racing it.
Negotiation context
- It's been on market 24 days — a 2% lower offer ($146k) is reasonable based on typical stale-listing flexibility.
- Current owner paid $110k; 35% above their basis — modest negotiation headroom, anchor on the comps not their cost.
Risks & watch-outs
- Watch-outs: built in 1930 — expect roof / HVAC / electrical / plumbing capex.
- Climate carrying-cost: extreme-heat days projected 7→15/yr by 2055 (HVAC capex compounding) — expect insurance premiums to compound above CPI over the hold.
Questions for the listing agent
- Built in 1930 — when were the roof, HVAC, electrical panel, plumbing, and water heater last replaced?
- Is there a deadline driving the sale (1031 exchange, divorce, estate, relocation)? That informs how much negotiation room exists.
- Schools are A-rated — typically a magnet for longer-tenancy family renters. What's the average tenant stay here, and is there a school-zone premium baked into asking?
- What's the average days-on-market for RENTAL listings here right now (not sales)? A rising rental-DOM trend means longer vacancies and softer asking-rent achievability than the comps imply.
- What's the recent tenant-quality profile in this submarket — average credit score on applications, eviction rate, late-payment / NSF rate, and stable-employment percentage? A property-management company in the area should have these aggregated.
- How much new for-sale + rental construction is in the pipeline within 1–3 miles? Heavy new supply typically softens prices + rents 12–24 months out; constrained supply supports both.
Investment metrics
- 1% rule
- 1.20% ✓
- Cap rate
- 8.43%
- Cash-on-cash
- 7.65%
- DSCR
- 1.34
- GRM
- 7.0
CMA / ARV
- ARV (median comp)
- $221,757
- List price
- $148,500
- Delta
- -33.03%
- Verdict
- UNDERPRICED
- Comps
- 20 within 1.0 mi
Show comp detail 12 sales within ~0.75 mi
| Address | Dist | Beds/Ba | Sqft | Sold | Price | $/sf | Match |
|---|---|---|---|---|---|---|---|
| 36 Evergreen Aly | 0.22mi | 3/2.0 | 1,422 (+0%) | 8mo | $220,000 | $155 | 78 |
| 133 W Spruce St | 0.26mi | 3/2.0 | 1,404 (-1%) | 7mo | $125,000 | $89 | 76 |
| 223 S Locust St | 0.45mi | 3/2.0 | 1,404 (-1%) | 3mo | $230,000 | $164 | 71 |
| 425 E Maple St | 0.60mi | 3/1.5 | 1,452 (+2%) | 4mo | $290,000 | $200 | 63 |
| 500 W Cherry St | 0.50mi | 3/1.5 | 1,386 (-2%) | 11mo | $270,000 | $195 | 62 |
| 90 E Hazel St | 0.39mi | 3/1.0 | 1,248 (-12%) | 3mo | $250,000 | $200 | 60 |
| 564 W Cedar St | 0.55mi | 3/2.0 | 1,512 (+7%) | 6mo | $122,000 | $81 | 54 |
| 412 W Cedar St | 0.66mi | 2/2.0 (-1) | 1,428 (+1%) | 11mo | $125,000 | $88 | 50 |
| 309 W Oak St | 0.51mi | 3/1.5 | 1,291 (-9%) | 12mo | $354,500 | $275 | 50 |
| 510 W Maple St | 0.55mi | 2/2.0 (-1) | 1,518 (+7%) | 5mo | $306,500 | $202 | 49 |
| 701 N Grant St | 0.57mi | 3/2.0 | 1,232 (-13%) | 6mo | $310,000 | $252 | 42 |
| 624 W Cedar St | 0.52mi | 3/2.0 | 1,219 (-14%) | 7mo | $80,000 | $66 | 42 |
Match score weights: distance 35% · size 25% · config 20% · recency 20%. Top-matched comps best support the ARV.
Projected returns pro-forma
-3.0% appreciation · 3.0% rent growth · sell at horizon
- IRR
- -4.6%
- Equity multiple
- 0.83×
- Total profit
- $-7,092
- Equity at exit
- $22,142
- IRR
- 5.2%
- Equity multiple
- 1.38×
- Total profit
- $15,946
- Equity at exit
- $12,840
Cash invested: $41,580 (down + closing). Projections, not guarantees.
Landlord ↔ Tenant lean methodology
- Overall (STATE)
- 62 Landlord-Friendly
- State Pennsylvania
- 62 Landlord-Friendly · EVEN
- County
- — inherits STATE
- City
- — inherits STATE
ZIP-level market 17078
- Home prices YoY
- -25.1%
- Active inventory
- 110
- Price-to-rent
- 7.0×
Monthly cashflow live
- Estimated rent
- $1,779 high interval (Pro) →
- Mortgage (P&I)
- −$779
- Tax from tax record
- −$300 /mo · $3,598/yr
- Insurance
- −$62
- HOA
- −$0
- Vacancy / Maint / Mgmt
- −$374
- Net cashflow
- $265
Break-even live
UW: 25.0% down · 7.5% · 30yr · 1.5% tax · 5.0% vac · 8.0% maint · 8.0% mgmt
Financing live
Cash to close
- Down payment
- $37,125
- Closing costs
- $4,455
- Reserves months
- —
- Total cash needed
- —
Loan-product check · same deal, 3 products live
Conventional
25% down · 7.5% · 30yr
- Down + closing
- —
- Monthly P&I
- —
- Monthly cashflow
- —
- DSCR
- —
- Eligible?
- —
Personal DTI + credit; lowest rate.
DSCR
20% down · 8.5% · 30yr
- Down + closing
- —
- Monthly P&I
- —
- Monthly cashflow
- —
- DSCR
- —
- Eligible?
- —
No personal income docs; deal must DSCR.
Hard money
10% down · 12.0% · 12mo
- Down + closing
- —
- Monthly P&I
- —
- Monthly cashflow
- —
- DSCR
- —
- Eligible?
- —
Short-term bridge; refi at stabilization.
Rent comps 10 comps
| Address | Beds | Baths | Sqft | Rent | $/sqft | DOM | Units | Dist |
|---|---|---|---|---|---|---|---|---|
| 45 N Penn St Palmyra, PA | 3.0 | 2.5 | 1750 | $2,300 | $1.31 | 43d | 1 | 0.63mi |
| 138 S Hetrick Ave Palmyra, PA | 3.0 | 1.5 | 1075 | $1,600 | $1.49 | 44d | 1 | 0.66mi |
| 822 W Main St Palmyra, PA | 3.0 | 1.0 | 1410 | $1,650 | $1.17 | 13d | 1 | 0.78mi |
| 506 S Franklin St Palmyra, PA | 2.0 | 1.0 | 1600 | $1,600 | $1.00 | 43d | 1 | 0.78mi |
| 933 E Maple St Palmyra, PA | 2.0 | 1.5 | 1404 | $1,800 | $1.28 | 43d | 1 | 0.96mi |
| 609 Cambridge Ct Palmyra, PA | 2.0 | 1.5 | 1208 | $1,895 | $1.57 | 13d | 1 | 1.19mi |
| 1805 Wexford Rd Palmyra, PA | 2.0 | 2.5 | 1564 | $1,900 | $1.21 | 23d | 1 | 1.27mi |
| 802 Cambridge Ct Palmyra, PA | 2.0 | 1.5 | 1208 | $1,700 | $1.41 | 43d | 1 | 1.29mi |
| 406 Barrington Ct Palmyra, PA | 2.0 | 1.5 | 1208 | $1,795 | $1.49 | 43d | 1 | 1.40mi |
| 1263 Jo Mar Ct Hershey, PA | 2.0 | 2.0 | 1056 | $1,195 | $1.13 | 43d | 1 | 1.49mi |
Listing history 2 events
-
2026-05-04$50,000 Active 671-char remark
-
1998-10-27soldstatus $109,900
ⓘ Source: listings_history table (triggers on properties + properties_extension) + one-shot
backfill from property_details.listing_events for pre-trigger history.
Tax reassessment forecast PA · Partial reset (capped growth)
- Current annual tax
- $3,598 · $300/mo
- Projected year-2 tax
- $3,598 · $300/mo
- Expected delta
- $0/yr ($0/mo · 0.0%)
ⓘ Screening estimate from a state-policy table — verify with the county assessor before closing.
Climate risk First Street
- Flood 1/10 Low FEMA zone X (unshaded) · 0% chance over 30 yrs
- Wildfire 3/10 Moderate
- Heat 5/10 Major 7 d/yr ≥101°F today · 15 d/yr by 30 yrs out
- Wind 3/10 Moderate 8% chance of damaging wind over 30 yrs
- Air quality 3/10 Moderate 3 unhealthy d/yr today · 5 by 30 yrs out
Nearby sold comps map
Loading sold comps map…
Walkable amenities ~0.75 mi
Loading nearby amenities…
Taxation est. · year 1
- Rental income
- $21,348
- − Mortgage interest
- −$8,318
- − Property taxes
- −$3,598
- − Insurance
- −$742
- − Repairs & maintenance
- −$1,708
- − Management
- −$1,708
- − Depreciation
- −$4,320
- Taxable income
- $953
- Est. tax owed @ 24.0%
- −$229
- After-tax cash flow
- $2,950/yr
For passive investors: Depreciation is non-cash, so a rental often shows a tax loss while cash-flowing — sheltering income. Rental losses are passive: they offset passive income freely, and up to $25,000/yr can offset ordinary (W-2) income if you actively participate and your MAGI is under $100k (phasing out to $0 by $150k); unused losses carry forward. On sale, claimed depreciation is recaptured at up to 25%, and gains may owe capital-gains tax (a 1031 exchange can defer both). Figures are a year-1 estimate at your 24.0% rate — not tax advice; consult a CPA.
Schools (NCES district)
- District
- Palmyra Area SD
- NCES district ID
- 4218390
- Math proficiency
- 52% ▼ -13.00%
- Reading proficiency
- 70% ▼ -10.00%
- Median HH income
- $60,526
- Composite
- 52.84/100
- National rank
- #1537
- State rank
- #63 of 539 in PA
Livability — Palmyra
- Score
- 79/100
- State rank
- #246
- US rank
- #2112
Category grades
Schools grade is shown separately in the Schools card above.
Census & demographics
- Census place
- Palmyra, PA
- County
- Lebanon County · 95,836 people
- City population
- 23,840
- Metro
- Lebanon, PA
- Population (ZIP)
- 23,840
- Household income
- $93,135
- Rent vs Own
- Severe rent burden
- 503.0
Population outlook (Lebanon County) Hauer SSP2
- Today (2025)
- 144,806 people
- By 2030
- 147,534 · +1.9%
- By 2040
- 152,952 · +5.6%
- By 2050
- 159,406 · +10.1%
- By 2075
- 181,736 · +25.5%
- By 2100
- 198,402 · +37.0%
Race, ethnicity, and origin ACS 2023
- Neighborhood character
- Predominantly White (85%)
- Race & ethnicity
- White 85% Hispanic / Latino 8% Two or more races 4% Asian 3% Black 1%
- Hispanic origin (detail)
- Puerto Rican 6%
- Common ancestry
- Romanian 3% Slovak 1% Serbian 1%
- Foreign-born
- 4% · India, Canada, South Korea
- Languages at home
- 92% English-only · Spanish 3% Other Indo-European 2% Russian/Polish/Slavic 1%
Political lean MEDSL · Lebanon
- 2024 margin
- Solid R (+32.0) · D 33.6% · R 65.5%
- 2008→2024 swing
- -13.1pp toward R · 2008: -18.9pp · 2024: -32.0pp
- All cycles
- 2024: R+32.0 2020: R+31.7 2016: R+35.5 2012: R+28.0 2008: R+18.9
Not yet ingested
- Civics
- —
Market trends
- HPI YoY
- ▼ -85.77%
- Current HPI
- 255.2294
- Rent YoY
- —
- Metro
- Lebanon, PA
- State GDP YoY
- ▲ 1.68%
- F500 in state
- 34
Industry mix (Fortune 500 HQ in PA)
| Industry | F500 HQs | Revenue |
|---|---|---|
| Healthcare | 2 | $309B |
|
||
| Insurance | 2 | $27B |
|
||
| Telecommunications / Media | 1 | $124B |
|
||
| Industrial Distribution | 1 | $22B |
|
||
| Financial Services | 1 | $20B |
|
||
| Chemicals / Materials | 1 | $18B |
|
||
Price history
+35.1% since first listed4 events — show timeline
- 2026-05-28 Price Changed $148,500 BRIGHT MLS
- 2026-05-28 Pending — BRIGHT MLS
- 2026-05-04 Listed $50,000 BRIGHT MLS
- 1998-10-27 Sold (Public Records) $109,900 Public Records
Property tax history
+4.4%/yrLatest (2026): $3,598 · +0.7% YoY. Source: county tax records.
Cash-flow waterfall
monthlySold comps — $/sqft
last 12 mo · ≤1 miLoading sold comps…