 Duplex
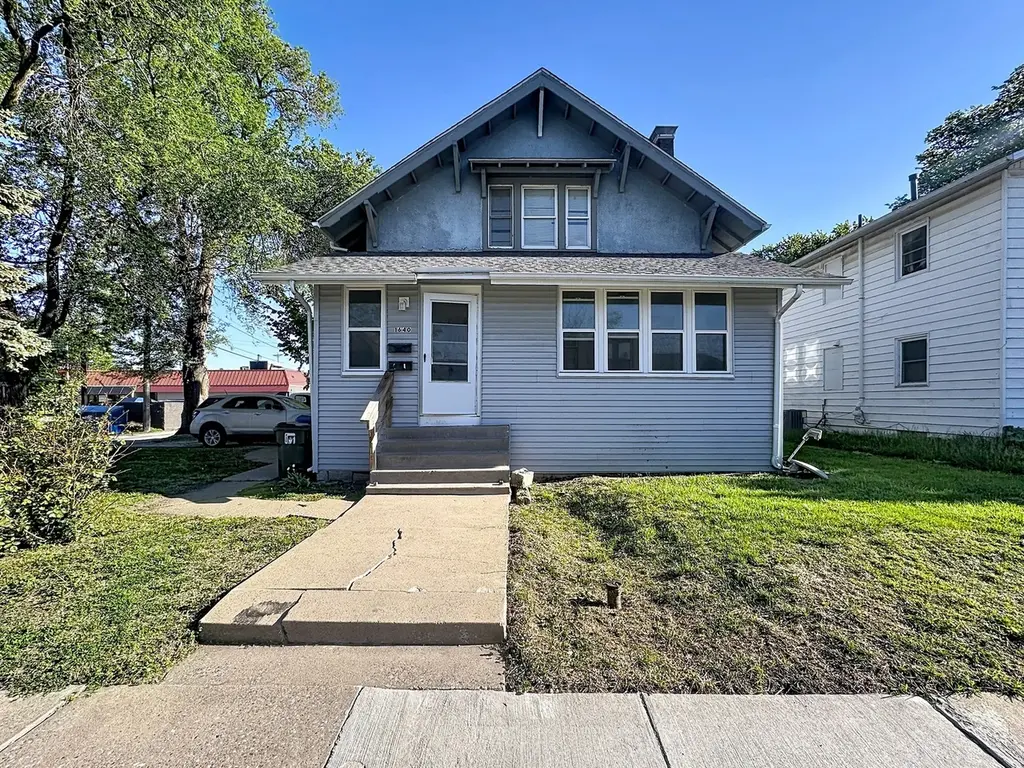
1640 W 17th St · Davenport, IA
Flood risk 1/10 · Minimal
- FEMA flood zone
- X (unshaded)
- Chance of flooding over 30 yrs
- 0.0%
- Est. flood insurance / yr
- $473 – $860
Fire risk 1/10 · Minimal
- Est. fire insurance / yr
- $902 – $1,676
Heat risk 3/10 · Minor
- Hot days now (above 103°F)
- 7 days/yr
- Hot days in 30 yrs
- 16 days/yr
Wind risk 2/10 · Minimal
- Chance of severe wind over 30 yrs
- —
Air-quality risk 3/10 · Minor
- Unhealthy air days now
- 2 days/yr
- Unhealthy air days in 30 yrs
- 3 days/yr
Risk factors via First Street. Map © Google.
Why this score? — see what drove the B- grade
The composite is a weighted blend of 9 inputs, each scored 0–100. Each bar is that input's sub-score; the figure is the points it added to the 100-point composite (weight × sub-score).
- Cash flow +28.6/30.0
- DSCR +10.0/10.0
- 1% rule +7.7/10.0
- Appreciation +5.0/10.0
- ARV discount +4.3/15.0
- Livability +4.0/5.0
- Schools +3.9/10.0
- Rent growth +2.5/5.0
- Condition / age +2.5/5.0
$139,900
🖨 Deal sheet 📄 Offer letter ✓ Due diligence
Multi-family units
County records classify this as Multi-Family (2-4 Unit). Listing-text estimate: 2 units. confirmed
Listing remarks MLS
4-bed, 2-bath duplex in Davenport offering strong rental history & significant recent updates. This up-and-down property features an enclosed front porch that serves as a shared foyer for both units. Unit 1, located on the main floor, includes a living room, dining room, kitchen, 2 bedrooms, & 1 full bathroom. Unit 2, located upstairs, offers a living room, kitchen, 2 bedrooms, & 1 full bathroom. The basement provides laundry hookups & additional space with potential for future finish. Each unit includes a dedicated 1-car parking pad off the side alley, along with additional street parking. Both units are tenant-occupied on month-to-month leases. Approximately $50,000 in renovations have been completed over the past 3 years, including 2 new furnaces, 2 new water heaters, a new roof, & a new front porch. A well-maintained investment opportunity with major mechanical updates already completed.
Key facts
- Shared foyer
- Laundry hookups
- Enclosed front porch
Tags
Neighborhood map
What this means for you Summary
Snapshot
- This is a 2 × 2-bed/1.0-bath units multifamily listed at $140k.
Deal economics
- At list price, monthly cash flow is $463 ($6k/yr) — positive. Per door: $232/mo.
- The deal already cash-flows at list — no discount required.
- Meets the 1% rule at list price ($2k rent vs $140k).
- Recommended offer: $123k (12.0% below list) — sets the bar for market timing.
- Cap rate 10.3% vs local median 4.4% in Davenport — top-decile yield for the area; either an underpriced asset or a hidden risk that comps aren't pricing in. Stress-test before assuming the spread holds.
Location & tenants
- Location reads 79/100 on livability (#126 in IA, #2,312 nationally) — a middle-class / working-renter tenant base. Strengths: cost of living A+, housing A+, health & safety A+; Watch: employment C-, crime F.
- Davenport Community School District (urban): math 43% / reading 50% proficiency, ranked #288 of 289 in IA (top 100%) — families likely to look elsewhere, expect single-tenant / working-renter base with shorter leases.
- Market conditions: 2 active listings in the ZIP; 11 comparable units currently listed for rent nearby; rentals lingering (median 44d on market — plan ~5-8 weeks vacancy on turnover, expect pricing pressure); 55% of comp listings sitting > 30 days — soft ceiling on asking rent; 805 units permitted in Scott County in 2024 (479 in 5+ unit buildings).
Forward outlook
- In year one you build about $5k of equity ($967 loan paydown + $4k appreciation (3.0% local appreciation)).
- Scott County population projected at +19% by 2050 — long-run rental-demand tailwind backs the buy-and-hold thesis.
- At projected returns (3.0% appreciation + 3.0% rent growth), your $39k cash investment doubles in ~4 years — after that, you're playing with house money.
- By year 7, paydown + projected appreciation supports a ~$33k cash-out refi (75% LTV) — recoverable capital for the next deal without selling this one.
Negotiation context
- It's been on market 125 days — a 12% lower offer ($123k) is reasonable based on typical stale-listing flexibility.
- 2 sale attempts since 21y ago with the ask held roughly flat each time — persistent listings suggest the price (not the market) is what's stuck; bring a comps-based counter.
- Current owner paid $76k; list at $140k implies a 84% gain — meaningful room to come down on a strong offer.
Risks & watch-outs
- Watch-outs: built in 1890 — expect roof / HVAC / electrical / plumbing capex.
Questions for the listing agent
- It's been on market 125 days. Have you received any prior offers? Is the seller open to a 12% concession, seller financing, or rate buy-down credit?
- Can we see the unit-by-unit rent roll, current vacancy, and any below-market leases? What's the average tenancy length?
- What capital expenditures (roof, boiler, parking lot, exteriors) have been made in the last 5 years, and what's planned in the next 2?
- Built in 1890 — when were the roof, HVAC, electrical panel, plumbing, and water heater last replaced?
- Why hasn't it sold? Are there any deal-killer items the seller is aware of (foundation, flood, title, zoning, code violations)?
- Is there a deadline driving the sale (1031 exchange, divorce, estate, relocation)? That informs how much negotiation room exists.
- Crime grade is F in this area — have there been break-ins, vandalism, or insurance claims at this property in the last 3 years? What carrier currently insures it and at what premium?
- What's the average days-on-market for RENTAL listings here right now (not sales)? A rising rental-DOM trend means longer vacancies and softer asking-rent achievability than the comps imply.
- What's the recent tenant-quality profile in this submarket — average credit score on applications, eviction rate, late-payment / NSF rate, and stable-employment percentage? A property-management company in the area should have these aggregated.
- How much new apartment / multifamily construction is in the pipeline within 1–3 miles? Heavy new supply (>2% of stock underway) typically softens rents 12–24 months out; light construction supports rent growth.
Investment metrics
- 1% rule
- 1.27% ✓
- Cap rate
- 10.27%
- Cash-on-cash
- 14.19%
- DSCR
- 1.63
- GRM
- 6.6
CMA / ARV
- ARV (median comp)
- $130,629
- List price
- $139,900
- Delta
- 7.10%
- Verdict
- FAIR
- Comps
- 20 within 1.0 mi
Projected returns pro-forma
3.0% appreciation · 3.0% rent growth · sell at horizon
- IRR
- 20.8%
- Equity multiple
- 2.18×
- Total profit
- $46,369
- Equity at exit
- $62,905
- IRR
- 21.9%
- Equity multiple
- 4.16×
- Total profit
- $123,753
- Equity at exit
- $96,944
Cash invested: $39,172 (down + closing). Projections, not guarantees.
Landlord ↔ Tenant lean methodology
- Overall (STATE)
- 83 Strongly Landlord-Friendly
- State Iowa
- 83 Strongly Landlord-Friendly · R+6
- County
- — inherits STATE
- City
- — inherits STATE
ZIP-level market 50804
- Active inventory
- 2
- Price-to-rent
- 13.1×
Monthly cashflow live
- Estimated rent
- $1,776 high interval (Pro) →
- Mortgage (P&I)
- −$734
- Tax from tax record
- −$148 /mo · $1,774/yr
- Insurance
- −$58
- HOA
- −$0
- Vacancy / Maint / Mgmt
- −$373
- Net cashflow
- $463
Break-even live
2-unit breakdown (identical units grouped — click to expand)
| Units | Beds | Baths | Est. rent |
|---|---|---|---|
| 2× units | 2 | 1 | $1,776 |
| #1 | 2 | 1 | $888 |
| #2 | 2 | 1 | $888 |
| Total (2 units) | $1,776 | ||
UW: 25.0% down · 7.5% · 30yr · 1.5% tax · 5.0% vac · 8.0% maint · 8.0% mgmt
Financing live
Cash to close
- Down payment
- $34,975
- Closing costs
- $4,197
- Reserves months
- —
- Total cash needed
- —
Loan-product check · same deal, 3 products live
Conventional
25% down · 7.5% · 30yr
- Down + closing
- —
- Monthly P&I
- —
- Monthly cashflow
- —
- DSCR
- —
- Eligible?
- —
Personal DTI + credit; lowest rate.
DSCR
20% down · 8.5% · 30yr
- Down + closing
- —
- Monthly P&I
- —
- Monthly cashflow
- —
- DSCR
- —
- Eligible?
- —
No personal income docs; deal must DSCR.
Hard money
10% down · 12.0% · 12mo
- Down + closing
- —
- Monthly P&I
- —
- Monthly cashflow
- —
- DSCR
- —
- Eligible?
- —
Short-term bridge; refi at stabilization.
Rent comps 11 comps
| Address | Beds | Baths | Sqft | Rent | $/sqft | DOM | Units | Dist |
|---|---|---|---|---|---|---|---|---|
| 1723 W Locust St Davenport, IA | 3.0 | 1.0 | 1690 | $1,395 | $0.83 | 43d | 1 | 0.14mi |
| 1716 W 7th St Davenport, IA | 4.0 | 1.0 | 1278 | $1,712 | $1.34 | 13d | 1 | 0.69mi |
| 915 W 14th St Davenport, IA | 3.0 | 1.0 | 1390 | $900 | $0.65 | 43d | 1 | 0.73mi |
| 1315 Brown St Unit 2 Davenport, IA | 3.0 | 1.0 | 1300 | $1,250 | $0.96 | 20d | 1 | 0.86mi |
| 621 W 15th St Davenport, IA | 4.0 | 2.0 | 1833 | $1,500 | $0.82 | 13d | 1 | 0.93mi |
| 1323 N Gaines St Davenport, IA | 4.0 | 2.0 | 1733 | $1,350 | $0.78 | 20d | 1 | 0.94mi |
| 537 W 16th St Davenport, IA | 3.0 | 1.0 | 1311 | $1,400 | $1.07 | 43d | 1 | 0.97mi |
| 1511 N Ripley St Davenport, IA | 4.0 | 2.0 | 1872 | $1,450 | $0.77 | 20d | 1 | 1.13mi |
| 1421 N Main St #2 Davenport, IA | 3.0 | 1.0 | 1350 | $1,095 | $0.81 | 43d | 1 | 1.29mi |
| 2424 Telegraph Rd Davenport, IA | 4.0 | 2.0 | 2000 | $1,750 | $0.88 | 43d | 1 | 1.34mi |
| 119 E 13th St Davenport, IA | 3.0 | 1.0 | 1728 | $1,495 | $0.87 | 43d | 1 | 1.42mi |
Listing history 37 events
-
2026-06-18days on market $139,900 Active 125 DOM
-
2026-06-17days on market $139,900 Active 124 DOM
-
2026-06-16days on market $139,900 Active 123 DOM
-
2026-06-15days on market $139,900 Active 122 DOM
-
2026-06-14days on market $139,900 Active 120 DOM
-
2026-06-13days on market $139,900 Active 119 DOM
-
2026-06-10days on market $139,900 Active 117 DOM
-
2026-06-09days on market $139,900 Active 116 DOM
-
2026-06-08days on market $139,900 Active 115 DOM
-
2026-06-07days on market $139,900 Active 114 DOM
-
2026-06-03days on market $139,900 Active 110 DOM
-
2026-06-02days on market $139,900 Active 109 DOM
-
2026-06-01days on market $139,900 Active 108 DOM
-
2026-05-31days on market $139,900 Active 107 DOM
-
2026-05-30days on market $139,900 Active 106 DOM
-
2026-02-12$139,900 Active 924-char remark
Show marketing remark (924 chars)
4-bed, 2-bath duplex in Davenport offering strong rental history & significant recent updates. This up-and-down property features an enclosed front porch that serves as a shared foyer for both units. Unit 1, located on the main floor, includes a living room, dining room, kitchen, 2 bedrooms, & 1 full bathroom. Unit 2, located upstairs, offers a living room, kitchen, 2 bedrooms, & 1 full bathroom. The basement provides laundry hookups & additional space with potential for future finish. Each unit includes a dedicated 1-car parking pad off the side alley, along with additional street parking. Both units are tenant-occupied on month-to-month leases. Approximately $50,000 in renovations have been completed over the past 3 years, including 2 new furnaces, 2 new water heaters, a new roof, & a new front porch. A well-maintained investment opportunity with major mechanical updates already completed.
-
2022-10-05historical
-
2022-10-05historical
-
2021-08-06historical
-
2021-08-06historical
-
2021-08-06historical
-
2021-08-06historical
-
2021-08-06historical
-
2021-08-06historical
-
2021-08-06historical
-
2021-08-06historical
-
2021-08-06historical
-
2010-10-15historical
-
2009-12-23historical
-
2008-11-06historical
-
2008-05-07historical
-
2007-07-03historical
-
2005-10-03soldstatus $75,900
-
2005-10-03soldstatus $75,900
-
2005-09-30soldstatus $75,900
-
2005-07-13$78,900
-
2001-10-05historical
ⓘ Source: listings_history table (triggers on properties + properties_extension) + one-shot
backfill from property_details.listing_events for pre-trigger history.
Tax reassessment forecast IA · Partial reset (capped growth)
- Current annual tax
- $1,774 · $148/mo
- Projected year-2 tax
- $1,985 · $165/mo
- Expected delta
- +$211/yr (+$18/mo · 11.9%)
ⓘ Screening estimate from a state-policy table — verify with the county assessor before closing.
Climate risk First Street
- Flood 1/10 Low FEMA zone X (unshaded) · 0% chance over 30 yrs
- Wildfire 1/10 Low
- Heat 3/10 Moderate 7 d/yr ≥103°F today · 16 d/yr by 30 yrs out
- Wind 2/10 Low
- Air quality 3/10 Moderate 2 unhealthy d/yr today · 3 by 30 yrs out
Nearby sold comps map
Loading sold comps map…
Walkable amenities ~0.75 mi
Loading nearby amenities…
Taxation est. · year 1
- Rental income
- $21,312
- − Mortgage interest
- −$7,837
- − Property taxes
- −$1,774
- − Insurance
- −$700
- − Repairs & maintenance
- −$1,705
- − Management
- −$1,705
- − Depreciation
- −$4,070
- Taxable income
- $3,522
- Est. tax owed @ 24.0%
- −$845
- After-tax cash flow
- $4,714/yr
For passive investors: Depreciation is non-cash, so a rental often shows a tax loss while cash-flowing — sheltering income. Rental losses are passive: they offset passive income freely, and up to $25,000/yr can offset ordinary (W-2) income if you actively participate and your MAGI is under $100k (phasing out to $0 by $150k); unused losses carry forward. On sale, claimed depreciation is recaptured at up to 25%, and gains may owe capital-gains tax (a 1031 exchange can defer both). Figures are a year-1 estimate at your 24.0% rate — not tax advice; consult a CPA.
Schools (NCES district)
- District
- Davenport Community School District
- NCES district ID
- 1908580
- Math proficiency
- 43% ▼ -11.00%
- Reading proficiency
- 50% ▼ -3.00%
- Median HH income
- $46,157
- Composite
- 39.49/100
- National rank
- #3951
- State rank
- #288 of 289 in IA
Livability — Davenport
- Score
- 79/100
- State rank
- #126
- US rank
- #2312
Category grades
Schools grade is shown separately in the Schools card above.
Census & demographics
- Census place
- Davenport, IA
Population outlook (Scott County) Hauer SSP2
- Today (2025)
- 188,878 people
- By 2030
- 196,648 · +4.1%
- By 2040
- 210,860 · +11.6%
- By 2050
- 224,359 · +18.8%
- By 2075
- 258,884 · +37.1%
- By 2100
- 286,447 · +51.7%
Not yet ingested
- Political lean
- —
- Race & ethnicity
- —
- Common origin
- —
- Civics
- —
Market trends
- HPI YoY
- —
- Current HPI
- —
- Rent YoY
- —
- Metro
- —
- State GDP YoY
- ▲ 2.48%
- F500 in state
- 4
Industry mix (Fortune 500 HQ in IA)
| Industry | F500 HQs | Revenue |
|---|---|---|
| Financial Services | 1 | $16B |
|
||
| Retail / Convenience | 1 | $15B |
|
||
Price history
+77.3% since first listed22 events — show timeline
- 2026-02-12 Listed $139,900 MRED as Distributed by MLS Grid
- 2022-10-05 Listing Removed — RMLSA as Distributed by MLS Grid
- 2022-10-05 Listing Removed — RMLSA as Distributed by MLS Grid
- 2021-08-06 Listing Removed — RMLSA as Distributed by MLS Grid
- 2021-08-06 Listing Removed — RMLSA as Distributed by MLS Grid
- 2021-08-06 Listing Removed — RMLSA as Distributed by MLS Grid
- 2021-08-06 Listing Removed — RMLSA as Distributed by MLS Grid
- 2021-08-06 Listing Removed — RMLSA as Distributed by MLS Grid
- 2021-08-06 Listing Removed — RMLSA as Distributed by MLS Grid
- 2021-08-06 Listing Removed — RMLSA as Distributed by MLS Grid
- 2021-08-06 Listing Removed — RMLSA as Distributed by MLS Grid
- 2021-08-06 Listing Removed — RMLSA as Distributed by MLS Grid
- 2010-10-15 Listing Removed — MRED as Distributed by MLS Grid
- 2009-12-23 Listing Removed — MRED as Distributed by MLS Grid
- 2008-11-06 Listing Removed — MRED as Distributed by MLS Grid
- 2008-05-07 Listing Removed — MRED as Distributed by MLS Grid
- 2007-07-03 Listing Removed — MRED as Distributed by MLS Grid
- 2005-10-03 Sold (Public Records) $75,900 Public Records
- 2005-10-03 Sold (Public Records) $75,900 Public Records
- 2005-09-30 Sold (MLS) $75,900 RMLSA as Distributed by MLS Grid
- 2005-07-13 Listed $78,900 RMLSA as Distributed by MLS Grid
- 2001-10-05 Listing Removed — MRED as Distributed by MLS Grid
Property tax history
+0.4%/yrLatest (2025): $1,774 · -11.3% YoY. Source: county tax records.
Cash-flow waterfall
monthlySold comps — $/sqft
last 12 mo · ≤1 miLoading sold comps…