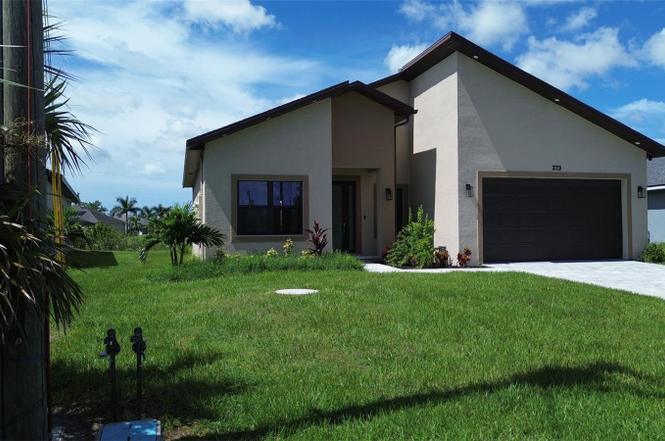
273 Antis Dr · Rotonda, FL
Flood risk 8/10 · Major
- FEMA flood zone
- AE
- Chance of flooding over 30 yrs
- 0.98%
- Est. flood insurance / yr
- $1,737 – $8,500
Fire risk 1/10 · Minimal
- Est. fire insurance / yr
- $947 – $1,759
Heat risk 10/10 · Severe
- Hot days now (above 107°F)
- 7 days/yr
- Hot days in 30 yrs
- 29 days/yr
Wind risk 10/10 · Severe
- Chance of severe wind over 30 yrs
- 99.0%
Air-quality risk 2/10 · Minimal
- Unhealthy air days now
- 1 days/yr
- Unhealthy air days in 30 yrs
- 1 days/yr
Risk factors via First Street. Map © Google.
Why this score? — see what drove the F grade
The composite is a weighted blend of 9 inputs, each scored 0–100. Each bar is that input's sub-score; the figure is the points it added to the 100-point composite (weight × sub-score).
- ARV discount +7.5/15.0
- Cash flow +5.9/30.0
- Appreciation +5.6/10.0
- Schools +4.6/10.0
- Livability +3.4/5.0
- Condition / age +2.5/5.0
- Rent growth +2.4/5.0
- 1% rule +1.3/10.0
- DSCR +0.3/10.0
$384,900
🖨 Deal sheet 📄 Offer letter ✓ Due diligence
Listing remarks
NEW CONSTRUCTION with POND VIEWS & IMPACT WINDOWS! Discover modern coastal living in this BRAND NEW-MOVE IN READY 3-bedroom, 2-bath home located at Rotonda Lakes community. This beautifully designed residence offers almost 10 foot ceilings, open-concept layout filled with natural light and IMPACT WINDOWS and Doors, Luxury patio door with 3 panels and full opening. Luxury tall interior doors. . The gourmet kitchen features premium cabinetry, stone countertops, stainless steel appliances, and a spacious island. The owner’s suite includes a luxurious en-suite bath with dual vanities and a walk-in shower , while two additional bedrooms provide flexible living options. Situated on
Key facts
- Stone countertops
- Gourmet kitchen
- Pond views
Tags
Property features AI
Finance
- Other: Lot about 0.18 acres (approx. 0.18 acres); Paved road access; Living area ~1,590 sq ft (builder); Total building area ~2,300 sq ft (builder); Direction faces north
- HOA & community: Has HOA (Sara) — annual fee $120 (monthly equivalent $10); association approval required; Deed restrictions; Dog park; Golf carts allowed; Golf; Park; Playground; Pets allowed (cats and dogs)
Exterior
- Parking: 2-car garage
- Utilities: Canal/lake for irrigation water source; Public sewer; Cable available; Electricity connected; Sewer connected; Water connected
- Home design: Single family residence; One story; New construction; North-facing
- Construction: Block and concrete construction; Shingle roof; Slab foundation; Built by Moio Homes Construction LLC (Verenice model)
- Exterior features: Rain gutters; Sliding doors; Pond view
Interior
- Kitchen: Dishwasher; Disposal; Microwave; Range; Refrigerator
- Bedrooms: 3 bedrooms
- Bathrooms: 2 full bathrooms
- Heating & cooling: Central heating; Central air conditioning
- Interior features: Ceiling fans; High ceilings; Kitchen/family room combo; Open floorplan; Thermostat; Walk-in closets; Window treatments
- Laundry & utility: Dedicated laundry room; Electric water heater
Neighborhood map
What this means for you Summary
Snapshot
- This is a 3-bed/2.0-bath land listed at $385k.
Deal economics
- At list price, monthly cash flow is $-1k ($-14k/yr) — negative.
- To cash-flow at today's rent, offer at most $214k (44.3% below list).
- To meet the 1% rule (rent ≥ 1% of price), the offer needs to be $243k (37.0% below list).
- Recommended offer: $214k (44.3% below list) — sets the bar for cash-flow.
- Cap rate 3.9% vs local median 3.1% in Rotonda — meaningfully above typical; check what's discounted (condition, days-on-market, listing class) to confirm the premium yield is real.
Location & tenants
- Location reads 67/100 on livability (#548 in FL) — a middle-class / working-renter tenant base. Strengths: crime A+, housing A-, cost of living B+; Watch: schools D, amenities F, commute F.
- Charlotte (suburban): math 54% / reading 54% proficiency, ranked #22 of 73 in FL (top 30%) — acceptable for families but not a draw, mixed tenant base, ~2y average lease.
- Market conditions: Rents soft (-0.2%/yr); 863 active listings in the ZIP; 40 comparable units currently listed for rent nearby; rentals at typical pace (median 21d on market — plan ~3-4 weeks tenant-placement turnaround); solid renter incomes; 4,585 units permitted in Charlotte County in 2024 (703 in 5+ unit buildings).
- This rent runs 36% of the median local income ($80k/yr) — at the standard rent-burdened threshold; future hikes will face affordability resistance.
Forward outlook
- In year one you build about $7k of equity ($3k loan paydown + $5k appreciation (1.2% local appreciation)).
- Charlotte County population projected at +24% by 2050 — long-run rental-demand tailwind backs the buy-and-hold thesis.
- By year 5, paydown + projected appreciation supports a ~$34k cash-out refi (75% LTV) — recoverable capital for the next deal without selling this one.
Negotiation context
- It's been on market 273 days — a 12% lower offer ($339k) is reasonable based on typical stale-listing flexibility.
- 3 sale attempts since 11y ago with the ask held roughly flat each time — persistent listings suggest the price (not the market) is what's stuck; bring a comps-based counter.
- Current owner paid $34k; list at $385k implies a 1032% gain — meaningful room to come down on a strong offer.
Risks & watch-outs
- Watch-outs: flood insurance adds $427/mo.
- Climate carrying-cost: in FEMA flood zone AE (mandatory federal flood insurance); severe wind risk, 99% chance of damaging wind over 30y; extreme-heat days projected 7→29/yr by 2055 (HVAC capex compounding) — expect insurance premiums to compound above CPI over the hold.
Questions for the listing agent
- What do current leases actually rent for vs. the listed asking? Can we see a recent rent roll and the last 12 months of T-12 income?
- It's been on market 273 days. Have you received any prior offers? Is the seller open to a 44% concession, seller financing, or rate buy-down credit?
- What's the actual annual flood-insurance premium (NFIP or private), and is the property in a SFHA with mandatory coverage?
- What does the HOA fee cover, when was the last increase, and are there any pending special assessments or reserve-fund shortfalls?
- Why hasn't it sold? Are there any deal-killer items the seller is aware of (foundation, flood, title, zoning, code violations)?
- Is there a deadline driving the sale (1031 exchange, divorce, estate, relocation)? That informs how much negotiation room exists.
- Schools are D-rated, which usually means shorter tenancies and higher turnover. Who's the typical renter profile here, and what's been the actual vacancy rate?
- The area grade is low — what's the realistic commute time and amenity access for the typical tenant pool here? Any planned neighborhood developments (good or bad) we should know about?
- What's the average days-on-market for RENTAL listings here right now (not sales)? A rising rental-DOM trend means longer vacancies and softer asking-rent achievability than the comps imply.
- What's the recent tenant-quality profile in this submarket — average credit score on applications, eviction rate, late-payment / NSF rate, and stable-employment percentage? A property-management company in the area should have these aggregated.
- How much new for-sale + rental construction is in the pipeline within 1–3 miles? Heavy new supply typically softens prices + rents 12–24 months out; constrained supply supports both.
Investment metrics
- 1% rule
- 0.63% ✗
- Cap rate
- 3.95%
- Cash-on-cash
- -8.38%
- DSCR
- 0.63
- GRM
- 13.2
CMA / ARV
No comps found within radius.
Projected returns pro-forma
1.25% appreciation · 0.0% rent growth · sell at horizon
- IRR
- -12.9%
- Equity multiple
- 0.35×
- Total profit
- $-70,006
- Equity at exit
- $136,430
- IRR
- -8.1%
- Equity multiple
- 0.02×
- Total profit
- $-105,777
- Equity at exit
- $185,260
Cash invested: $107,772 (down + closing). Projections, not guarantees.
Landlord ↔ Tenant lean methodology
- Overall (STATE)
- 87 Strongly Landlord-Friendly
- State Florida
- 87 Strongly Landlord-Friendly · R+3
- County
- — inherits STATE
- City
- — inherits STATE
ZIP-level market 33947
- Home prices YoY
- 0.4%
- Rents YoY
- -0.2%
- Active inventory
- 863
- Price-to-rent
- 13.2×
Monthly cashflow live
- Estimated rent
- $2,426 high interval (Pro) →
- Mortgage (P&I)
- −$2,018
- Tax est. 1.5%
- −$481 /mo · $5,774/yr
- Insurance
- −$160
- Flood insurance flood zone
- −$427 /mo · $5,118/yr
- HOA
- −$10
- Vacancy / Maint / Mgmt
- −$510
- Net cashflow
- $-1,180
Break-even live
UW: 25.0% down · 7.5% · 30yr · 1.5% tax · 5.0% vac · 8.0% maint · 8.0% mgmt
Financing live
Cash to close
- Down payment
- $96,225
- Closing costs
- $11,547
- Reserves months
- —
- Total cash needed
- —
Loan-product check · same deal, 3 products live
Conventional
25% down · 7.5% · 30yr
- Down + closing
- —
- Monthly P&I
- —
- Monthly cashflow
- —
- DSCR
- —
- Eligible?
- —
Personal DTI + credit; lowest rate.
DSCR
20% down · 8.5% · 30yr
- Down + closing
- —
- Monthly P&I
- —
- Monthly cashflow
- —
- DSCR
- —
- Eligible?
- —
No personal income docs; deal must DSCR.
Hard money
10% down · 12.0% · 12mo
- Down + closing
- —
- Monthly P&I
- —
- Monthly cashflow
- —
- DSCR
- —
- Eligible?
- —
Short-term bridge; refi at stabilization.
Rent comps 40 comps
| Address | Beds | Baths | Sqft | Rent | $/sqft | DOM | Units | Dist |
|---|---|---|---|---|---|---|---|---|
| 289 Antis Dr Rotonda West, FL | 3.0 | 2.0 | 1648 | $2,150 | $1.30 | 21d | 1 | 0.13mi |
| 138 Jade St Rotonda West, FL | 3.0 | 2.0 | 1564 | $1,869 | $1.20 | 21d | 1 | 0.42mi |
| 108 Boxwood Ln Rotonda West, FL | 3.0 | 2.0 | 1647 | $1,775 | $1.08 | 13d | 1 | 0.46mi |
| 48 Par View Ct Rotonda West, FL | 3.0 | 2.0 | 2000 | $3,500 | $1.75 | 21d | 1 | 0.47mi |
| 108 Crevalle Rd Rotonda West, FL | 3.0 | 2.0 | 1946 | $3,000 | $1.54 | 21d | 1 | 0.66mi |
| 358 Albatross Rd Rotonda West, FL | 4.0 | 2.0 | 1664 | $2,100 | $1.26 | 21d | 1 | 0.71mi |
| 72 Long Meadow Ct Rotonda West, FL | 3.0 | 2.0 | 1570 | $5,200 | $3.31 | 21d | 1 | 0.71mi |
| 72 Long Meadow Ln Rotonda West, FL | 3.0 | 2.0 | 1945 | $1,920 | $0.99 | 13d | 1 | 0.78mi |
| 9550 Fiddlers Green Cir #105 Rotonda West, FL | 2.0 | 2.0 | 1230 | $2,900 | $2.36 | 21d | 1 | 0.79mi |
| 135 David Blvd Rotonda West, FL | 3.0 | 2.0 | 1880 | $2,695 | $1.43 | 13d | 1 | 0.79mi |
| 203 Wright Dr Rotonda West, FL | 4.0 | 3.0 | 2092 | $2,400 | $1.15 | 21d | 1 | 0.82mi |
| 431 Albatross Rd Rotonda West, FL | 2.0 | 2.0 | 1857 | $4,800 | $2.58 | 21d | 1 | 0.95mi |
| 12114 Clarendon Ave Port Charlotte, FL | 3.0 | 2.0 | 1270 | $2,400 | $1.89 | 21d | 1 | 0.98mi |
| 9195 Agate St Port Charlotte, FL | 3.0 | 2.0 | 1200 | $1,650 | $1.38 | 13d | 1 | 1.03mi |
| 9163 Agate St Unit 9163 Port Charlotte, FL | 3.0 | 2.0 | 1379 | $1,747 | $1.27 | 21d | 1 | 1.03mi |
| 9163 Agate St Unit 9165 Port Charlotte, FL | 3.0 | 2.0 | 1379 | $1,697 | $1.23 | 21d | 1 | 1.03mi |
| 9251 Agate St Port Charlotte, FL | 3.0 | 2.0 | 1237 | $1,565 | $1.27 | 21d | 1 | 1.04mi |
| 9156 Agate St Unit 9156 Port Charlotte, FL | 3.0 | 2.0 | 1379 | $1,747 | $1.27 | 21d | 1 | 1.06mi |
| 9116 Agate St #9118 Port Charlotte, FL | 3.0 | 2.0 | 1429 | $1,750 | $1.22 | 21d | 1 | 1.07mi |
| 9317 Agate St Unit 9317 Port Charlotte, FL | 3.0 | 2.0 | 1379 | $1,747 | $1.27 | 21d | 1 | 1.08mi |
| 123 Marker Rd Rotonda West, FL | 3.0 | 2.0 | 2006 | $2,400 | $1.20 | 13d | 1 | 1.10mi |
| 8519 Agate St Unit 8521 Port Charlotte, FL | 3.0 | 2.0 | 1379 | $1,697 | $1.23 | 21d | 1 | 1.16mi |
| 8479 Agate St Port Charlotte, FL | 3.0 | 2.0 | 1379 | $2,495 | $1.81 | 21d | 1 | 1.19mi |
| 155 Long Meadow Ln Rotonda West, FL | 3.0 | 2.0 | 1598 | $4,500 | $2.82 | 21d | 1 | 1.21mi |
| 9400 Agate St Pt Charlotte, FL | 3.0 | 2.0 | 1429 | $1,795 | $1.26 | 21d | 1 | 1.21mi |
| 12 Broadmoor Rd Unit 1 Rotonda West, FL | 3.0 | 2.0 | 2065 | $3,500 | $1.69 | 21d | 1 | 1.21mi |
| 107 Cottage Pl Rotonda West, FL | 3.0 | 2.0 | 1397 | $5,000 | $3.58 | 21d | 1 | 1.21mi |
| 9425 Agate St Unit 9425 Port Charlotte, FL | 3.0 | 2.0 | 1379 | $1,700 | $1.23 | 21d | 1 | 1.22mi |
| 13180 Amaryllis Cir Port Charlotte, FL | 3.0 | 2.0 | 1704 | $2,950 | $1.73 | 13d | 1 | 1.22mi |
| 127 White Marsh Ln Rotonda West, FL | 3.0 | 2.0 | 2216 | $2,700 | $1.22 | 21d | 1 | 1.24mi |
| 8373 Agate St Unit 8375 Port Charlotte, FL | 3.0 | 2.0 | 1379 | $1,747 | $1.27 | 21d | 1 | 1.31mi |
| 589 Rotonda Cir Rotonda West, FL | 3.0 | 2.5 | 2190 | $4,200 | $1.92 | 21d | 1 | 1.32mi |
| 13376 Yager Ln Port Charlotte, FL | 3.0 | 2.0 | 2002 | $3,500 | $1.75 | 13d | 1 | 1.33mi |
| 10026 Cocoa Beach St Unit 10026 Port Charlotte, FL | 3.0 | 2.0 | 1677 | $1,650 | $0.98 | 13d | 1 | 1.39mi |
| 8249 Dimstead St Port Charlotte, FL | 3.0 | 2.0 | 1202 | $1,675 | $1.39 | 21d | 1 | 1.40mi |
| 114 Albatross Rd Rotonda West, FL | 3.0 | 2.0 | 1648 | $5,300 | $3.22 | 21d | 1 | 1.43mi |
| 10037 Amicola St Port Charlotte, FL | 3.0 | 2.0 | 1300 | $1,650 | $1.27 | 21d | 1 | 1.48mi |
| 10045 Amicola St Port Charlotte, FL | 3.0 | 2.0 | 1162 | $1,650 | $1.42 | 21d | 1 | 1.49mi |
| 10047 Amicola St Port Charlotte, FL | 3.0 | 2.0 | 1162 | $1,650 | $1.42 | 21d | 1 | 1.49mi |
| 7352 Bolten Ln Port Charlotte, FL | 3.0 | 2.0 | 1225 | $2,319 | $1.89 | 13d | 1 | 1.49mi |
HOA detail
- Monthly dues
- $10 · $120/yr
Listing history 20 events
-
2026-06-18days on market $384,900 Active 273 DOM
-
2026-06-17days on market $384,900 Active 272 DOM
-
2026-06-16days on market $384,900 Active 271 DOM
-
2026-06-15days on market $384,900 Active 270 DOM
-
2026-06-14days on market $384,900 Active 268 DOM
-
2026-06-13days on market $384,900 Active 267 DOM
-
2026-06-10days on market $384,900 Active 265 DOM
-
2026-06-09days on market $384,900 Active 264 DOM
-
2026-05-31days on market $384,900 Active 263 DOM
-
2026-05-30days on market $384,900 Active 262 DOM
-
2026-04-16price $384,900
-
2026-01-06status Active
-
2026-01-06price $398,000
-
2026-01-04historical
-
2025-09-16price $419,000
-
2025-09-08$399,000 Active
-
2023-06-14soldstatus $34,000
-
2015-01-17historical
-
2015-01-07$19,500 Active
-
2004-01-16soldstatus $15,000
ⓘ Source: listings_history table (triggers on properties + properties_extension) + one-shot
backfill from property_details.listing_events for pre-trigger history.
Climate risk First Street
- Flood 8/10 Severe FEMA zone AE · 98% chance over 30 yrs
- Wildfire 1/10 Low
- Heat 10/10 Extreme 7 d/yr ≥107°F today · 29 d/yr by 30 yrs out
- Wind 10/10 Extreme 99% chance of damaging wind over 30 yrs
- Air quality 2/10 Low 1 unhealthy d/yr today · 1 by 30 yrs out
Nearby sold comps map
Loading sold comps map…
Walkable amenities ~0.75 mi
Loading nearby amenities…
Taxation est. · year 1
- Rental income
- $29,118
- − Mortgage interest
- −$21,560
- − Property taxes
- −$5,774
- − Insurance
- −$7,043
- − Repairs & maintenance
- −$2,329
- − Management
- −$2,329
- − HOA
- −$120
- − Depreciation
- −$11,197
- Taxable loss
- −$21,235
- Est. tax savings @ 24.0%
- +$5,096
- After-tax cash flow
- $-9,058/yr
For passive investors: Depreciation is non-cash, so a rental often shows a tax loss while cash-flowing — sheltering income. Rental losses are passive: they offset passive income freely, and up to $25,000/yr can offset ordinary (W-2) income if you actively participate and your MAGI is under $100k (phasing out to $0 by $150k); unused losses carry forward. On sale, claimed depreciation is recaptured at up to 25%, and gains may owe capital-gains tax (a 1031 exchange can defer both). Figures are a year-1 estimate at your 24.0% rate — not tax advice; consult a CPA.
Schools (NCES district)
- District
- Charlotte
- NCES district ID
- 1200240
- Math proficiency
- 54% ▼ -6.00%
- Reading proficiency
- 54% ▼ -1.00%
- Median HH income
- $44,864
- Composite
- 45.62/100
- National rank
- #2586
- State rank
- #22 of 73 in FL
Livability — Rotonda
- Score
- 67/100
- State rank
- #548
- US rank
- #10359
Category grades
Schools grade is shown separately in the Schools card above.
Census & demographics
- County
- Charlotte County · 196,994 people
- City population
- 10,490
- Metro
- Punta Gorda, FL
- Population (ZIP)
- 10,447
- Household income
- $80,091
- Rent vs Own
- Severe rent burden
- 91.0
Population outlook (Charlotte County) Hauer SSP2
- Today (2025)
- 198,646 people
- By 2030
- 210,507 · +6.0%
- By 2040
- 230,857 · +16.2%
- By 2050
- 247,148 · +24.4%
- By 2075
- 281,777 · +41.8%
- By 2100
- 293,609 · +47.8%
Race, ethnicity, and origin ACS 2023
- Neighborhood character
- Predominantly White (96%)
- Race & ethnicity
- White 96% Hispanic / Latino 2% Two or more races 2%
- Common ancestry
- Romanian 5% Lithuanian 4% Slovak 4%
- Foreign-born
- 8% · Canada, Vietnam
- Languages at home
- 93% English-only · Russian/Polish/Slavic 3% Spanish 2% German/W. Germanic 1%
Political lean MEDSL · Charlotte
- 2024 margin
- Solid R (+34.0) · D 32.7% · R 66.7%
- 2008→2024 swing
- -26.7pp toward R · 2008: -7.2pp · 2024: -34.0pp
- All cycles
- 2024: R+34.0 2020: R+26.6 2016: R+27.8 2012: R+14.3 2008: R+7.2
Not yet ingested
- Civics
- —
Market trends
- HPI YoY
- ▲ 1.25%
- Current HPI
- 311.3231
- Rent YoY
- ▼ -0.22%
- Metro
- Punta Gorda, FL
- State GDP YoY
- ▲ 3.28%
- F500 in state
- 36
Industry mix (Fortune 500 HQ in FL)
| Industry | F500 HQs | Revenue |
|---|---|---|
| Industrial Technology | 2 | $29B |
|
||
| Insurance | 2 | $17B |
|
||
| Retail | 1 | $60B |
|
||
| Technology Distribution | 1 | $58B |
|
||
| Homebuilding | 1 | $35B |
|
||
| Technology Manufacturing | 1 | $35B |
|
||
Price history
+2466.0% since first listed10 events — show timeline
- 2026-04-16 Price Changed $384,900 Stellar MLS as Distributed by MLS Grid
- 2026-01-06 Relisted — Stellar MLS as Distributed by MLS Grid
- 2026-01-06 Price Changed $398,000 Stellar MLS as Distributed by MLS Grid
- 2026-01-04 Listing Removed — Stellar MLS as Distributed by MLS Grid
- 2025-09-16 Price Changed $419,000 Stellar MLS as Distributed by MLS Grid
- 2025-09-08 Listed $399,000 Stellar MLS as Distributed by MLS Grid
- 2023-06-14 Sold (Public Records) $34,000 Public Records
- 2015-01-17 Listing Removed — FORTMLS
- 2015-01-07 Listed $19,500 FORTMLS
- 2004-01-16 Sold (Public Records) $15,000 Public Records
Property tax history
+5.8%/yrLatest (2025): $611 · +0.7% YoY. Source: county tax records.
Cash-flow waterfall
monthlySold comps — $/sqft
last 12 mo · ≤1 miLoading sold comps…