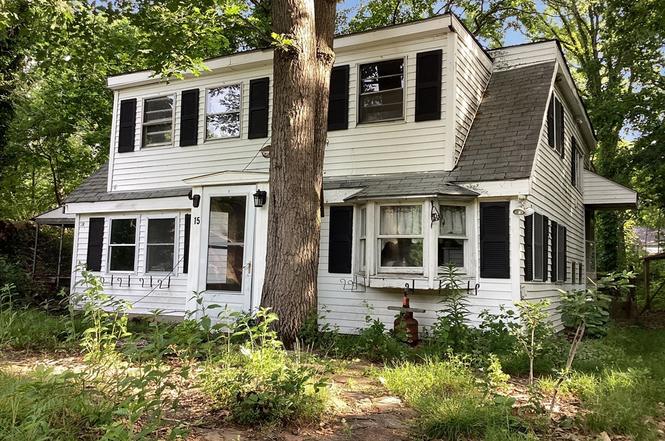
15 Campus Rd · Attleboro, MA
Flood risk 1/10 · Minimal
- FEMA flood zone
- X (unshaded)
- Chance of flooding over 30 yrs
- 0.0%
- Est. flood insurance / yr
- $507 – $1,088
Fire risk 1/10 · Minimal
- Est. fire insurance / yr
- $915 – $1,699
Heat risk 5/10 · Moderate
- Hot days now (above 97°F)
- 7 days/yr
- Hot days in 30 yrs
- 14 days/yr
Wind risk 6/10 · Moderate
- Chance of severe wind over 30 yrs
- 68.0%
Air-quality risk 2/10 · Minimal
- Unhealthy air days now
- 1 days/yr
- Unhealthy air days in 30 yrs
- 2 days/yr
Risk factors via First Street. Map © Google.
Why this score? — see what drove the C- grade
The composite is a weighted blend of 9 inputs, each scored 0–100. Each bar is that input's sub-score; the figure is the points it added to the 100-point composite (weight × sub-score).
- Cash flow +20.9/30.0
- ARV discount +7.5/15.0
- DSCR +6.7/10.0
- 1% rule +5.7/10.0
- Rent growth +3.8/5.0
- Schools +3.6/10.0
- Livability +3.4/5.0
- Condition / age +2.5/5.0
- Appreciation +0.0/10.0
$201,000
🖨 Deal sheet 📄 Offer letter ✓ Due diligence
Listing remarks
New Listing on corner lot in convenient location with great highway access! Offers will be entertained after property has been exposed on the MLS for 7 Calendar days.
Key facts
- 5,125 sq ft lot
- Parking
- Built 1935
Property features AI
Finance
- HOA & community: Not a senior community
Exterior
- Parking: 1 open parking space
- Utilities: Public water; Public sewer; Electric with circuit breakers
- Home design: Single-family residence; One story (entry level information not specified)
- Construction: Built in public-record year (actual); Frame construction; Stone foundation; Shingle roof
- Exterior features: Corner lot
Interior
- Kitchen: Water heater (listed under appliances)
- Bathrooms: 1 full bathroom
- Heating & cooling: Central heating
- Interior features: 5 total rooms; Walk-out basement access
Neighborhood map
What this means for you Summary
Snapshot
- This is a 2-bed/1.0-bath single-family listed at $201k.
Deal economics
- At list price, monthly cash flow is $280 ($3k/yr) — positive.
- The deal already cash-flows at list — no discount required.
- Meets the 1% rule at list price ($2k rent vs $201k).
- Cap rate 8.0% vs local median 3.1% in Attleboro — top-decile yield for the area; either an underpriced asset or a hidden risk that comps aren't pricing in. Stress-test before assuming the spread holds.
Location & tenants
- Location reads 67/100 on livability (#165 in MA) — a middle-class / working-renter tenant base. Strengths: commute A+, employment A+, housing A+; Watch: amenities F, cost of living F, health & safety F.
- Attleboro (suburban): math 34% / reading 46% proficiency, ranked #194 of 302 in MA (top 64%) — families likely to look elsewhere, expect single-tenant / working-renter base with shorter leases.
- Market conditions: Rents rising fast (+5.3%/yr); 54 active listings in the ZIP; 1 comparable units currently listed for rent nearby; solid renter incomes; 760 units permitted in Bristol County in 2024 (142 in 5+ unit buildings).
Forward outlook
- Local home prices are declining (-3.0%/yr); year-one equity from $1k of loan paydown is wiped out by about $6k of value loss. Plan a longer hold.
- Bristol County population projected to shrink 3% by 2050 — rents likely to lag national; underwrite the cash flow, not the appreciation.
Negotiation context
- Only 8 days on market — expect competitive offers; lowballing is unlikely to land.
Risks & watch-outs
- Watch-outs: built in 1935 — expect roof / HVAC / electrical / plumbing capex.
- Climate carrying-cost: major wind risk, 68% chance of damaging wind over 30y; extreme-heat days projected 7→14/yr by 2055 (HVAC capex compounding) — expect insurance premiums to compound above CPI over the hold.
Questions for the listing agent
- Built in 1935 — when were the roof, HVAC, electrical panel, plumbing, and water heater last replaced?
- Is there a deadline driving the sale (1031 exchange, divorce, estate, relocation)? That informs how much negotiation room exists.
- What's the average days-on-market for RENTAL listings here right now (not sales)? A rising rental-DOM trend means longer vacancies and softer asking-rent achievability than the comps imply.
- What's the recent tenant-quality profile in this submarket — average credit score on applications, eviction rate, late-payment / NSF rate, and stable-employment percentage? A property-management company in the area should have these aggregated.
- How much new for-sale + rental construction is in the pipeline within 1–3 miles? Heavy new supply typically softens prices + rents 12–24 months out; constrained supply supports both.
Investment metrics
- 1% rule
- 1.07% ✓
- Cap rate
- 7.97%
- Cash-on-cash
- 5.98%
- DSCR
- 1.27
- GRM
- 7.8
CMA / ARV
- ARV (on-the-fly)
- $568,832
- Comps found
- 12
Show comp detail 12 sales within ~0.75 mi
| Address | Dist | Beds/Ba | Sqft | Sold | Price | $/sf | Match |
|---|---|---|---|---|---|---|---|
| 48 May St | 0.32mi | 3/1.5 (+1) | 1,631 (+1%) | 9mo | $495,000 | $303 | 69 |
| 155 May St | 0.32mi | 3/2.0 (+1) | 1,646 (+2%) | 6mo | $640,000 | $389 | 68 |
| 23 Cumberland Ave | 0.41mi | 3/1.5 (+1) | 1,550 (-4%) | 6mo | $515,000 | $332 | 62 |
| 412 Newport Ave | 0.54mi | 3/1.0 (+1) | 1,632 (+1%) | 9mo | $450,000 | $276 | 61 |
| 82 Cumberland Ave | 0.39mi | 3/1.5 (+1) | 1,450 (-10%) | 3mo | $510,000 | $352 | 55 |
| 27 Killarney Way | 0.42mi | 3/2.5 (+1) | 1,728 (+7%) | 5mo | $675,000 | $391 | 54 |
| 18 Haduk Dr | 0.61mi | 3/2.0 (+1) | 1,706 (+6%) | 1mo | $675,000 | $396 | 53 |
| 295 Newport Ave | 0.63mi | 3/1.0 (+1) | 1,724 (+7%) | 5mo | $499,900 | $290 | 50 |
| 5 Haduk Dr | 0.57mi | 3/1.5 (+1) | 1,652 (+2%) | 19mo | $600,000 | $363 | 47 |
| 48 Ellendale Rd | 0.66mi | 3/1.0 (+1) | 1,697 (+5%) | 13mo | $485,000 | $286 | 45 |
| 35 Old Stagecoach Rd | 0.74mi | 3/2.5 (+1) | 1,641 (+2%) | 14mo | $675,000 | $411 | 41 |
| 49 Zachary Ln | 0.71mi | 3/1.5 (+1) | 1,800 (+11%) | 15mo | $590,000 | $328 | 28 |
Match score weights: distance 35% · size 25% · config 20% · recency 20%. Top-matched comps best support the ARV.
Projected returns pro-forma
-3.0% appreciation · 5.3% rent growth · sell at horizon
- IRR
- -4.4%
- Equity multiple
- 0.83×
- Total profit
- $-9,581
- Equity at exit
- $29,970
- IRR
- 7.8%
- Equity multiple
- 1.65×
- Total profit
- $36,734
- Equity at exit
- $17,379
Cash invested: $56,280 (down + closing). Projections, not guarantees.
Landlord ↔ Tenant lean methodology
- Overall (STATE)
- 20 Strongly Tenant-Friendly
- State Massachusetts
- 20 Strongly Tenant-Friendly · D+15
- County
- — inherits STATE
- City
- — inherits STATE
ZIP-level market 02703
- Rents YoY
- 5.3%
- Active inventory
- 54
- Price-to-rent
- 7.8×
Monthly cashflow live
- Estimated rent
- $2,150 medium interval (Pro) →
- Mortgage (P&I)
- −$1,054
- Tax from tax record
- −$280 /mo · $3,361/yr
- Insurance
- −$84
- HOA
- −$0
- Vacancy / Maint / Mgmt
- −$451
- Net cashflow
- $280
Break-even live
UW: 25.0% down · 7.5% · 30yr · 1.5% tax · 5.0% vac · 8.0% maint · 8.0% mgmt
Financing live
Cash to close
- Down payment
- $50,250
- Closing costs
- $6,030
- Reserves months
- —
- Total cash needed
- —
Loan-product check · same deal, 3 products live
Conventional
25% down · 7.5% · 30yr
- Down + closing
- —
- Monthly P&I
- —
- Monthly cashflow
- —
- DSCR
- —
- Eligible?
- —
Personal DTI + credit; lowest rate.
DSCR
20% down · 8.5% · 30yr
- Down + closing
- —
- Monthly P&I
- —
- Monthly cashflow
- —
- DSCR
- —
- Eligible?
- —
No personal income docs; deal must DSCR.
Hard money
10% down · 12.0% · 12mo
- Down + closing
- —
- Monthly P&I
- —
- Monthly cashflow
- —
- DSCR
- —
- Eligible?
- —
Short-term bridge; refi at stabilization.
Rent comps 1 comps
| Address | Beds | Baths | Sqft | Rent | $/sqft | DOM | Units | Dist |
|---|---|---|---|---|---|---|---|---|
| 81 Brown St Unit A Attleboro, MA | 2.0 | 1.0 | 1131 | $1,800 | $1.59 | 21d | 1 | 1.34mi |
Listing history 6 events
-
2026-06-18days on market $201,000 Active 8 DOM
-
2026-06-17days on market $201,000 Active 7 DOM
-
2026-06-16days on market $201,000 Active 6 DOM
-
2026-06-15statusdays on market $201,000 Active 5 DOM
-
2026-06-13remarks 166-char remark
-
2026-06-13$201,000 New 3 DOM
ⓘ Source: listings_history table (triggers on properties + properties_extension) + one-shot
backfill from property_details.listing_events for pre-trigger history.
Tax reassessment forecast MA · Partial reset (capped growth)
- Current annual tax
- $3,361 · $280/mo
- Projected year-2 tax
- $3,361 · $280/mo
- Expected delta
- $0/yr ($0/mo · 0.0%)
ⓘ Screening estimate from a state-policy table — verify with the county assessor before closing.
Climate risk First Street
- Flood 1/10 Low FEMA zone X (unshaded) · 0% chance over 30 yrs
- Wildfire 1/10 Low
- Heat 5/10 Major 7 d/yr ≥97°F today · 14 d/yr by 30 yrs out
- Wind 6/10 Major 68% chance of damaging wind over 30 yrs
- Air quality 2/10 Low 1 unhealthy d/yr today · 2 by 30 yrs out
Nearby sold comps map
Loading sold comps map…
Walkable amenities ~0.75 mi
Loading nearby amenities…
Taxation est. · year 1
- Rental income
- $25,795
- − Mortgage interest
- −$11,259
- − Property taxes
- −$3,361
- − Insurance
- −$1,005
- − Repairs & maintenance
- −$2,064
- − Management
- −$2,064
- − Depreciation
- −$5,847
- Taxable income
- $195
- Est. tax owed @ 24.0%
- −$47
- After-tax cash flow
- $3,316/yr
For passive investors: Depreciation is non-cash, so a rental often shows a tax loss while cash-flowing — sheltering income. Rental losses are passive: they offset passive income freely, and up to $25,000/yr can offset ordinary (W-2) income if you actively participate and your MAGI is under $100k (phasing out to $0 by $150k); unused losses carry forward. On sale, claimed depreciation is recaptured at up to 25%, and gains may owe capital-gains tax (a 1031 exchange can defer both). Figures are a year-1 estimate at your 24.0% rate — not tax advice; consult a CPA.
Schools (NCES district)
- District
- Attleboro
- NCES district ID
- 2502190
- Math proficiency
- 34% ▼ -16.00%
- Reading proficiency
- 46% ▼ -7.00%
- Median HH income
- $66,516
- Composite
- 36.03/100
- National rank
- #4778
- State rank
- #194 of 302 in MA
Livability — Attleboro
- Score
- 67/100
- State rank
- #165
- US rank
- #11046
Category grades
Schools grade is shown separately in the Schools card above.
Census & demographics
- Census place
- Attleboro, MA
- County
- Bristol County · 342,083 people
- City population
- 46,713
- Metro
- Providence-Warwick, RI-MA
- Population (ZIP)
- 46,713
- Household income
- $99,152
- Rent vs Own
- Severe rent burden
- 1378.0
Population outlook (Bristol County) Hauer SSP2
- Today (2025)
- 570,212 people
- By 2030
- 571,181 · +0.2%
- By 2040
- 565,389 · -0.8%
- By 2050
- 552,141 · -3.2%
- By 2075
- 520,923 · -8.6%
- By 2100
- 474,363 · -16.8%
Race, ethnicity, and origin ACS 2023
- Neighborhood character
- Predominantly White (78%)
- Race & ethnicity
- White 78% Hispanic / Latino 9% Two or more races 6% Black 6% Asian 5%
- Hispanic origin (detail)
- Puerto Rican 3%
- Common ancestry
- Lithuanian 8% Russian 8% Romanian 4%
- Foreign-born
- 13% · Canada, China
- Languages at home
- 82% English-only · Spanish 6% Other Indo-European 5% French/Haitian/Cajun 3%
Political lean MEDSL · Bristol
- 2024 margin
- Toss-up / Even · D 49.8% · R 48.5% · Other 1.8%
- 2008→2024 swing
- -21.9pp toward R · 2008: 23.2pp · 2024: 1.3pp
- All cycles
- 2024: D+1.3 2020: D+12.0 2016: D+9.3 2012: D+20.5 2008: D+23.2
Not yet ingested
- Civics
- —
Market trends
- HPI YoY
- ▼ -538.30%
- Current HPI
- 317.5337
- Rent YoY
- ▲ 5.30%
- Metro
- Providence-Warwick, RI-MA
- State GDP YoY
- ▲ 2.28%
- F500 in state
- 38
Industry mix (Fortune 500 HQ in MA)
| Industry | F500 HQs | Revenue |
|---|---|---|
| Technology | 3 | $17B |
|
||
| Insurance | 2 | $84B |
|
||
| Retail | 2 | $76B |
|
||
| Life Sciences | 1 | $43B |
|
||
| Energy Technology | 1 | $31B |
|
||
| Aerospace / Defense | 1 | $18B |
|
||
Price history
1 event — show timeline
- 2026-06-10 Listed $201,000 MLS PIN
Property tax history
+2.7%/yrLatest (2023): $3,361 · +3.2% YoY. Source: county tax records.
Cash-flow waterfall
monthlySold comps — $/sqft
last 12 mo · ≤1 miLoading sold comps…