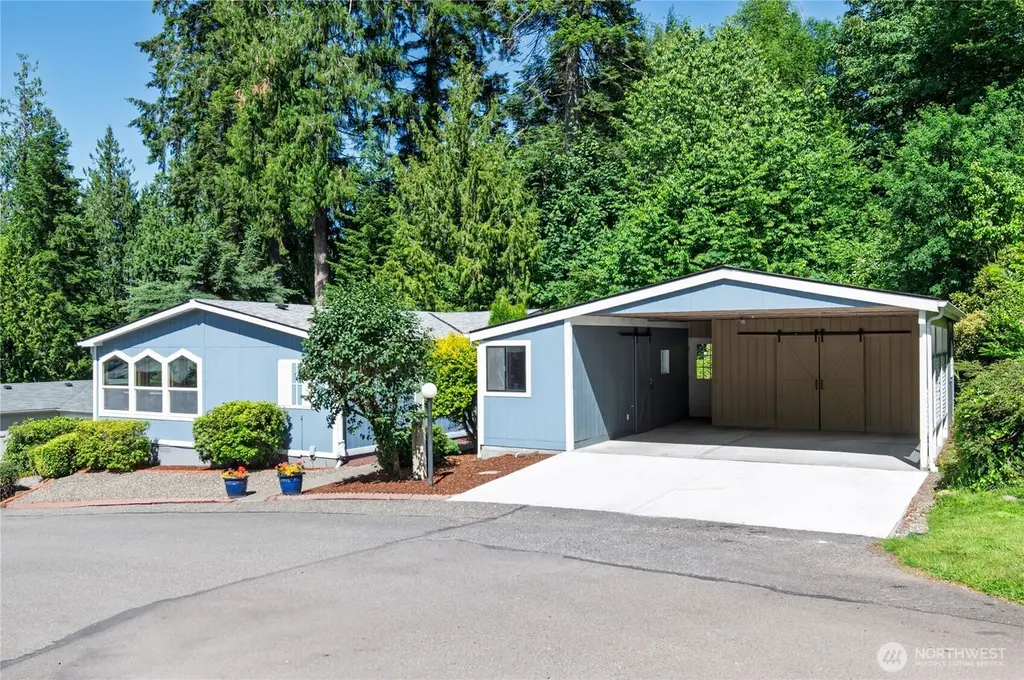
9466 Silver Creek Ln NW · Silverdale, WA
Flood risk 1/10 · Minimal
- FEMA flood zone
- X (unshaded)
- Chance of flooding over 30 yrs
- 0.0%
- Est. flood insurance / yr
- $507 – $1,088
Fire risk 1/10 · Minimal
- Est. fire insurance / yr
- $604 – $1,122
Heat risk 3/10 · Minor
- Hot days now (above 86°F)
- 7 days/yr
- Hot days in 30 yrs
- 15 days/yr
Wind risk 1/10 · Minimal
- Chance of severe wind over 30 yrs
- —
Air-quality risk 7/10 · Major
- Unhealthy air days now
- 10 days/yr
- Unhealthy air days in 30 yrs
- 10 days/yr
Risk factors via First Street. Map © Google.
Why this score? — see what drove the C- grade
The composite is a weighted blend of 9 inputs, each scored 0–100. Each bar is that input's sub-score; the figure is the points it added to the 100-point composite (weight × sub-score).
- Cash flow +23.4/30.0
- DSCR +7.5/10.0
- 1% rule +6.1/10.0
- Schools +5.5/10.0
- Livability +4.1/5.0
- Rent growth +2.6/5.0
- Condition / age +2.5/5.0
- ARV discount +0.0/15.0
- Appreciation +0.0/10.0
$235,000
🖨 Deal sheet (PDF) 📄 Offer letter ✓ Due diligence
Listing remarks
Enjoy carefree living in this beautifully updated home located on one of the premier end lots in the community. Surrounded by mature landscaping and offering a rare sense of privacy, this inviting home combines comfort, style and convenience. The heart of the home is the remodeled kitchen featuring an island, solid surface countertops, new appliances and abundant storage. Vaulted ceilings and many windows fill the home with natural light, creating an open and airy feel. Luxury vinyl plank flooring adds both beauty and durability. Offering 3 bedrooms & 2 bathrooms, the thoughtful floor plan provides flexibility for guests, hobbies or a home office. Step out to the deck that is perfect
Key facts
- Remodeled kitchen
- Natural light
- Vaulted ceilings
Tags
Property features AI
Finance
- Other: Calculated building area: 1620; Structure type: Manufactured house; Lot features and units described in listing
- Financial info: Land lease: $975; Listing terms: Cash
- HOA & community: Located in Silver Creek Meadows; Senior community; Park amenities include clubhouse and golf; Pets allowed (see remarks)
Exterior
- Parking: Carport
- Utilities: Public water; Public sewer; Electric power; Silverdale Water District; PSE power; Kitsap Public Works sewer
- Home design: Manufactured double-wide home (Redman); Updated/remodeled; Faces northwest; One story; Manufactured after 6/15/1976
- Construction: Composition roof; Double wide manufactured construction
- Exterior features: Dead-end street; Open space; Paved lot; Has view; Patio/Porch/Deck; Landscaped
Interior
- Kitchen: Dishwasher; Microwave; Refrigerator; Stove/Range
- Bedrooms: 3 bedrooms
- Flooring: Laminate; Vinyl plank; Carpet
- Bathrooms: 2 three-quarter bathrooms; 2 showers
- Heating & cooling: Forced air heating; Heat pump heating; Forced air cooling; Heat pump cooling
- Interior features: Water heater; Skylights; Vaulted ceilings; Ceiling fan(s); Walk-in closet; Bath off primary; Double pane windows; Landscaped; Patio/Porch/Deck
- Laundry & utility: Washer; Dryer; Utility room; Water heater located in laundry room; Electric water heater
Neighborhood map
What this means for you Summary
Snapshot
- This is a 3-bed/2.0-bath manufactured listed at $235k.
Deal economics
- At list price, monthly cash flow is $434 ($5k/yr) — positive.
- The deal already cash-flows at list — no discount required.
- Meets the 1% rule at list price ($3k rent vs $235k).
- Cap rate 8.5% vs local median 2.7% in Silverdale — top-decile yield for the area; either an underpriced asset or a hidden risk that comps aren't pricing in. Stress-test before assuming the spread holds.
Location & tenants
- Location reads 82/100 on livability (#63 in WA, #1,155 nationally) — a professional / high-income tenant draw. Strengths: employment A+, housing A+, health & safety A+; Watch: amenities D-, cost of living F.
- Central Kitsap School District (urban): math 55% / reading 67% proficiency, ranked #49 of 291 in WA (top 17%) — acceptable for families but not a draw, mixed tenant base, ~2y average lease.
- Market conditions: Rents flat; 151 active listings in the ZIP; 9 comparable units currently listed for rent nearby; rentals at typical pace (median 22d on market — plan ~3-4 weeks tenant-placement turnaround); solid renter incomes; 1,294 units permitted in Kitsap County in 2024 (302 in 5+ unit buildings).
Forward outlook
- Local home prices are declining (-3.0%/yr); year-one equity from $2k of loan paydown is wiped out by about $7k of value loss. Plan a longer hold.
- Kitsap County population projected at +8% by 2050 — modest demand growth; plan on rents tracking national, not racing it.
Negotiation context
- Only 6 days on market — expect competitive offers; lowballing is unlikely to land.
- 3 sale attempts since 4y ago with the ask held roughly flat each time — persistent listings suggest the price (not the market) is what's stuck; bring a comps-based counter.
- Current owner paid $185k; 27% above their basis — modest negotiation headroom, anchor on the comps not their cost.
Questions for the listing agent
- Is there a deadline driving the sale (1031 exchange, divorce, estate, relocation)? That informs how much negotiation room exists.
- Schools are A-rated — typically a magnet for longer-tenancy family renters. What's the average tenant stay here, and is there a school-zone premium baked into asking?
- What's the average days-on-market for RENTAL listings here right now (not sales)? A rising rental-DOM trend means longer vacancies and softer asking-rent achievability than the comps imply.
- What's the recent tenant-quality profile in this submarket — average credit score on applications, eviction rate, late-payment / NSF rate, and stable-employment percentage? A property-management company in the area should have these aggregated.
- How much new for-sale + rental construction is in the pipeline within 1–3 miles? Heavy new supply typically softens prices + rents 12–24 months out; constrained supply supports both.
Investment metrics
- 1% rule
- 1.11% ✓
- Cap rate
- 8.51%
- Cash-on-cash
- 7.91%
- DSCR
- 1.35
- GRM
- 7.5
CMA / ARV
- ARV (on-the-fly)
- $181,440
- Comps found
- 7
Show comp detail 7 sales within ~0.75 mi
| Address | Dist | Beds/Ba | Sqft | Sold | Price | $/sf | Match |
|---|---|---|---|---|---|---|---|
| 563 NW Silver Glen Ln | 0.10mi | 3/2.0 | 1,782 (+10%) | 2mo | $195,000 | $109 | 77 |
| 544 NW Silver Glen Ln | 0.10mi | 3/2.0 | 1,728 (+7%) | 16mo | $235,000 | $136 | 70 |
| 349 NE Waaga Way | 0.50mi | 3/2.0 | 1,620 (0%) | 13mo | $590,000 | $364 | 66 |
| 516 NW Silver Glen Ln #28 | 0.03mi | 3/2.0 | 1,404 (-13%) | 15mo | $225,000 | $160 | 64 |
| 986 Mahogany Ln | 0.45mi | 3/2.0 | 1,512 (-7%) | 10mo | $170,000 | $112 | 60 |
| 1010 NW Mahogany Ln | 0.46mi | 3/2.0 | 1,848 (+14%) | 11mo | $182,500 | $99 | 46 |
| 918 NW Mahogany Ln | 0.54mi | 3/2.0 | 1,422 (-12%) | 21mo | $108,000 | $76 | 37 |
Match score weights: distance 35% · size 25% · config 20% · recency 20%. Top-matched comps best support the ARV.
Projected returns pro-forma
-3.0% appreciation · 0.27% rent growth · sell at horizon
- IRR
- -7.4%
- Equity multiple
- 0.74×
- Total profit
- $-17,393
- Equity at exit
- $35,039
- IRR
- -1.6%
- Equity multiple
- 0.90×
- Total profit
- $-6,489
- Equity at exit
- $20,319
Cash invested: $65,800 (down + closing). Projections, not guarantees.
Landlord ↔ Tenant lean methodology
- Overall (STATE)
- 28 Tenant-Leaning
- State Washington
- 28 Tenant-Leaning · D+8
- County
- — inherits STATE
- City
- — inherits STATE
ZIP-level market 98311
- Rents YoY
- 0.3%
- Active inventory
- 151
- Price-to-rent
- 7.5×
Monthly cashflow live
- Estimated rent
- $2,605 high interval (Pro) →
- Mortgage (P&I)
- −$1,232
- Tax est. 1.5%
- −$294 /mo · $3,525/yr
- Insurance
- −$98
- HOA
- −$0
- Vacancy / Maint / Mgmt
- −$547
- Net cashflow
- $434
Break-even live
Sensitivity live
| Price | -10% $596 | -5% $515 | +0% $434 | +5% $352 | +10% $271 |
|---|---|---|---|---|---|
| Rent | -10% $228 | -5% $331 | +0% $434 | +5% $536 | +10% $639 |
| Rate | -1.0pp $552 | -0.5pp $493 | base $434 | +0.5pp $373 | +1.0pp $311 |
UW: 25.0% down · 7.5% · 30yr · 1.5% tax · 5.0% vac · 8.0% maint · 8.0% mgmt
Financing live
Cash to close
- Down payment
- $58,750
- Closing costs
- $7,050
- Reserves months
- —
- Total cash needed
- —
Loan-product check · same deal, 3 products live
Conventional
25% down · 7.5% · 30yr
- Down + closing
- —
- Monthly P&I
- —
- Monthly cashflow
- —
- DSCR
- —
- Eligible?
- —
Personal DTI + credit; lowest rate.
DSCR
20% down · 8.5% · 30yr
- Down + closing
- —
- Monthly P&I
- —
- Monthly cashflow
- —
- DSCR
- —
- Eligible?
- —
No personal income docs; deal must DSCR.
Hard money
10% down · 12.0% · 12mo
- Down + closing
- —
- Monthly P&I
- —
- Monthly cashflow
- —
- DSCR
- —
- Eligible?
- —
Short-term bridge; refi at stabilization.
Rent comps 9 comps
| Address | Beds | Baths | Sqft | Rent | $/sqft | DOM | Units | Dist |
|---|---|---|---|---|---|---|---|---|
| 835 NW Huckle Dr Unit A Bremerton, WA | 2.0 | 1.5 | 1112 | $1,900 | $1.71 | 21d | 1 | 0.43mi |
| 1255 NW Mirage Ln Silverdale, WA | 1.0–3.0 | 1.0–2.0 | 865 | $2,400 | $2.77 | 14d | 12 | 0.66mi |
| 10109 Kings Landing Ave NW Bremerton, WA | 3.0 | 2.5 | 1620 | $3,500 | $2.16 | 44d | 1 | 0.71mi |
| 7720 Vineyards Ln NE Bremerton, WA | 1.0–3.0 | 1.0–2.0 | 840 | $2,325 | $2.77 | 14d | 11 | 0.98mi |
| 263 Weatherstone Ln NE Bremerton, WA | 1.0–3.0 | 1.0–2.0 | 884 | $2,199 | $2.49 | 14d | 4 | 1.06mi |
| 8078 Old Military Rd NE Bremerton, WA | 2.0 | 2.5 | 2064 | $3,000 | $1.45 | 44d | 1 | 1.15mi |
| 968 NW Poppy Ct Silverdale, WA | 3.0 | 2.5 | 1562 | $3,000 | $1.92 | 21d | 1 | 1.20mi |
| 1413 NW Santa Fe Ln Silverdale, WA | 1.0–3.0 | 1.0–2.0 | 1002 | $2,484 | $2.48 | 14d | 15 | 1.41mi |
| 100 NE Miramar Cir Bremerton, WA | 3.0 | 2.5 | 1446 | $2,500 | $1.73 | 21d | 1 | 1.41mi |
Listing history 6 events
-
2026-06-18days on market $235,000 Active 6 DOM
-
2026-06-17days on market $235,000 Active 5 DOM
-
2026-06-16days on market $235,000 Active 4 DOM
-
2026-06-15days on market $235,000 Active 3 DOM
-
2026-06-13remarks 695-char remark
-
2026-06-13$235,000 Active 1 DOM
ⓘ Source: listings_history table (triggers on properties + properties_extension) + one-shot
backfill from property_details.listing_events for pre-trigger history.
Climate risk First Street
- Flood 1/10 Low FEMA zone X (unshaded) · 0% chance over 30 yrs
- Wildfire 1/10 Low
- Heat 3/10 Moderate 7 d/yr ≥86°F today · 15 d/yr by 30 yrs out
- Wind 1/10 Low
- Air quality 7/10 Severe 10 unhealthy d/yr today · 10 by 30 yrs out
Nearby sold comps map
Loading sold comps map…
Walkable amenities ~0.75 mi
Loading nearby amenities…
Taxation est. · year 1
- Rental income
- $31,254
- − Mortgage interest
- −$13,164
- − Property taxes
- −$3,525
- − Insurance
- −$1,175
- − Repairs & maintenance
- −$2,500
- − Management
- −$2,500
- − Depreciation
- −$6,836
- Taxable income
- $1,554
- Est. tax owed @ 24.0%
- −$373
- After-tax cash flow
- $4,830/yr
For passive investors: Depreciation is non-cash, so a rental often shows a tax loss while cash-flowing — sheltering income. Rental losses are passive: they offset passive income freely, and up to $25,000/yr can offset ordinary (W-2) income if you actively participate and your MAGI is under $100k (phasing out to $0 by $150k); unused losses carry forward. On sale, claimed depreciation is recaptured at up to 25%, and gains may owe capital-gains tax (a 1031 exchange can defer both). Figures are a year-1 estimate at your 24.0% rate — not tax advice; consult a CPA.
Schools (NCES district)
- District
- Central Kitsap School District
- NCES district ID
- 5301080
- Math proficiency
- 55% ▲ 1.00%
- Reading proficiency
- 67% ▬ 0.00%
- Median HH income
- $64,825
- Composite
- 54.87/100
- National rank
- #2813
- State rank
- #49 of 291 in WA
Livability — Silverdale
- Score
- 82/100
- State rank
- #63
- US rank
- #1155
Category grades
Schools grade is shown separately in the Schools card above.
Census & demographics
- County
- Kitsap County · 243,099 people
- City population
- 21,604
- Metro
- Bremerton-Silverdale-Port Orchard, WA
- Population (ZIP)
- 28,168
- Household income
- $108,757
- Rent vs Own
- Severe rent burden
- 502.0
Population outlook (Kitsap County) Hauer SSP2
- Today (2025)
- 277,525 people
- By 2030
- 285,040 · +2.7%
- By 2040
- 294,957 · +6.3%
- By 2050
- 300,622 · +8.3%
- By 2075
- 315,580 · +13.7%
- By 2100
- 304,340 · +9.7%
Race, ethnicity, and origin ACS 2023
- Neighborhood character
- Predominantly White (67%)
- Race & ethnicity
- White 67% Two or more races 14% Hispanic / Latino 9% Asian 9% Black 3% Pacific Islander 2%
- Hispanic origin (detail)
- Mexican 6%
- Common ancestry
- Portuguese 4% Italian 4% Slovak 3%
- Foreign-born
- 9% · Canada, Vietnam, China
- Languages at home
- 89% English-only · Tagalog/Filipino 4% Spanish 3% Vietnamese 2%
Political lean MEDSL · Kitsap
- 2024 margin
- Strong D (+20.9) · D 58.8% · R 37.9% · Other 3.3%
- 2008→2024 swing
- +8.6pp toward D · 2008: 12.3pp · 2024: 20.9pp
- All cycles
- 2024: D+20.9 2020: D+18.1 2016: D+11.6 2012: D+11.1 2008: D+12.3
Not yet ingested
- Civics
- —
Market trends
- HPI YoY
- ▼ -378.18%
- Current HPI
- 356.6272
- Rent YoY
- ▲ 0.27%
- Metro
- Bremerton-Silverdale-Port Orchard, WA
- State GDP YoY
- ▲ 4.65%
- F500 in state
- 22
Industry mix (Fortune 500 HQ in WA)
| Industry | F500 HQs | Revenue |
|---|---|---|
| Retail | 2 | $269B |
|
||
| Technology / Retail | 1 | $638B |
|
||
| Technology | 1 | $245B |
|
||
| Telecommunications | 1 | $38B |
|
||
| Food / Beverage | 1 | $36B |
|
||
| Automotive / Trucks | 1 | $34B |
|
||
Price history
+20.5% since first listed6 events — show timeline
- 2026-06-12 Listed $235,000 NWMLS as Distributed by MLS Grid
- 2022-07-20 Sold (MLS) $185,000 NWMLS as Distributed by MLS Grid
- 2022-07-07 Pending — NWMLS as Distributed by MLS Grid
- 2022-07-01 Relisted — NWMLS as Distributed by MLS Grid
- 2022-06-01 Pending — NWMLS as Distributed by MLS Grid
- 2022-05-14 Listed $195,000 NWMLS as Distributed by MLS Grid
Cash-flow waterfall
monthlySold comps — $/sqft
last 12 mo · ≤1 miLoading sold comps…