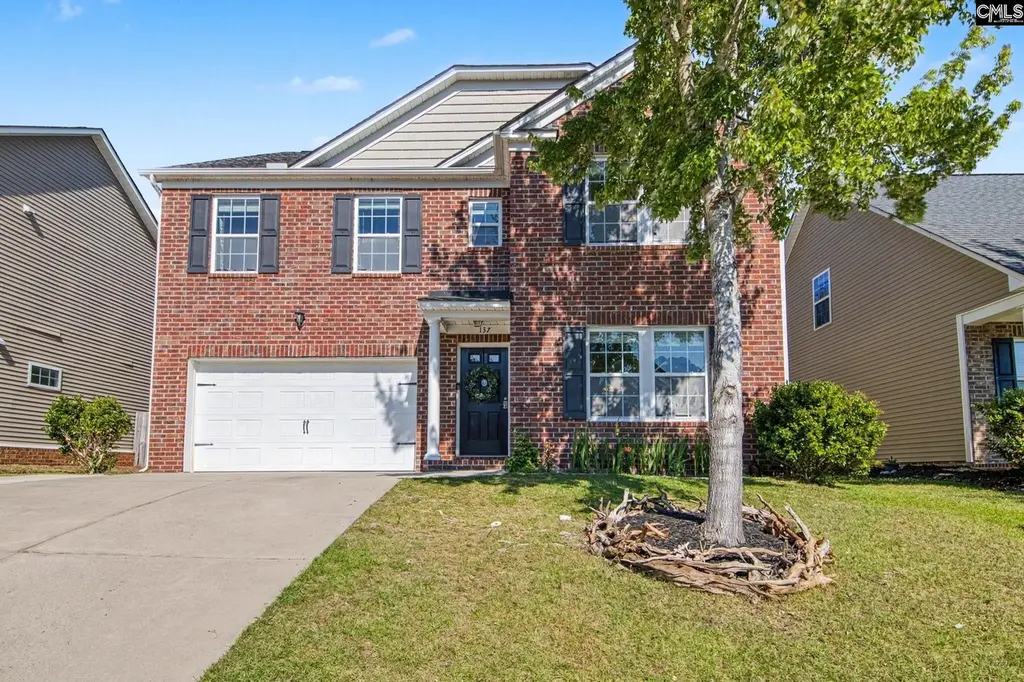
137 Palm St · Chapin, SC
Flood risk 1/10 · Minimal
- FEMA flood zone
- X (unshaded)
- Chance of flooding over 30 yrs
- 0.0%
- Est. flood insurance / yr
- $507 – $1,088
Fire risk 4/10 · Minor
- Est. fire insurance / yr
- $783 – $1,453
Heat risk 7/10 · Major
- Hot days now (above 108°F)
- 7 days/yr
- Hot days in 30 yrs
- 17 days/yr
Wind risk 6/10 · Moderate
- Chance of severe wind over 30 yrs
- 58.0%
Air-quality risk 3/10 · Minor
- Unhealthy air days now
- 2 days/yr
- Unhealthy air days in 30 yrs
- 3 days/yr
Risk factors via First Street. Map © Google.
Why this score? — see what drove the D grade
The composite is a weighted blend of 9 inputs, each scored 0–100. Each bar is that input's sub-score; the figure is the points it added to the 100-point composite (weight × sub-score).
- Cash flow +13.9/30.0
- ARV discount +7.5/15.0
- Schools +4.5/10.0
- DSCR +4.2/10.0
- Livability +3.2/5.0
- 1% rule +3.0/10.0
- Rent growth +2.5/5.0
- Condition / age +2.5/5.0
- Appreciation +0.0/10.0
$339,000
🖨 Deal sheet (PDF) 📄 Offer letter ✓ Due diligence
Listing remarks
The Lake Life You've Been Looking For — at a Price You'll Love! Imagine starting your mornings steps from Lake Murray, in a welcoming community designed with the entire family in mind. That's exactly what 137 Palm Street in The Palms at Stoney Pointe (Bear Creek Subdivision) offers. Zoned for award-winning Chapin schools and packed with amenities — a pool, clubhouse, playground, fishing spots, scenic walking paths, boat storage lot (with additional fee), and green spaces — this neighborhood truly has it all. And when you're ready to venture out, the charming town of Chapin is just minutes away, with schools, restaurants, shopping, parks, and direct access to Lake Murray al
Key facts
- Fishing spots
- Community amenities
- Scenic walking paths
Tags
Property features AI
Finance
- HOA & community: Homeowners association with clubhouse, pool, playground, common area maintenance, street light maintenance and maintained green areas
Exterior
- Parking: Attached garage with 2 garage spaces (2 total parking spaces); Garage on main level
- Utilities: Public water; Public sewer
- Home design: Two-story house; Partially brick and vinyl exterior
- Construction: Slab foundation
- Exterior features: Patio; Partial gutters; Sprinkler system; Privacy wood fence in rear
Interior
- Kitchen: Granite countertops; Kitchen island; Pantry; Wood stained cabinets; Tile backsplash; Hardwood floor in kitchen; Microwave above stove; Dishwasher; Refrigerator; Free-standing smooth-surface self-cleaning range
- Bedrooms: Master suite on second floor with vaulted/high ceilings, double vanity, garden tub, separate shower, private water closet and walk-in his-and-hers closets; Additional bedrooms on main level with walk-in closets and private closets
- Flooring: Hardwood flooring in main living areas; Carpet and tile in bedrooms
- Bathrooms: Two full bathrooms; One partial bathroom; One half bathroom; Master bathroom with double vanity, garden tub, separate shower and private water closet
- Heating & cooling: Central heating; Central air conditioning
- Interior features: Hardwood floors in formal living room, formal dining room and great room; Decorative molding in formal living and dining rooms; Recessed lighting; Bar area
- Laundry & utility: Heated laundry space located on second floor
Neighborhood map
What this means for you Summary
Snapshot
- This is a 4-bed/2.5-bath single-family listed at $339k.
Deal economics
- At list price, monthly cash flow is $40 ($476/yr) — positive.
- The deal already cash-flows at list — no discount required.
- To meet the 1% rule (rent ≥ 1% of price), the offer needs to be $270k (20.4% below list).
- Recommended offer: $270k (20.4% below list) — sets the bar for 1% rule.
Location & tenants
- Location reads 65/100 on livability (#133 in SC) — a middle-class / working-renter tenant base. Strengths: cost of living A+, housing A+; Watch: crime C-, employment C-, amenities F.
- Lexington 05 (suburban): math 47% / reading 55% proficiency, ranked #5 of 80 in SC (top 6%) — acceptable for families but not a draw, mixed tenant base, ~2y average lease.
- Zoned schools: Chapin Elementary (math 53% / reading 51%, grade C-, #145 of 597 statewide, top 26%, 790 students, 34% FRL); Chapin Middle (math 50% / reading 57%, grade C+, #29 of 229 statewide, top 13%, 991 students, 27% FRL); Chapin High (math 82% / reading 91%, grade A, #7 of 196 statewide, top 4%, 1,615 students, 100% FRL) — zoned schools average 54% FRL vs 27% district-wide (26 pts higher); higher-poverty schools than district average — tighter screening recommended.
- Zoned-school proficiency averages 64% at this address vs 51% district-wide (+13 pts) — the actual schools serving this property are materially stronger than the Lexington 05 average implies; a family-tenant draw the district grade alone would hide.
- Market conditions: 443 active listings in the ZIP; 4 comparable units currently listed for rent nearby; rentals at typical pace (median 16d on market — plan ~3-4 weeks tenant-placement turnaround); high-income renter base; 1,712 units permitted in Lexington County in 2024 (0 in 5+ unit buildings).
Forward outlook
- Local home prices are declining (-3.0%/yr); year-one equity from $2k of loan paydown is wiped out by about $10k of value loss. Plan a longer hold.
- Lexington County population projected at +26% by 2050 — long-run rental-demand tailwind backs the buy-and-hold thesis.
Negotiation context
- Only 3 days on market — expect competitive offers; lowballing is unlikely to land.
- 2 sale attempts since 3y ago with the ask held roughly flat each time — persistent listings suggest the price (not the market) is what's stuck; bring a comps-based counter.
Risks & watch-outs
- Climate carrying-cost: major wind risk, 58% chance of damaging wind over 30y; extreme-heat days projected 7→17/yr by 2055 (HVAC capex compounding) — expect insurance premiums to compound above CPI over the hold.
Questions for the listing agent
- Is there a deadline driving the sale (1031 exchange, divorce, estate, relocation)? That informs how much negotiation room exists.
- Schools are A-rated — typically a magnet for longer-tenancy family renters. What's the average tenant stay here, and is there a school-zone premium baked into asking?
- The area grade is low — what's the realistic commute time and amenity access for the typical tenant pool here? Any planned neighborhood developments (good or bad) we should know about?
- What's the average days-on-market for RENTAL listings here right now (not sales)? A rising rental-DOM trend means longer vacancies and softer asking-rent achievability than the comps imply.
- What's the recent tenant-quality profile in this submarket — average credit score on applications, eviction rate, late-payment / NSF rate, and stable-employment percentage? A property-management company in the area should have these aggregated.
- How much new for-sale + rental construction is in the pipeline within 1–3 miles? Heavy new supply typically softens prices + rents 12–24 months out; constrained supply supports both.
Investment metrics
- 1% rule
- 0.80% ✗
- Cap rate
- 6.43%
- Cash-on-cash
- 0.50%
- DSCR
- 1.02
- GRM
- 10.5
CMA / ARV
No comps found within radius.
Projected returns pro-forma
-3.0% appreciation · 3.0% rent growth · sell at horizon
- IRR
- -15.5%
- Equity multiple
- 0.45×
- Total profit
- $-52,517
- Equity at exit
- $50,546
- IRR
- -7.1%
- Equity multiple
- 0.55×
- Total profit
- $-42,938
- Equity at exit
- $29,311
Cash invested: $94,920 (down + closing). Projections, not guarantees.
Landlord ↔ Tenant lean methodology
- Overall (STATE)
- 90 Strongly Landlord-Friendly
- State South Carolina
- 90 Strongly Landlord-Friendly · R+6
- County
- — inherits STATE
- City
- — inherits STATE
ZIP-level market 29036
- Active inventory
- 443
- Price-to-rent
- 10.5×
Monthly cashflow live
- Estimated rent
- $2,697 medium interval (Pro) →
- Mortgage (P&I)
- −$1,778
- Tax from tax record
- −$172 /mo · $2,065/yr
- Insurance
- −$141
- HOA
- −$0
- Vacancy / Maint / Mgmt
- −$566
- Net cashflow
- $40
Break-even live
Sensitivity live
| Price | -10% $232 | -5% $136 | +0% $40 | +5% $-56 | +10% $-152 |
|---|---|---|---|---|---|
| Rent | -10% $-173 | -5% $-67 | +0% $40 | +5% $146 | +10% $253 |
| Rate | -1.0pp $210 | -0.5pp $126 | base $40 | +0.5pp $-48 | +1.0pp $-138 |
UW: 25.0% down · 7.5% · 30yr · 1.5% tax · 5.0% vac · 8.0% maint · 8.0% mgmt
Financing live
Cash to close
- Down payment
- $84,750
- Closing costs
- $10,170
- Reserves months
- —
- Total cash needed
- —
Loan-product check · same deal, 3 products live
Conventional
25% down · 7.5% · 30yr
- Down + closing
- —
- Monthly P&I
- —
- Monthly cashflow
- —
- DSCR
- —
- Eligible?
- —
Personal DTI + credit; lowest rate.
DSCR
20% down · 8.5% · 30yr
- Down + closing
- —
- Monthly P&I
- —
- Monthly cashflow
- —
- DSCR
- —
- Eligible?
- —
No personal income docs; deal must DSCR.
Hard money
10% down · 12.0% · 12mo
- Down + closing
- —
- Monthly P&I
- —
- Monthly cashflow
- —
- DSCR
- —
- Eligible?
- —
Short-term bridge; refi at stabilization.
Rent comps 4 comps
| Address | Beds | Baths | Sqft | Rent | $/sqft | DOM | Units | Dist |
|---|---|---|---|---|---|---|---|---|
| 280 Walkbridge Way Chapin, SC | 4.0 | 3.0 | 2041 | $2,500 | $1.22 | 4d | 1 | 0.23mi |
| 147 Ventnor Ave Chapin, SC | 4.0 | 3.0 | 2384 | $2,400 | $1.01 | 25d | 1 | 0.93mi |
| 147 Ventnor Ave Chapin, SC | 4.0 | 3.0 | 2384 | $2,400 | $1.01 | 16d | 1 | 0.93mi |
| 164 Pacific Ave Chapin, SC | 3.0 | 2.5 | 2364 | $2,149 | $0.91 | 13d | 1 | 1.11mi |
Listing history 7 events
-
2026-05-24status Pending
-
2026-05-21$339,000 Active
-
2023-10-30soldstatus $337,500
-
2023-10-15status Pending
-
2023-09-30historical Active - Contingent
-
2023-09-29$337,500 Active
-
2013-02-26soldstatus $198,000
ⓘ Source: listings_history table (triggers on properties + properties_extension) + one-shot
backfill from property_details.listing_events for pre-trigger history.
Tax reassessment forecast SC · Resets to sale price
- Current annual tax
- $2,065 · $172/mo
- Projected year-2 tax
- $2,065 · $172/mo
- Expected delta
- $0/yr ($0/mo · 0.0%)
ⓘ Screening estimate from a state-policy table — verify with the county assessor before closing.
Climate risk First Street
- Flood 1/10 Low FEMA zone X (unshaded) · 0% chance over 30 yrs
- Wildfire 4/10 Moderate
- Heat 7/10 Severe 7 d/yr ≥108°F today · 17 d/yr by 30 yrs out
- Wind 6/10 Major 58% chance of damaging wind over 30 yrs
- Air quality 3/10 Moderate 2 unhealthy d/yr today · 3 by 30 yrs out
Nearby sold comps map
Loading sold comps map…
Walkable amenities ~0.75 mi
Loading nearby amenities…
Taxation est. · year 1
- Rental income
- $32,367
- − Mortgage interest
- −$18,989
- − Property taxes
- −$2,065
- − Insurance
- −$1,695
- − Repairs & maintenance
- −$2,589
- − Management
- −$2,589
- − Depreciation
- −$9,862
- Taxable loss
- −$5,423
- Est. tax savings @ 24.0%
- +$1,302
- After-tax cash flow
- $1,778/yr
For passive investors: Depreciation is non-cash, so a rental often shows a tax loss while cash-flowing — sheltering income. Rental losses are passive: they offset passive income freely, and up to $25,000/yr can offset ordinary (W-2) income if you actively participate and your MAGI is under $100k (phasing out to $0 by $150k); unused losses carry forward. On sale, claimed depreciation is recaptured at up to 25%, and gains may owe capital-gains tax (a 1031 exchange can defer both). Figures are a year-1 estimate at your 24.0% rate — not tax advice; consult a CPA.
Schools (NCES district)
- District
- Lexington 05
- NCES district ID
- 4502820
- Math proficiency
- 47% ▼ -7.00%
- Reading proficiency
- 55% ▼ -4.00%
- Median HH income
- $67,732
- Composite
- 45.28/100
- National rank
- #2656
- State rank
- #5 of 80 in SC
Livability — Chapin
- Score
- 65/100
- State rank
- #133
- US rank
- #12994
Category grades
Schools grade is shown separately in the Schools card above.
Census & demographics
- County
- Lexington County · 232,571 people
- City population
- 26,620
- Metro
- Columbia, SC
- Population (ZIP)
- 26,620
- Household income
- $113,986
- Rent vs Own
- Severe rent burden
- 212.0
Population outlook (Lexington County) Hauer SSP2
- Today (2025)
- 322,999 people
- By 2030
- 342,356 · +6.0%
- By 2040
- 377,715 · +16.9%
- By 2050
- 406,984 · +26.0%
- By 2075
- 465,447 · +44.1%
- By 2100
- 485,674 · +50.4%
Race, ethnicity, and origin ACS 2023
- Neighborhood character
- Predominantly White (86%)
- Race & ethnicity
- White 86% Asian 5% Two or more races 4% Black 3% Hispanic / Latino 3%
- Common ancestry
- Lithuanian 4% Slovak 4% Italian 2%
- Foreign-born
- 6% · Canada, South Korea, China
- Languages at home
- 95% English-only · Other Indo-European 2% Spanish 1% Korean 1%
Political lean MEDSL · Lexington
- 2024 margin
- Solid R (+33.5) · D 32.5% · R 66.0% · Other 1.4%
- 2008→2024 swing
- +4.6pp toward D · 2008: -38.0pp · 2024: -33.5pp
- All cycles
- 2024: R+33.5 2020: R+30.1 2016: R+36.7 2012: R+37.8 2008: R+38.0
Not yet ingested
- Civics
- —
Market trends
- HPI YoY
- ▼ -134.76%
- Current HPI
- 248.3807
- Rent YoY
- —
- Metro
- Columbia, SC
- State GDP YoY
- ▲ 4.51%
- F500 in state
- 2
Industry mix (Fortune 500 HQ in SC)
| Industry | F500 HQs | Revenue |
|---|---|---|
| Packaging | 1 | $7B |
|
||
Price history
+71.2% since first listed7 events — show timeline
- 2026-05-24 Pending — Consolidated MLS
- 2026-05-21 Listed $339,000 Consolidated MLS
- 2023-10-30 Sold (Public Records) $337,500 Public Records
- 2023-10-15 Pending — Consolidated MLS
- 2023-09-30 Contingent — Consolidated MLS
- 2023-09-29 Listed $337,500 Consolidated MLS
- 2013-02-26 Sold (Public Records) $198,000 Public Records
Property tax history
+12.9%/yrLatest (2024): $2,065 · +60.7% YoY. Source: county tax records.
Cash-flow waterfall
monthlySold comps — $/sqft
last 12 mo · ≤1 miLoading sold comps…