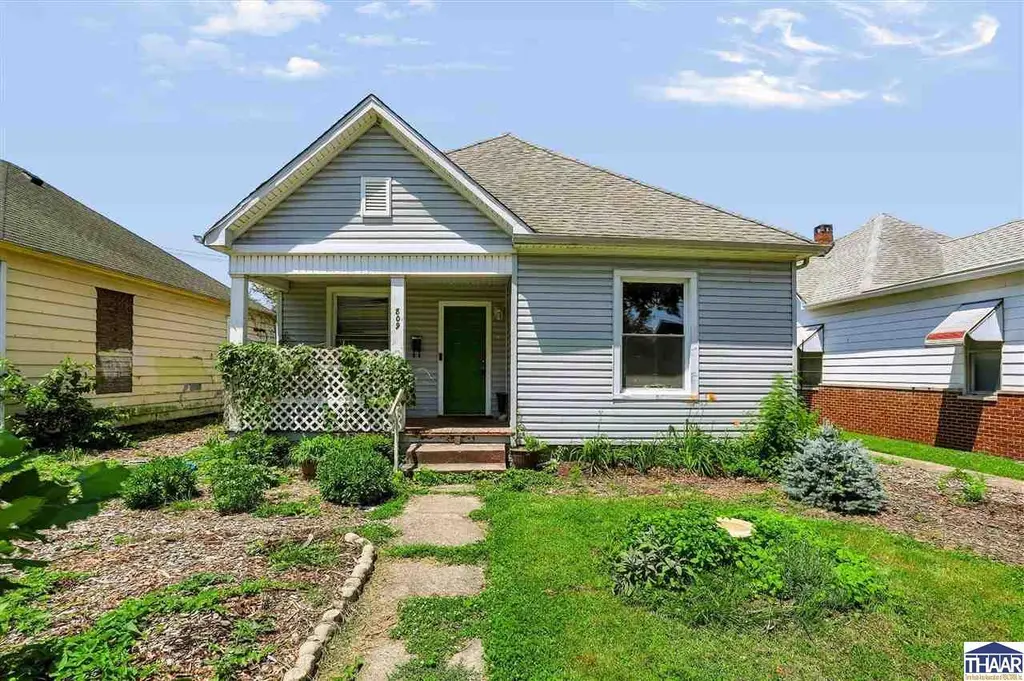
809 S 20th St · Terre Haute, IN
Flood risk 1/10 · Minimal
- FEMA flood zone
- X (unshaded)
- Chance of flooding over 30 yrs
- 0.0%
- Est. flood insurance / yr
- $473 – $860
Fire risk 1/10 · Minimal
- Est. fire insurance / yr
- $717 – $1,331
Heat risk 4/10 · Minor
- Hot days now (above 104°F)
- 7 days/yr
- Hot days in 30 yrs
- 19 days/yr
Wind risk 2/10 · Minimal
- Chance of severe wind over 30 yrs
- 1.0%
Air-quality risk 3/10 · Minor
- Unhealthy air days now
- 3 days/yr
- Unhealthy air days in 30 yrs
- 4 days/yr
Risk factors via First Street. Map © Google.
Why this score? — see what drove the C+ grade
The composite is a weighted blend of 9 inputs, each scored 0–100. Each bar is that input's sub-score; the figure is the points it added to the 100-point composite (weight × sub-score).
- Cash flow +27.4/30.0
- DSCR +9.6/10.0
- ARV discount +8.3/15.0
- 1% rule +6.7/10.0
- Livability +3.8/5.0
- Rent growth +3.5/5.0
- Schools +2.9/10.0
- Condition / age +2.5/5.0
- Appreciation +0.0/10.0
$85,000
🖨 Deal sheet 📄 Offer letter ✓ Due diligence
Listing remarks MLS
This late, 800s bungalow offers many of the features that make historic homes so special: tall ceilings, original hardwood floors, substantial trim work, oversized baseboards, detailed door casings, and a welcoming front porch facing the east morning sunrise. Beyond the walls, the fully fenced backyard provides room to relax, garden, entertain, or let four-legged family members roam. Years of care have created rich soil that has supported both vegetable and flower gardens, offering a head start for anyone who enjoys spending time outdoors. Whether you're searching for an affordable place to call home, a property to improve over time, or an investment opportunity, this home offers flexibility and character that's increasingly hard to find. The property is being sold as-is, and a pre-listing inspection has already been completed to provide a clear understanding of the home's condition before making an offer.
Key facts
- 5,240 sq ft lot
- Built 1890
- Listed 5 days
Property features AI
Finance
- Other: Lot under 1/4 acre (approximately 0.12 acre); Not in a subdivision; Low optional finished area percentage
Exterior
- Utilities: Public water; Municipal sewer connected; No solid waste service listed
- Home design: Single-family residence; One level; Faces east; Listed as fixer condition
- Construction: Vinyl siding; Block foundation and crawl space
- Exterior features: Covered patio/porch; Storage shed; Chain link fence (complete)
Interior
- Kitchen: Gas oven; Refrigerator; Eat-in layout
- Bedrooms: 2 bedrooms (both on the main level)
- Bathrooms: 1 full bathroom (on the main level)
- Heating & cooling: Forced air heating (natural gas); Central air conditioning
- Interior features: Eat-in kitchen; Cellar and full basement
- Laundry & utility: Washer and dryer (laundry located in basement)
Neighborhood map
What this means for you Summary
Snapshot
- This is a 2-bed/1.0-bath single-family listed at $85k.
Deal economics
- At list price, monthly cash flow is $248 ($3k/yr) — positive.
- The deal already cash-flows at list — no discount required.
- Meets the 1% rule at list price ($997 rent vs $85k).
- Cap rate 9.8% vs local median 4.7% in Terre Haute — top-decile yield for the area; either an underpriced asset or a hidden risk that comps aren't pricing in. Stress-test before assuming the spread holds.
Location & tenants
- Location reads 75/100 on livability (#63 in IN, #4,186 nationally) — a middle-class / working-renter tenant base. Strengths: cost of living A+, housing A+, health & safety A+; Watch: crime F, employment F.
- Vigo County School Corporation (urban): math 32% / reading 37% proficiency, ranked #202 of 301 in IN (top 67%) — families likely to look elsewhere, expect single-tenant / working-renter base with shorter leases.
- Zoned schools: Riley Elementary School (math 67% / reading 52%, grade B-, #128 of 994 statewide, top 15%, 390 students, 35% FRL); Terre Haute South Vigo High School (math 37% / reading 72%, grade C-, #79 of 369 statewide, top 26%, 1,610 students, 51% FRL) — zoned schools at 43% FRL track the district average.
- Zoned-school proficiency averages 57% at this address vs 34% district-wide (+22 pts) — the actual schools serving this property are materially stronger than the Vigo County School Corporation average implies; a family-tenant draw the district grade alone would hide.
- Market conditions: Rents rising fast (+4.1%/yr); 177 active listings in the ZIP; 14 comparable units currently listed for rent nearby; rentals lingering (median 44d on market — plan ~5-8 weeks vacancy on turnover, expect pricing pressure); 100% of comp listings sitting > 30 days — soft ceiling on asking rent; 60 units permitted in Vigo County in 2024 (0 in 5+ unit buildings).
Forward outlook
- Local home prices are declining (-3.0%/yr); year-one equity from $588 of loan paydown is wiped out by about $3k of value loss. Plan a longer hold.
- Vigo County population projected to shrink 5% by 2050 — rents likely to lag national; underwrite the cash flow, not the appreciation.
- At projected returns (-3.0% appreciation + 4.1% rent growth), your $24k cash investment doubles in ~9 years — after that, you're playing with house money.
Negotiation context
- Only 6 days on market — expect competitive offers; lowballing is unlikely to land.
- 4 sale attempts since 6y ago with the ask held roughly flat each time — persistent listings suggest the price (not the market) is what's stuck; bring a comps-based counter.
- Current owner paid $48k; list at $85k implies a 77% gain — meaningful room to come down on a strong offer.
Risks & watch-outs
- Watch-outs: built in 1890 — expect roof / HVAC / electrical / plumbing capex.
Questions for the listing agent
- Built in 1890 — when were the roof, HVAC, electrical panel, plumbing, and water heater last replaced?
- Is there a deadline driving the sale (1031 exchange, divorce, estate, relocation)? That informs how much negotiation room exists.
- Schools are D-rated, which usually means shorter tenancies and higher turnover. Who's the typical renter profile here, and what's been the actual vacancy rate?
- Crime grade is F in this area — have there been break-ins, vandalism, or insurance claims at this property in the last 3 years? What carrier currently insures it and at what premium?
- What's the average days-on-market for RENTAL listings here right now (not sales)? A rising rental-DOM trend means longer vacancies and softer asking-rent achievability than the comps imply.
- What's the recent tenant-quality profile in this submarket — average credit score on applications, eviction rate, late-payment / NSF rate, and stable-employment percentage? A property-management company in the area should have these aggregated.
- How much new for-sale + rental construction is in the pipeline within 1–3 miles? Heavy new supply typically softens prices + rents 12–24 months out; constrained supply supports both.
Investment metrics
- 1% rule
- 1.17% ✓
- Cap rate
- 9.79%
- Cash-on-cash
- 12.51%
- DSCR
- 1.56
- GRM
- 7.1
CMA / ARV
- ARV (on-the-fly)
- $86,460
- Comps found
- 10
Show comp detail 10 sales within ~0.75 mi
| Address | Dist | Beds/Ba | Sqft | Sold | Price | $/sf | Match |
|---|---|---|---|---|---|---|---|
| 916 S 17 St | 0.18mi | 2/1.0 | 744 (-5%) | 3mo | $82,500 | $111 | 81 |
| 433 S 25th St | 0.52mi | 2/1.0 | 760 (-3%) | 2mo | $89,000 | $117 | 69 |
| 2209 Crawford St | 0.24mi | 2/1.0 | 739 (-6%) | 14mo | $103,000 | $139 | 67 |
| 613 S 15th St | 0.34mi | 1/1.0 (-1) | 756 (-4%) | 9mo | $22,000 | $29 | 66 |
| 2204 Seabury Ave | 0.61mi | 2/1.0 | 816 (+4%) | 1mo | $90,000 | $110 | 64 |
| 2703 Dean Ave | 0.69mi | 1/1.0 (-1) | 790 (+0%) | 5mo | $18,750 | $24 | 58 |
| 1216 S 25th St | 0.54mi | 2/1.0 | 824 (+5%) | 16mo | $90,000 | $109 | 53 |
| 2379 Putnam | 0.66mi | 2/1.0 | 798 (+2%) | 18mo | $134,000 | $168 | 52 |
| 2304 Putnam St | 0.58mi | 2/1.0 | 800 (+2%) | 23mo | $84,800 | $106 | 51 |
| 1029 S 17th St | 0.24mi | 2/1.0 | 890 (+13%) | 22mo | $40,000 | $45 | 49 |
Match score weights: distance 35% · size 25% · config 20% · recency 20%. Top-matched comps best support the ARV.
Projected returns pro-forma
-3.0% appreciation · 4.09% rent growth · sell at horizon
- IRR
- 3.4%
- Equity multiple
- 1.13×
- Total profit
- $3,117
- Equity at exit
- $12,674
- IRR
- 13.8%
- Equity multiple
- 2.16×
- Total profit
- $27,638
- Equity at exit
- $7,349
Cash invested: $23,800 (down + closing). Projections, not guarantees.
Landlord ↔ Tenant lean methodology
- Overall (STATE)
- 90 Strongly Landlord-Friendly
- State Indiana
- 90 Strongly Landlord-Friendly · R+11
- County
- — inherits STATE
- City
- — inherits STATE
ZIP-level market 47803
- Home prices YoY
- -28.6%
- Rents YoY
- 4.1%
- Active inventory
- 177
- Price-to-rent
- 7.1×
Monthly cashflow live
- Estimated rent
- $997 high interval (Pro) →
- Mortgage (P&I)
- −$446
- Tax from tax record
- −$59 /mo · $702/yr
- Insurance
- −$35
- HOA
- −$0
- Vacancy / Maint / Mgmt
- −$209
- Net cashflow
- $248
Break-even live
UW: 25.0% down · 7.5% · 30yr · 1.5% tax · 5.0% vac · 8.0% maint · 8.0% mgmt
Financing live
Cash to close
- Down payment
- $21,250
- Closing costs
- $2,550
- Reserves months
- —
- Total cash needed
- —
Loan-product check · same deal, 3 products live
Conventional
25% down · 7.5% · 30yr
- Down + closing
- —
- Monthly P&I
- —
- Monthly cashflow
- —
- DSCR
- —
- Eligible?
- —
Personal DTI + credit; lowest rate.
DSCR
20% down · 8.5% · 30yr
- Down + closing
- —
- Monthly P&I
- —
- Monthly cashflow
- —
- DSCR
- —
- Eligible?
- —
No personal income docs; deal must DSCR.
Hard money
10% down · 12.0% · 12mo
- Down + closing
- —
- Monthly P&I
- —
- Monthly cashflow
- —
- DSCR
- —
- Eligible?
- —
Short-term bridge; refi at stabilization.
Rent comps 14 comps
| Address | Beds | Baths | Sqft | Rent | $/sqft | DOM | Units | Dist |
|---|---|---|---|---|---|---|---|---|
| 435 S 18th St Terre Haute, IN | 3.0 | 1.0 | 1108 | $1,050 | $0.95 | 43d | 1 | 0.30mi |
| 1320 S 19th St Terre Haute, IN | 2.0 | 1.0 | 830 | $700 | $0.84 | 43d | 1 | 0.34mi |
| 433 S 25th St Terre Haute, IN | 2.0 | 1.0 | 760 | $995 | $1.31 | 43d | 1 | 0.51mi |
| 1701 Ohio St Unit C Terre Haute, IN | 2.0 | 1.0 | 880 | $950 | $1.08 | 43d | 1 | 0.53mi |
| 1609 Ohio St Unit 1 Terre Haute, IN, USA Terre Haute, IN | 1.0 | 1.0 | 700 | $785 | $1.12 | 43d | 1 | 0.55mi |
| 731 S 7th St Terre Haute, IN | 1.0 | 1.0 | 700 | $1,200 | $1.71 | 43d | 1 | 1.09mi |
| 1201 S 7th St Unit 3 Terre Haute, IN | 3.0 | 1.0 | 880 | $925 | $1.05 | 43d | 1 | 1.11mi |
| 1611 S 7th St Apt 4 Terre Haute, IN | 2.0 | 1.0 | 1022 | $795 | $0.78 | 43d | 1 | 1.25mi |
| 500 College Ave Terre Haute, IN | 2.0 | 1.0 | 809 | $792 | $0.98 | 43d | 14 | 1.32mi |
| 1095 Spruce St Unit 2 Bed TBD Terre Haute, IN | 2.0 | 1.0 | 650 | $519 | $0.80 | 43d | 1 | 1.34mi |
| 615 Cherry St Unit 212 Terre Haute, IN | 2.0 | 1.0 | 625 | $1,194 | $1.91 | 43d | 1 | 1.37mi |
| 66 Pear Tree Ln Terre Haute, IN | 2.0 | 1.0 | 868 | $875 | $1.01 | 43d | 1 | 1.41mi |
| 1001 E Voorhees St Apt G Terre Haute, IN | 2.0 | 1.0 | 577 | $750 | $1.30 | 43d | 1 | 1.45mi |
| 2440 S 11th St Terre Haute, IN | 2.0 | 1.0 | 800 | $1,000 | $1.25 | 43d | 1 | 1.47mi |
Listing history 7 events
-
2026-06-19days on market $85,000 Active 6 DOM
-
2026-06-18days on market $85,000 Active 5 DOM
-
2026-06-17days on market $85,000 Active 4 DOM
-
2026-06-16days on market $85,000 Active 3 DOM
-
2026-06-15days on market $85,000 Active 2 DOM
-
2026-06-14remarks 699-char remark
-
2026-06-14$85,000 Active 1 DOM
ⓘ Source: listings_history table (triggers on properties + properties_extension) + one-shot
backfill from property_details.listing_events for pre-trigger history.
Tax reassessment forecast IN · Partial reset (capped growth)
- Current annual tax
- $702 · $59/mo
- Projected year-2 tax
- $712 · $59/mo
- Expected delta
- +$10/yr (+$1/mo · 1.4%)
ⓘ Screening estimate from a state-policy table — verify with the county assessor before closing.
Climate risk First Street
- Flood 1/10 Low FEMA zone X (unshaded) · 0% chance over 30 yrs
- Wildfire 1/10 Low
- Heat 4/10 Moderate 7 d/yr ≥104°F today · 19 d/yr by 30 yrs out
- Wind 2/10 Low 100% chance of damaging wind over 30 yrs
- Air quality 3/10 Moderate 3 unhealthy d/yr today · 4 by 30 yrs out
Nearby sold comps map
Loading sold comps map…
Walkable amenities ~0.75 mi
Loading nearby amenities…
Taxation est. · year 1
- Rental income
- $11,966
- − Mortgage interest
- −$4,761
- − Property taxes
- −$702
- − Insurance
- −$425
- − Repairs & maintenance
- −$957
- − Management
- −$957
- − Depreciation
- −$2,473
- Taxable income
- $1,690
- Est. tax owed @ 24.0%
- −$406
- After-tax cash flow
- $2,571/yr
For passive investors: Depreciation is non-cash, so a rental often shows a tax loss while cash-flowing — sheltering income. Rental losses are passive: they offset passive income freely, and up to $25,000/yr can offset ordinary (W-2) income if you actively participate and your MAGI is under $100k (phasing out to $0 by $150k); unused losses carry forward. On sale, claimed depreciation is recaptured at up to 25%, and gains may owe capital-gains tax (a 1031 exchange can defer both). Figures are a year-1 estimate at your 24.0% rate — not tax advice; consult a CPA.
Schools (NCES district)
- District
- Vigo County School Corporation
- NCES district ID
- 1812090
- Math proficiency
- 32% ▼ -10.00%
- Reading proficiency
- 37% ▼ -8.00%
- Median HH income
- $40,100
- Composite
- 28.97/100
- National rank
- #6625
- State rank
- #202 of 301 in IN
Livability — Terre Haute
- Score
- 75/100
- State rank
- #63
- US rank
- #4186
Category grades
Schools grade is shown separately in the Schools card above.
Census & demographics
- Census place
- Terre Haute, IN
- County
- Vigo County · 91,193 people
- City population
- 91,193
- Metro
- Terre Haute, IN
- Population (ZIP)
- 21,746
- Household income
- $60,565
- Rent vs Own
- Severe rent burden
- 571.0
Population outlook (Vigo County) Hauer SSP2
- Today (2025)
- 106,366 people
- By 2030
- 105,674 · -0.7%
- By 2040
- 103,731 · -2.5%
- By 2050
- 101,200 · -4.9%
- By 2075
- 95,674 · -10.1%
- By 2100
- 85,910 · -19.2%
Race, ethnicity, and origin ACS 2023
- Neighborhood character
- Predominantly White (86%)
- Race & ethnicity
- White 86% Asian 5% Two or more races 4% Black 3% Hispanic / Latino 3%
- Common ancestry
- Slovak 2% Lithuanian 2% Italian 1%
- Foreign-born
- 5% · China, Canada
- Languages at home
- 94% English-only · Chinese 2% Spanish 1% Other Asian/Pacific 1%
Political lean MEDSL · Vigo
- 2024 margin
- R (+18.1) · D 40.0% · R 58.1% · Other 2.0%
- 2008→2024 swing
- -33.9pp toward R · 2008: 15.8pp · 2024: -18.1pp
- All cycles
- 2024: R+18.1 2020: R+14.7 2016: R+15.2 2012: D+0.8 2008: D+15.8
Not yet ingested
- Civics
- —
Market trends
- HPI YoY
- ▼ -69.70%
- Current HPI
- 173.6547
- Rent YoY
- ▲ 4.09%
- Metro
- Terre Haute, IN
- State GDP YoY
- ▲ 2.90%
- F500 in state
- 18
Industry mix (Fortune 500 HQ in IN)
| Industry | F500 HQs | Revenue |
|---|---|---|
| Industrial Machinery | 2 | $37B |
|
||
| Healthcare | 1 | $177B |
|
||
| Pharmaceuticals | 1 | $45B |
|
||
| Metals / Steel | 1 | $18B |
|
||
| Agriculture | 1 | $17B |
|
||
| Packaging | 1 | $12B |
|
||
Price history
+93.6% since first listed5 events — show timeline
- 2026-06-13 Listed $85,000 THAAR
- 2026-06-12 Listed $85,000 MIBOR as Distributed by MLS Grid
- 2021-05-06 Sold (MLS) $48,000 THAAR
- 2020-12-03 Listed $49,900 THAAR
- 2020-03-04 Listed $43,900 THAAR
Property tax history
+6.8%/yrLatest (2024): $702 · +1.3% YoY. Source: county tax records.
Cash-flow waterfall
monthlySold comps — $/sqft
last 12 mo · ≤1 miLoading sold comps…