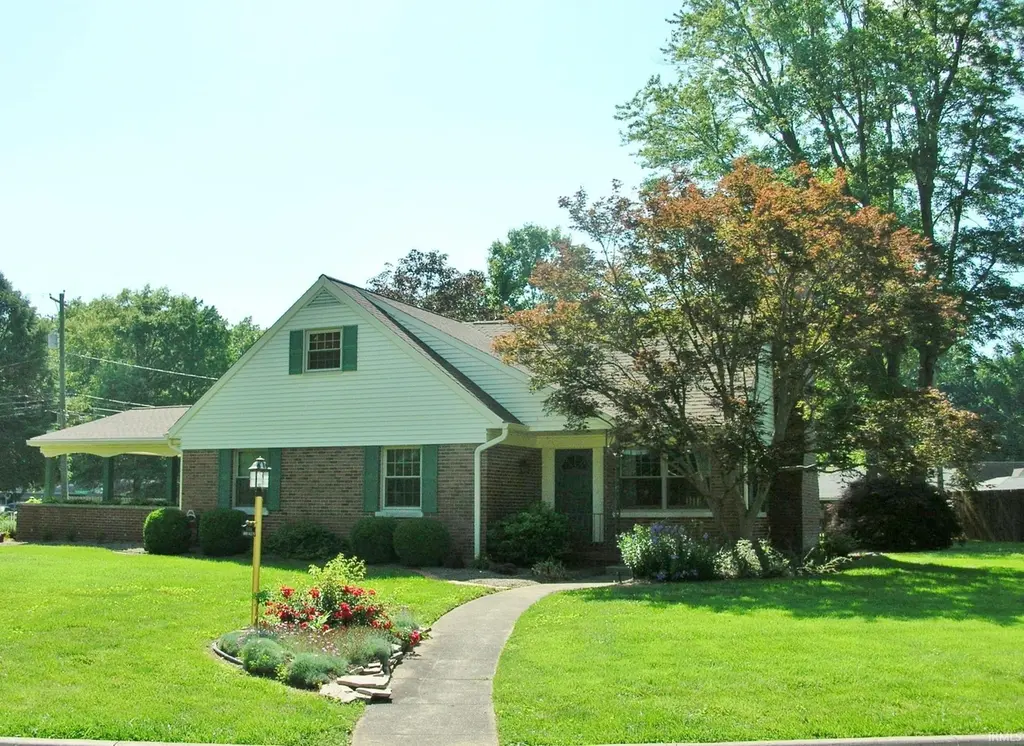
5733 Garden Valley Rd · Evansville, IN
Flood risk 1/10 · Minimal
- FEMA flood zone
- X (unshaded)
- Chance of flooding over 30 yrs
- 0.0%
- Est. flood insurance / yr
- $473 – $860
Fire risk 1/10 · Minimal
- Est. fire insurance / yr
- $717 – $1,331
Heat risk 5/10 · Moderate
- Hot days now (above 106°F)
- 7 days/yr
- Hot days in 30 yrs
- 19 days/yr
Wind risk 2/10 · Minimal
- Chance of severe wind over 30 yrs
- 4.0%
Air-quality risk 4/10 · Minor
- Unhealthy air days now
- 4 days/yr
- Unhealthy air days in 30 yrs
- 6 days/yr
Risk factors via First Street. Map © Google.
Why this score? — see what drove the D grade
The composite is a weighted blend of 9 inputs, each scored 0–100. Each bar is that input's sub-score; the figure is the points it added to the 100-point composite (weight × sub-score).
- Cash flow +12.6/30.0
- ARV discount +7.7/15.0
- Schools +4.9/10.0
- Rent growth +4.7/5.0
- DSCR +3.8/10.0
- Livability +3.2/5.0
- Condition / age +2.5/5.0
- 1% rule +2.4/10.0
- Appreciation +0.0/10.0
$279,900
🖨 Deal sheet 📄 Offer letter ✓ Due diligence
Listing remarks
RARE FIND IN NEWBURGH. .. FULL FINISHED BASEMENT. .. 4-BEDROOMS. .. Located on a Large Corner Extensively Landscaped Lot Between Newburgh and Evansville. .. 4-Bedrooms (2-Main Floor and 2-Upstairs) + 2-Full Baths. .. Large Eat-In Kitchen with All Appliances. .. Dual Washer/Dryers Sets on Main Floor & Lower Level Included. .. Numerous Upgrades Include Roof 2025, Windows 2022, A/C 2024, Hot Water Heater 2020, Whole House Generator 2025 and Much More. .. 2-Fireplaces in Both the Living Room & Basement Family Room. .. Basement also Features a Private Office and Hobby Room. .. Lots & Lots of Real Hardwood Flooring. .. Tons & Tons of Storage in the Huge Attic Area. .. Larg
Key facts
- Large eat in kitchen
- Private office
- Hobby room
Tags
Property features AI
Finance
- HOA & community: No association amenities
Exterior
- Parking: Garage with garage door opener; Off-street parking; Concrete driveway
- Security: Smoke detectors
- Utilities: Public water; Public sewer; Generator for electric; Cable available
- Home design: Single-family, site-built residential home; One story
- Construction: Brick construction; Composition/shingle roof; Block foundation; Home warranty included
- Exterior features: Patio; Corner, level, landscaped lot; Shed(s)
Interior
- Kitchen: Disposal; Dishwasher; Microwave; Refrigerator; Electric cooktop; Exhaust fan
- Bedrooms: Total of 9 rooms (bedroom count not specified)
- Flooring: Hardwood; Carpet; Tile; Vinyl
- Bathrooms: Two full bathrooms; One main-level bathroom
- Heating & cooling: Central air; Ceiling fans; Natural gas heating; Forced air; Floor furnace
- Interior features: Ceiling fans; Eat-in kitchen; Natural woodwork; Built-in features; Window treatments and blinds; Two fireplaces (living room and family room); Partially finished full basement with sump pump
- Laundry & utility: Washer and dryer (stacked option noted); Laundry on main level; Gas water heater
Neighborhood map
What this means for you Summary
Snapshot
- This is a 4-bed/2.0-bath single-family listed at $280k.
Deal economics
- At list price, monthly cash flow is $-34 ($-406/yr) — negative.
- To cash-flow at today's rent, offer at most $274k (2.1% below list).
- To meet the 1% rule (rent ≥ 1% of price), the offer needs to be $207k (25.9% below list).
- Recommended offer: $207k (25.9% below list) — sets the bar for 1% rule.
- Cap rate 6.1% vs local median 4.6% in Evansville — top-decile yield for the area; either an underpriced asset or a hidden risk that comps aren't pricing in. Stress-test before assuming the spread holds.
Location & tenants
- Location reads 63/100 on livability (#416 in IN) — a middle-class / working-renter tenant base. Strengths: cost of living A+, housing A+, health & safety A+; Watch: crime F, commute F, employment D-.
- Warrick County School Corporation (suburban): math 54% / reading 59% proficiency, ranked #24 of 301 in IN (top 8%) — acceptable for families but not a draw, mixed tenant base, ~2y average lease.
- Zoned schools: Newburgh Elementary School (math 70% / reading 63%, grade B+, #65 of 994 statewide, top 7%, 629 students, 32% FRL); Castle South Middle School (math 43% / reading 57%, grade C, #48 of 330 statewide, top 15%, 712 students, 34% FRL); Castle High School (math 56% / reading 80%, grade B, #22 of 369 statewide, top 6%, 1,961 students, 26% FRL).
- Market conditions: Rents rising fast (+8.7%/yr); 383 active listings in the ZIP; 8 comparable units currently listed for rent nearby; rentals lingering (median 44d on market — plan ~5-8 weeks vacancy on turnover, expect pricing pressure); 50% of comp listings sitting > 30 days — soft ceiling on asking rent; solid renter incomes; 249 units permitted in Warrick County in 2024 (0 in 5+ unit buildings).
Forward outlook
- Local home prices are declining (-3.0%/yr); year-one equity from $2k of loan paydown is wiped out by about $8k of value loss. Plan a longer hold.
- Warrick County population projected at +9% by 2050 — modest demand growth; plan on rents tracking national, not racing it.
Negotiation context
- It's been on market 16 days — a 2% lower offer ($276k) is reasonable based on typical stale-listing flexibility.
Risks & watch-outs
- Watch-outs: built in 1952 — expect roof / HVAC / electrical / plumbing capex.
- Climate carrying-cost: extreme-heat days projected 7→19/yr by 2055 (HVAC capex compounding) — expect insurance premiums to compound above CPI over the hold.
Questions for the listing agent
- What do current leases actually rent for vs. the listed asking? Can we see a recent rent roll and the last 12 months of T-12 income?
- Built in 1952 — when were the roof, HVAC, electrical panel, plumbing, and water heater last replaced?
- Is there a deadline driving the sale (1031 exchange, divorce, estate, relocation)? That informs how much negotiation room exists.
- Schools are D-rated, which usually means shorter tenancies and higher turnover. Who's the typical renter profile here, and what's been the actual vacancy rate?
- Crime grade is F in this area — have there been break-ins, vandalism, or insurance claims at this property in the last 3 years? What carrier currently insures it and at what premium?
- The area grade is low — what's the realistic commute time and amenity access for the typical tenant pool here? Any planned neighborhood developments (good or bad) we should know about?
- What's the average days-on-market for RENTAL listings here right now (not sales)? A rising rental-DOM trend means longer vacancies and softer asking-rent achievability than the comps imply.
- What's the recent tenant-quality profile in this submarket — average credit score on applications, eviction rate, late-payment / NSF rate, and stable-employment percentage? A property-management company in the area should have these aggregated.
- How much new for-sale + rental construction is in the pipeline within 1–3 miles? Heavy new supply typically softens prices + rents 12–24 months out; constrained supply supports both.
Investment metrics
- 1% rule
- 0.74% ✗
- Cap rate
- 6.15%
- Cash-on-cash
- -0.52%
- DSCR
- 0.98
- GRM
- 11.2
CMA / ARV
- ARV (on-the-fly)
- $281,228
- Comps found
- 12
Show comp detail 12 sales within ~0.75 mi
| Address | Dist | Beds/Ba | Sqft | Sold | Price | $/sf | Match |
|---|---|---|---|---|---|---|---|
| 5768 Garden Valley Rd | 0.06mi | 3/2.0 (-1) | 1,677 (-0%) | 4mo | $280,000 | $167 | 88 |
| 6000 Glen Oak Ct | 0.32mi | 3/2.0 (-1) | 1,718 (+2%) | 7mo | $325,000 | $189 | 71 |
| 5799 Jeffrey Ln | 0.37mi | 3/2.0 (-1) | 1,642 (-2%) | 7mo | $125,000 | $76 | 68 |
| 5833 Lenbeck Rd | 0.45mi | 4/2.0 | 1,572 (-7%) | 2mo | $222,500 | $142 | 66 |
| 5866 Jeffrey Ln | 0.34mi | 3/2.0 (-1) | 1,580 (-6%) | 4mo | $180,100 | $114 | 66 |
| 10699 Cricklewood Dr | 0.31mi | 3/1.5 (-1) | 1,747 (+4%) | 12mo | $235,000 | $135 | 62 |
| 10599 Gettysburg Dr | 0.62mi | 3/2.0 (-1) | 1,674 (-1%) | 5mo | $289,000 | $173 | 61 |
| 10166 Marquette St | 0.70mi | 3/2.0 (-1) | 1,614 (-4%) | 1mo | $289,900 | $180 | 54 |
| 10744 Willow Creek Rd | 0.33mi | 3/2.0 (-1) | 1,850 (+10%) | 11mo | $279,900 | $151 | 54 |
| 10555 Brookside Dr | 0.30mi | 3/2.0 (-1) | 1,491 (-12%) | 10mo | $265,000 | $178 | 54 |
| 5988 Willow Brook Ct | 0.29mi | 3/2.0 (-1) | 1,432 (-15%) | 9mo | $266,000 | $186 | 50 |
| 6077 Grand River Rd | 0.55mi | 3/1.0 (-1) | 1,930 (+15%) | 1mo | $240,000 | $124 | 40 |
Match score weights: distance 35% · size 25% · config 20% · recency 20%. Top-matched comps best support the ARV.
Projected returns pro-forma
-3.0% appreciation · 8.0% rent growth · sell at horizon
- IRR
- -12.5%
- Equity multiple
- 0.53×
- Total profit
- $-36,676
- Equity at exit
- $41,734
- IRR
- 2.2%
- Equity multiple
- 1.19×
- Total profit
- $14,665
- Equity at exit
- $24,201
Cash invested: $78,372 (down + closing). Projections, not guarantees.
Landlord ↔ Tenant lean methodology
- Overall (STATE)
- 90 Strongly Landlord-Friendly
- State Indiana
- 90 Strongly Landlord-Friendly · R+11
- County
- — inherits STATE
- City
- — inherits STATE
ZIP-level market 47630
- Rents YoY
- 8.7%
- Active inventory
- 383
- Price-to-rent
- 11.2×
Monthly cashflow live
- Estimated rent
- $2,075 high interval (Pro) →
- Mortgage (P&I)
- −$1,468
- Tax from tax record
- −$88 /mo · $1,061/yr
- Insurance
- −$117
- HOA
- −$0
- Vacancy / Maint / Mgmt
- −$436
- Net cashflow
- $-34
Break-even live
UW: 25.0% down · 7.5% · 30yr · 1.5% tax · 5.0% vac · 8.0% maint · 8.0% mgmt
Financing live
Cash to close
- Down payment
- $69,975
- Closing costs
- $8,397
- Reserves months
- —
- Total cash needed
- —
Loan-product check · same deal, 3 products live
Conventional
25% down · 7.5% · 30yr
- Down + closing
- —
- Monthly P&I
- —
- Monthly cashflow
- —
- DSCR
- —
- Eligible?
- —
Personal DTI + credit; lowest rate.
DSCR
20% down · 8.5% · 30yr
- Down + closing
- —
- Monthly P&I
- —
- Monthly cashflow
- —
- DSCR
- —
- Eligible?
- —
No personal income docs; deal must DSCR.
Hard money
10% down · 12.0% · 12mo
- Down + closing
- —
- Monthly P&I
- —
- Monthly cashflow
- —
- DSCR
- —
- Eligible?
- —
Short-term bridge; refi at stabilization.
Rent comps 8 comps
| Address | Beds | Baths | Sqft | Rent | $/sqft | DOM | Units | Dist |
|---|---|---|---|---|---|---|---|---|
| 5879 Riverwalk Cir Newburgh, IN | 3.0 | 2.0 | 1128 | $1,600 | $1.42 | 21d | 1 | 0.46mi |
| 6166 River Bluff Dr Newburgh, IN | 3.0 | 2.0 | 1282 | $2,500 | $1.95 | 43d | 1 | 0.47mi |
| 9895 Cove Point Ct Newburgh, IN | 3.0 | 2.0 | 1307 | $1,950 | $1.49 | 21d | 1 | 0.50mi |
| 10611 Gettysburg Dr Newburgh, IN | 4.0 | 3.0 | 2214 | $2,200 | $0.99 | 43d | 1 | 0.63mi |
| 4920 Penrose Dr Newburgh, IN | 3.0 | 2.0 | 1250 | $1,900 | $1.52 | 43d | 1 | 0.88mi |
| 10686 Fall Creek Dr Newburgh, IN | 3.0 | 2.0 | 1436 | $1,950 | $1.36 | 13d | 1 | 0.89mi |
| 4799 Imperial Dr Newburgh, IN | 3.0 | 2.0 | 1370 | $1,975 | $1.44 | 43d | 1 | 0.97mi |
| 7501 E Powell Ave Evansville, IN | 3.0 | 1.0 | 1100 | $1,650 | $1.50 | 21d | 1 | 1.43mi |
Listing history 11 events
-
2026-06-18days on market $279,900 Active 16 DOM
-
2026-06-17days on market $279,900 Active 15 DOM
-
2026-06-16days on market $279,900 Active 14 DOM
-
2026-06-15days on market $279,900 Active 13 DOM
-
2026-06-14days on market $279,900 Active 11 DOM
-
2026-06-13days on market $279,900 Active 10 DOM
-
2026-06-10days on market $279,900 Active 8 DOM
-
2026-06-09days on market $279,900 Active 7 DOM
-
2026-06-08days on market $279,900 Active 6 DOM
-
2026-06-07remarks 683-char remark
-
2026-06-07$279,900 Active 5 DOM
ⓘ Source: listings_history table (triggers on properties + properties_extension) + one-shot
backfill from property_details.listing_events for pre-trigger history.
Tax reassessment forecast IN · Partial reset (capped growth)
- Current annual tax
- $1,061 · $88/mo
- Projected year-2 tax
- $1,720 · $143/mo
- Expected delta
- +$659/yr (+$55/mo · 62.2%)
ⓘ Screening estimate from a state-policy table — verify with the county assessor before closing.
Climate risk First Street
- Flood 1/10 Low FEMA zone X (unshaded) · 0% chance over 30 yrs
- Wildfire 1/10 Low
- Heat 5/10 Major 7 d/yr ≥106°F today · 19 d/yr by 30 yrs out
- Wind 2/10 Low 4% chance of damaging wind over 30 yrs
- Air quality 4/10 Moderate 4 unhealthy d/yr today · 6 by 30 yrs out
Nearby sold comps map
Loading sold comps map…
Walkable amenities ~0.75 mi
Loading nearby amenities…
Taxation est. · year 1
- Rental income
- $24,896
- − Mortgage interest
- −$15,679
- − Property taxes
- −$1,061
- − Insurance
- −$1,400
- − Repairs & maintenance
- −$1,992
- − Management
- −$1,992
- − Depreciation
- −$8,143
- Taxable loss
- −$5,369
- Est. tax savings @ 24.0%
- +$1,288
- After-tax cash flow
- $882/yr
For passive investors: Depreciation is non-cash, so a rental often shows a tax loss while cash-flowing — sheltering income. Rental losses are passive: they offset passive income freely, and up to $25,000/yr can offset ordinary (W-2) income if you actively participate and your MAGI is under $100k (phasing out to $0 by $150k); unused losses carry forward. On sale, claimed depreciation is recaptured at up to 25%, and gains may owe capital-gains tax (a 1031 exchange can defer both). Figures are a year-1 estimate at your 24.0% rate — not tax advice; consult a CPA.
Schools (NCES district)
- District
- Warrick County School Corporation
- NCES district ID
- 1812390
- Math proficiency
- 54% ▼ -8.00%
- Reading proficiency
- 59% ▼ -6.00%
- Median HH income
- $62,801
- Composite
- 49.38/100
- National rank
- #2014
- State rank
- #24 of 301 in IN
Livability — Evansville
- Score
- 63/100
- State rank
- #416
- US rank
- #15047
Category grades
Schools grade is shown separately in the Schools card above.
Census & demographics
- County
- Warrick County · 39,818 people
- City population
- 146,793
- Metro
- Evansville, IN-KY
- Population (ZIP)
- 39,818
- Household income
- $94,162
- Rent vs Own
- Severe rent burden
- 770.0
Population outlook (Warrick County) Hauer SSP2
- Today (2025)
- 66,569 people
- By 2030
- 68,404 · +2.8%
- By 2040
- 71,131 · +6.9%
- By 2050
- 72,743 · +9.3%
- By 2075
- 76,088 · +14.3%
- By 2100
- 72,261 · +8.6%
Race, ethnicity, and origin ACS 2023
- Neighborhood character
- Predominantly White (88%)
- Race & ethnicity
- White 88% Two or more races 5% Black 3% Hispanic / Latino 3% Asian 3%
- Common ancestry
- Italian 3% Lithuanian 2% Romanian 2%
- Foreign-born
- 5% · Canada, China
- Languages at home
- 96% English-only · Spanish 2% Other Indo-European 1%
Political lean MEDSL · Warrick
- 2024 margin
- Solid R (+30.2) · D 34.1% · R 64.3% · Other 1.5%
- 2008→2024 swing
- -17.4pp toward R · 2008: -12.8pp · 2024: -30.2pp
- All cycles
- 2024: R+30.2 2020: R+27.8 2016: R+33.9 2012: R+26.6 2008: R+12.8
Not yet ingested
- Civics
- —
Market trends
- HPI YoY
- ▼ -187.44%
- Current HPI
- 185.7643
- Rent YoY
- ▲ 8.69%
- Metro
- Evansville, IN-KY
- State GDP YoY
- ▲ 2.90%
- F500 in state
- 18
Industry mix (Fortune 500 HQ in IN)
| Industry | F500 HQs | Revenue |
|---|---|---|
| Industrial Machinery | 2 | $37B |
|
||
| Healthcare | 1 | $177B |
|
||
| Pharmaceuticals | 1 | $45B |
|
||
| Metals / Steel | 1 | $18B |
|
||
| Agriculture | 1 | $17B |
|
||
| Packaging | 1 | $12B |
|
||
Price history
1 event — show timeline
- 2026-06-02 Listed $279,900 IRMLS
Property tax history
+8.0%/yrLatest (2024): $1,061 · +15.7% YoY. Source: county tax records.
Cash-flow waterfall
monthlySold comps — $/sqft
last 12 mo · ≤1 miLoading sold comps…