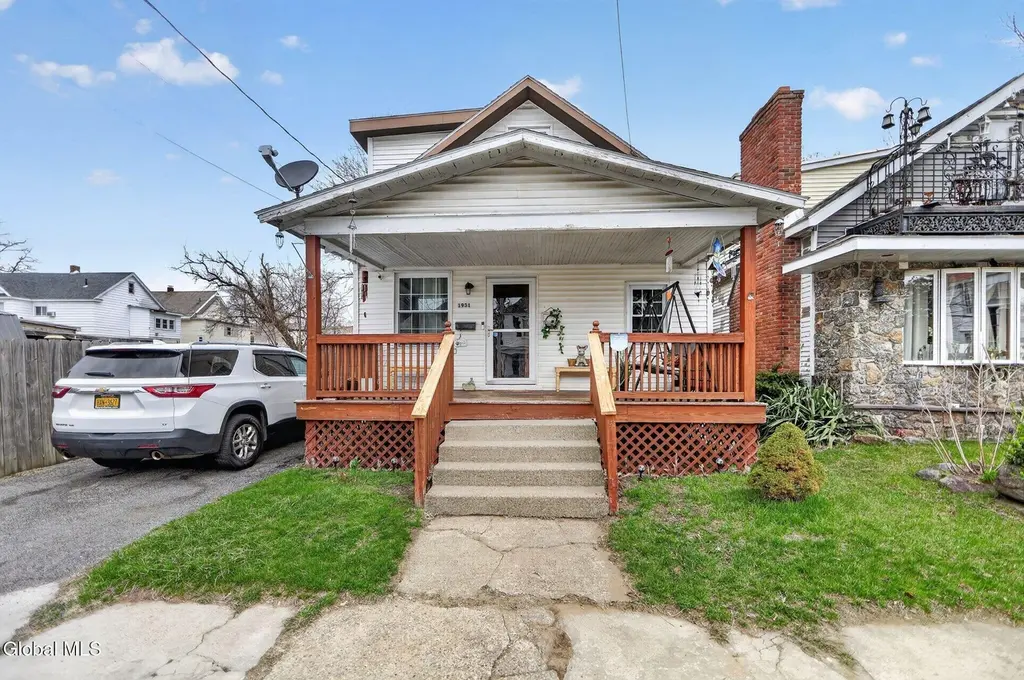
1931 Jerome Ave · Schenectady, NY
Flood risk 1/10 · Minimal
- FEMA flood zone
- X (unshaded)
- Chance of flooding over 30 yrs
- 0.0%
- Est. flood insurance / yr
- $473 – $860
Fire risk 3/10 · Minor
- Est. fire insurance / yr
- $691 – $1,283
Heat risk 4/10 · Minor
- Hot days now (above 96°F)
- 7 days/yr
- Hot days in 30 yrs
- 16 days/yr
Wind risk 3/10 · Minor
- Chance of severe wind over 30 yrs
- 5.0%
Air-quality risk 1/10 · Minimal
- Unhealthy air days now
- 0 days/yr
- Unhealthy air days in 30 yrs
- 0 days/yr
Risk factors via First Street. Map © Google.
Why this score? — see what drove the C+ grade
The composite is a weighted blend of 9 inputs, each scored 0–100. Each bar is that input's sub-score; the figure is the points it added to the 100-point composite (weight × sub-score).
- Cash flow +22.7/30.0
- ARV discount +15.0/15.0
- DSCR +7.3/10.0
- 1% rule +5.9/10.0
- Livability +3.9/5.0
- Schools +3.0/10.0
- Rent growth +2.5/5.0
- Condition / age +2.5/5.0
- Appreciation +0.0/10.0
$169,000
🖨 Deal sheet 📄 Offer letter ✓ Due diligence
Listing remarks MLS
Look at this gorgeously amazing Bungalow with lots of updates! Everything is done! Just move right in and enjoy! Expanded kitchen! Large living room! Two generously sized bedrooms on first floor! Large Master Suite with updated full bath on 2nd floor! New Front porch, front door and back deck, with hot tub! Must see! Priced to sell now! Excellent Condition
Key facts
- Private driveway
- Full basement
- Back deck
Tags
Property features AI
Exterior
- Parking: Driveway with space for 3 vehicles
- Utilities: Public water; Public sewer
- Home design: Single family residence; Living area approximately 1,221
- Construction: Vinyl siding; Shingle (asphalt) roof
- Exterior features: Deck; Enclosed porch; Front porch; Porch; Paved driveway; Wood backyard fencing; Other exterior features
Interior
- Kitchen: Convection oven; Range; Refrigerator
- Bedrooms: Primary bedroom on the first floor
- Flooring: Tile; Wood; Bamboo; Concrete; Hardwood
- Bathrooms: One full bathroom on the first floor; One half bathroom on the first floor
- Heating & cooling: Hot water heating (natural gas); Central air conditioning
- Interior features: Full unfinished basement; 5 total rooms
- Laundry & utility: Washer and dryer in basement
Neighborhood map
What this means for you Summary
Snapshot
- This is a 3-bed/1.5-bath single-family listed at $169k.
Deal economics
- At list price, monthly cash flow is $291 ($3k/yr) — positive.
- The deal already cash-flows at list — no discount required.
- Meets the 1% rule at list price ($2k rent vs $169k).
- Cap rate 8.4% vs local median 6.3% in Schenectady — top-decile yield for the area; either an underpriced asset or a hidden risk that comps aren't pricing in. Stress-test before assuming the spread holds.
Location & tenants
- Location reads 78/100 on livability (#167 in NY, #2,597 nationally) — a middle-class / working-renter tenant base. Strengths: commute A+, health & safety A+, cost of living A; Watch: employment D+, crime F.
- Schenectady City School District (urban): math 38% / reading 34% proficiency, ranked #556 of 590 in NY (top 94%) — families likely to look elsewhere, expect single-tenant / working-renter base with shorter leases; 65% free/reduced lunch — lower-income household profile, screen leases tightly.
- Zoned schools: Schenectady High School (math 75% / reading 90%, grade A, #446 of 1,100 statewide, top 41%, 2,743 students, 71% FRL).
- Zoned-school proficiency averages 82% at this address vs 36% district-wide (+46 pts) — the actual schools serving this property are materially stronger than the Schenectady City School District average implies; a family-tenant draw the district grade alone would hide.
- Market conditions: 181 active listings in the ZIP; 10 comparable units currently listed for rent nearby; rentals at typical pace (median 14d on market — plan ~3-4 weeks tenant-placement turnaround); solid renter incomes; 154 units permitted in Schenectady County in 2024 (54 in 5+ unit buildings).
Forward outlook
- Local home prices are declining (-3.0%/yr); year-one equity from $1k of loan paydown is wiped out by about $5k of value loss. Plan a longer hold.
- Schenectady County population projected to shrink 4% by 2050 — rents likely to lag national; underwrite the cash flow, not the appreciation.
Negotiation context
- Only 8 days on market — expect competitive offers; lowballing is unlikely to land.
- 5 sale attempts since 26y ago with the ask held roughly flat each time — persistent listings suggest the price (not the market) is what's stuck; bring a comps-based counter.
- Current owner paid $65k; list at $169k implies a 160% gain — meaningful room to come down on a strong offer.
Risks & watch-outs
- Watch-outs: built in 1925 — expect roof / HVAC / electrical / plumbing capex.
Questions for the listing agent
- Built in 1925 — when were the roof, HVAC, electrical panel, plumbing, and water heater last replaced?
- Is there a deadline driving the sale (1031 exchange, divorce, estate, relocation)? That informs how much negotiation room exists.
- Crime grade is F in this area — have there been break-ins, vandalism, or insurance claims at this property in the last 3 years? What carrier currently insures it and at what premium?
- What's the average days-on-market for RENTAL listings here right now (not sales)? A rising rental-DOM trend means longer vacancies and softer asking-rent achievability than the comps imply.
- What's the recent tenant-quality profile in this submarket — average credit score on applications, eviction rate, late-payment / NSF rate, and stable-employment percentage? A property-management company in the area should have these aggregated.
- How much new for-sale + rental construction is in the pipeline within 1–3 miles? Heavy new supply typically softens prices + rents 12–24 months out; constrained supply supports both.
Investment metrics
- 1% rule
- 1.09% ✓
- Cap rate
- 8.36%
- Cash-on-cash
- 7.39%
- DSCR
- 1.33
- GRM
- 7.6
CMA / ARV
- ARV (on-the-fly)
- $233,211
- Comps found
- 12
Show comp detail 12 sales within ~0.75 mi
| Address | Dist | Beds/Ba | Sqft | Sold | Price | $/sf | Match |
|---|---|---|---|---|---|---|---|
| 818 Cutler St | 0.45mi | 3/1.5 | 1,224 (+0%) | 0mo | $165,000 | $135 | 79 |
| 1201 Helderberg Ave Ave | 0.22mi | 3/2.0 | 1,271 (+4%) | 2mo | $252,000 | $198 | 79 |
| 417 Cora St | 0.45mi | 3/1.0 | 1,248 (+2%) | 0mo | $185,000 | $148 | 73 |
| 1337 8th Ave | 0.53mi | 4/2.0 (+1) | 1,193 (-2%) | 1mo | $132,500 | $111 | 64 |
| 577 Ontario St | 0.35mi | 3/1.0 | 1,100 (-10%) | 2mo | $255,000 | $232 | 64 |
| 1084 Webster St | 0.57mi | 3/2.0 | 1,282 (+5%) | 2mo | $230,000 | $179 | 61 |
| 1100 Laura St | 0.52mi | 3/1.5 | 1,100 (-10%) | 0mo | $295,000 | $268 | 59 |
| 837 Harrison Ave | 0.41mi | 3/2.0 | 1,377 (+13%) | 0mo | $240,000 | $174 | 58 |
| 1067 Cutler St | 0.43mi | 2/1.5 (-1) | 1,352 (+11%) | 2mo | $100,000 | $74 | 56 |
| 473 Bruno St | 0.72mi | 3/1.0 | 1,144 (-6%) | 2mo | $246,500 | $215 | 52 |
| 338 Eleanor St | 0.61mi | 3/1.5 | 1,366 (+12%) | 1mo | $261,000 | $191 | 51 |
| 2110 Nahant St | 0.75mi | 4/2.0 (+1) | 1,400 (+15%) | 0mo | $332,400 | $237 | 33 |
Match score weights: distance 35% · size 25% · config 20% · recency 20%. Top-matched comps best support the ARV.
Projected returns pro-forma
-3.0% appreciation · 3.0% rent growth · sell at horizon
- IRR
- -5.0%
- Equity multiple
- 0.81×
- Total profit
- $-8,809
- Equity at exit
- $25,198
- IRR
- 4.7%
- Equity multiple
- 1.35×
- Total profit
- $16,327
- Equity at exit
- $14,612
Cash invested: $47,320 (down + closing). Projections, not guarantees.
Landlord ↔ Tenant lean methodology
- Overall (STATE)
- 15 Strongly Tenant-Friendly
- State New York
- 15 Strongly Tenant-Friendly · D+10
- County
- — inherits STATE
- City
- — inherits STATE
ZIP-level market 12306
- Home prices YoY
- -23.8%
- Active inventory
- 181
- Price-to-rent
- 7.6×
Monthly cashflow live
- Estimated rent
- $1,847 high interval (Pro) →
- Mortgage (P&I)
- −$886
- Tax est. 1.5%
- −$211 /mo · $2,535/yr
- Insurance
- −$70
- HOA
- −$0
- Vacancy / Maint / Mgmt
- −$388
- Net cashflow
- $291
Break-even live
UW: 25.0% down · 7.5% · 30yr · 1.5% tax · 5.0% vac · 8.0% maint · 8.0% mgmt
Financing live
Cash to close
- Down payment
- $42,250
- Closing costs
- $5,070
- Reserves months
- —
- Total cash needed
- —
Loan-product check · same deal, 3 products live
Conventional
25% down · 7.5% · 30yr
- Down + closing
- —
- Monthly P&I
- —
- Monthly cashflow
- —
- DSCR
- —
- Eligible?
- —
Personal DTI + credit; lowest rate.
DSCR
20% down · 8.5% · 30yr
- Down + closing
- —
- Monthly P&I
- —
- Monthly cashflow
- —
- DSCR
- —
- Eligible?
- —
No personal income docs; deal must DSCR.
Hard money
10% down · 12.0% · 12mo
- Down + closing
- —
- Monthly P&I
- —
- Monthly cashflow
- —
- DSCR
- —
- Eligible?
- —
Short-term bridge; refi at stabilization.
Rent comps 10 comps
| Address | Beds | Baths | Sqft | Rent | $/sqft | DOM | Units | Dist |
|---|---|---|---|---|---|---|---|---|
| 2030 Euclid Ave Schenectady, NY | 3.0 | 1.0 | 1300 | $2,000 | $1.54 | 18d | 1 | 0.27mi |
| 418 Third St Schenectady, NY | 3.0 | 1.0 | 1000 | $2,200 | $2.20 | 13d | 1 | 0.45mi |
| 1826 Campbell Ave Schenectady, NY | 3.0 | 1.0 | 1000 | $1,600 | $1.60 | 13d | 1 | 0.47mi |
| 2007 Campbell Ave Schenectady, NY | 3.0 | 1.0 | 1272 | $1,600 | $1.26 | 13d | 1 | 0.52mi |
| 1120 Pleasant St Schenectady, NY | 3.0 | 1.0 | 1000 | $1,500 | $1.50 | 14d | 1 | 0.67mi |
| 1130 Pleasant St Schenectady, NY | 2.0 | 1.0 | 1069 | $1,300 | $1.22 | 43d | 1 | 0.67mi |
| 611 Cramer Ave Schenectady, NY | 3.0 | 1.0 | 1100 | $2,295 | $2.09 | 13d | 1 | 0.67mi |
| 1121 10th Ave Schenectady, NY | 2.0 | 1.0 | 800 | $1,250 | $1.56 | 23d | 1 | 0.82mi |
| 1729 Ferguson St Schenectady, NY | 2.0 | 1.0 | 850 | $1,730 | $2.04 | 14d | 1 | 1.02mi |
| 918 Delamont Ave Schenectady, NY | 3.0 | 1.0 | 1192 | $1,600 | $1.34 | 23d | 1 | 1.35mi |
Listing history 12 events
-
2026-05-01status Pending
-
2026-04-23$169,000 Active
-
2015-08-07soldstatus $65,000 358-char remark
Show marketing remark (358 chars)
Look at this gorgeously amazing Bungalow with lots of updates! Everything is done! Just move right in and enjoy! Expanded kitchen! Large living room! Two generously sized bedrooms on first floor! Large Master Suite with updated full bath on 2nd floor! New Front porch, front door and back deck, with hot tub! Must see! Priced to sell now! Excellent Condition
-
2015-05-24historical 358-char remark
Show marketing remark (358 chars)
Look at this gorgeously amazing Bungalow with lots of updates! Everything is done! Just move right in and enjoy! Expanded kitchen! Large living room! Two generously sized bedrooms on first floor! Large Master Suite with updated full bath on 2nd floor! New Front porch, front door and back deck, with hot tub! Must see! Priced to sell now! Excellent Condition
-
2015-01-13$69,900 358-char remark
Show marketing remark (358 chars)
Look at this gorgeously amazing Bungalow with lots of updates! Everything is done! Just move right in and enjoy! Expanded kitchen! Large living room! Two generously sized bedrooms on first floor! Large Master Suite with updated full bath on 2nd floor! New Front porch, front door and back deck, with hot tub! Must see! Priced to sell now! Excellent Condition
-
2014-11-19historical
-
2014-10-28$99,900
-
2009-10-01soldstatus $95,000
-
2009-08-17historical
-
2009-05-24$107,500
-
2001-08-13soldstatus $58,500
-
2000-11-28$59,900
ⓘ Source: listings_history table (triggers on properties + properties_extension) + one-shot
backfill from property_details.listing_events for pre-trigger history.
Climate risk First Street
- Flood 1/10 Low FEMA zone X (unshaded) · 0% chance over 30 yrs
- Wildfire 3/10 Moderate
- Heat 4/10 Moderate 7 d/yr ≥96°F today · 16 d/yr by 30 yrs out
- Wind 3/10 Moderate 5% chance of damaging wind over 30 yrs
- Air quality 1/10 Low 0 unhealthy d/yr today · 0 by 30 yrs out
Nearby sold comps map
Loading sold comps map…
Walkable amenities ~0.75 mi
Loading nearby amenities…
Taxation est. · year 1
- Rental income
- $22,164
- − Mortgage interest
- −$9,467
- − Property taxes
- −$2,535
- − Insurance
- −$845
- − Repairs & maintenance
- −$1,773
- − Management
- −$1,773
- − Depreciation
- −$4,916
- Taxable income
- $855
- Est. tax owed @ 24.0%
- −$205
- After-tax cash flow
- $3,290/yr
For passive investors: Depreciation is non-cash, so a rental often shows a tax loss while cash-flowing — sheltering income. Rental losses are passive: they offset passive income freely, and up to $25,000/yr can offset ordinary (W-2) income if you actively participate and your MAGI is under $100k (phasing out to $0 by $150k); unused losses carry forward. On sale, claimed depreciation is recaptured at up to 25%, and gains may owe capital-gains tax (a 1031 exchange can defer both). Figures are a year-1 estimate at your 24.0% rate — not tax advice; consult a CPA.
Schools (NCES district)
- District
- Schenectady City School District
- NCES district ID
- 3626010
- Math proficiency
- 38% ▲ 12.00%
- Reading proficiency
- 34% ▲ 2.00%
- Median HH income
- $39,453
- Composite
- 30.2/100
- National rank
- #6309
- State rank
- #556 of 590 in NY
Livability — Schenectady
- Score
- 78/100
- State rank
- #167
- US rank
- #2597
Category grades
Schools grade is shown separately in the Schools card above.
Census & demographics
- Census place
- Schenectady, NY
- County
- Schenectady County · 141,369 people
- City population
- 141,369
- Metro
- Albany-Schenectady-Troy, NY
- Population (ZIP)
- 27,865
- Household income
- $83,202
- Rent vs Own
- Severe rent burden
- 629.0
Population outlook (Schenectady County) Hauer SSP2
- Today (2025)
- 155,046 people
- By 2030
- 154,322 · -0.5%
- By 2040
- 151,796 · -2.1%
- By 2050
- 148,621 · -4.1%
- By 2075
- 141,229 · -8.9%
- By 2100
- 126,014 · -18.7%
Race, ethnicity, and origin ACS 2023
- Neighborhood character
- Predominantly White (78%)
- Race & ethnicity
- White 78% Two or more races 8% Black 7% Hispanic / Latino 7% Asian 3%
- Hispanic origin (detail)
- Puerto Rican 4% Dominican 1%
- Common ancestry
- Romanian 7% Lithuanian 5% Iranian 3%
- Foreign-born
- 6% · Canada
- Languages at home
- 94% English-only · Spanish 3% Other Indo-European 1% Other Asian/Pacific 1%
Political lean MEDSL · Schenectady
- 2024 margin
- D (+10.8) · D 55.4% · R 44.6%
- 2008→2024 swing
- -1.8pp toward R · 2008: 12.7pp · 2024: 10.8pp
- All cycles
- 2024: D+10.8 2020: D+15.7 2016: D+5.8 2012: D+15.4 2008: D+12.7
Not yet ingested
- Civics
- —
Market trends
- HPI YoY
- ▼ -91.35%
- Current HPI
- 292.1229
- Rent YoY
- —
- Metro
- Albany-Schenectady-Troy, NY
- State GDP YoY
- ▲ 2.60%
- F500 in state
- 92
Industry mix (Fortune 500 HQ in NY)
| Industry | F500 HQs | Revenue |
|---|---|---|
| Financial Services | 10 | $950B |
|
||
| Consumer Goods | 9 | $162B |
|
||
| Insurance | 4 | $225B |
|
||
| Telecommunications | 2 | $144B |
|
||
| Pharmaceuticals | 2 | $112B |
|
||
| Media / Entertainment | 2 | $69B |
|
||
Price history
+182.1% since first listed12 events — show timeline
- 2026-05-01 Pending — Global MLS
- 2026-04-23 Listed $169,000 Global MLS
- 2015-08-07 Sold (MLS) $65,000 Global MLS
- 2015-05-24 Listing Removed — Global MLS
- 2015-01-13 Listed $69,900 Global MLS
- 2014-11-19 Listing Removed — Global MLS
- 2014-10-28 Listed $99,900 Global MLS
- 2009-10-01 Sold (MLS) $95,000 Global MLS
- 2009-08-17 Listing Removed — Global MLS
- 2009-05-24 Listed $107,500 Global MLS
- 2001-08-13 Sold (MLS) $58,500 Global MLS
- 2000-11-28 Listed $59,900 Global MLS
Cash-flow waterfall
monthlySold comps — $/sqft
last 12 mo · ≤1 miLoading sold comps…