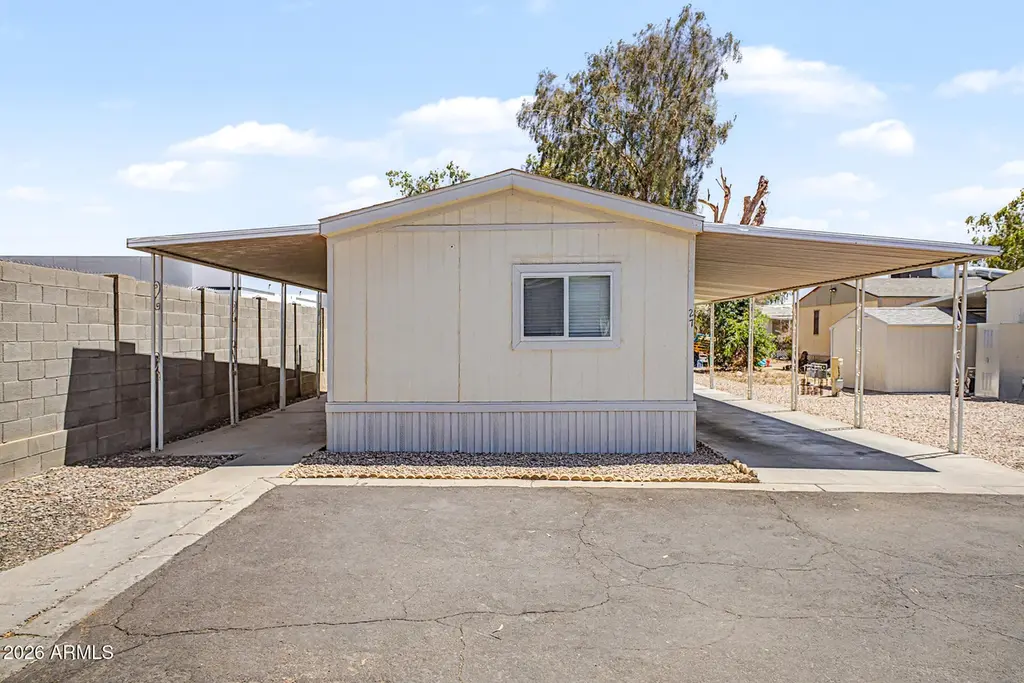
1221 N Dysart Rd #27 · Avondale, AZ
Flood risk 1/10 · Minimal
- FEMA flood zone
- X (shaded)
- Chance of flooding over 30 yrs
- 0.0%
- Est. flood insurance / yr
- $507 – $1,088
Fire risk 5/10 · Moderate
- Est. fire insurance / yr
- $610 – $1,132
Heat risk 9/10 · Severe
- Hot days now (above 113°F)
- 6 days/yr
- Hot days in 30 yrs
- 15 days/yr
Wind risk 1/10 · Minimal
- Chance of severe wind over 30 yrs
- —
Air-quality risk 2/10 · Minimal
- Unhealthy air days now
- 0 days/yr
- Unhealthy air days in 30 yrs
- 1 days/yr
Risk factors via First Street. Map © Google.
Why this score? — see what drove the B grade
The composite is a weighted blend of 9 inputs, each scored 0–100. Each bar is that input's sub-score; the figure is the points it added to the 100-point composite (weight × sub-score).
- Cash flow +30.0/30.0
- 1% rule +10.0/10.0
- DSCR +10.0/10.0
- ARV discount +8.5/15.0
- Condition / age +4.0/5.0
- Livability +3.6/5.0
- Schools +2.8/10.0
- Rent growth +2.6/5.0
- Appreciation +0.0/10.0
$69,000
🖨 Deal sheet 📄 Offer letter ✓ Due diligence
Listing remarks
Welcome to this adorable 2-bedroom manufactured home in Estrella Home Community! You'll first notice the cozy covered patio where you can enjoy your morning coffee and the convenient carport parking. Inside, you'll find an inviting great room filled with natural light, featuring vaulted ceilings that make it feel even more spacious, tile flooring, window blinds, and a soothing palette. Spotless kitchen equipped with white shaker cabinets adorned with crown molding, mosaic backsplash, a quartz peninsula with a breakfast bar, perfect for casual meals, and essential appliances. Relax after a long day in the main suite, offering a private bathroom and a walk-in closet. Laundry room with attache
Key facts
- Covered patio
- Carport parking
- Window blinds
Tags
Property features AI
Finance
- HOA & community: No association fees; Land lease with a monthly fee of $795; Community pool
Exterior
- Parking: 2 covered parking spaces; 2 carport spaces
- Utilities: City water; Public sewer
- Home design: Manufactured/Mobile home; Leasehold ownership
- Construction: Vertical siding; Wood frame construction; Painted exterior; Composition roof; Building area reported by owner
- Exterior features: Block fencing; Dirt backyard; Gravel/stone front and back; Private maintained road; City view
Interior
- Kitchen: Built-in microwave; Refrigerator; Disposal
- Bedrooms: 2 possible bedrooms
- Flooring: Tile
- Bathrooms: 2 full bathrooms
- Heating & cooling: Has heating; Has cooling; Ceiling fan(s)
- Interior features: High-speed internet; Breakfast bar; No interior steps; Vaulted ceilings; Master bedroom with 3/4 bath; Bath lever faucets (accessibility)
- Laundry & utility: Indoor laundry; Gas dryer hookup; Washer/dryer hookups only
Neighborhood map
What this means for you Summary
Snapshot
- This is a 2-bed/2.0-bath manufactured listed at $69k. Condition is rated good.
Deal economics
- At list price, monthly cash flow is $761 ($9k/yr) — positive.
- The deal already cash-flows at list — no discount required.
- Meets the 1% rule at list price ($2k rent vs $69k).
- Recommended offer: $68k (1.5% below list) — sets the bar for market timing.
- Cap rate 19.5% vs local median 3.4% in Avondale — top-decile yield for the area; either an underpriced asset or a hidden risk that comps aren't pricing in. Stress-test before assuming the spread holds.
Location & tenants
- Location reads 72/100 on livability (#29 in AZ) — a middle-class / working-renter tenant base. Strengths: housing A+, commute A; Watch: health & safety C-, crime D+, amenities F.
- Agua Fria Union High School District (4289) (suburban): math 24% / reading 37% proficiency, ranked #99 of 249 in AZ (top 40%) — families likely to look elsewhere, expect single-tenant / working-renter base with shorter leases.
- Zoned schools: Agua Fria High School (math 15% / reading 26%, grade F, #222 of 381 statewide, top 59%, 1,652 students, 62% FRL).
- Market conditions: Rents flat; 305 active listings in the ZIP; 26 comparable units currently listed for rent nearby; rentals leasing fast (median 2d on market — plan ~1-2 weeks tenant-placement turnaround); solid renter incomes; 36,011 units permitted in Maricopa County in 2024 (12,801 in 5+ unit buildings).
Forward outlook
- Local home prices are declining (-3.0%/yr); year-one equity from $477 of loan paydown is wiped out by about $2k of value loss. Plan a longer hold.
- Maricopa County population projected at +38% by 2050 — long-run rental-demand tailwind backs the buy-and-hold thesis.
- At projected returns (-3.0% appreciation + 0.3% rent growth), your $19k cash investment doubles in ~3 years — after that, you're playing with house money.
Negotiation context
- It's been on market 15 days — a 2% lower offer ($68k) is reasonable based on typical stale-listing flexibility.
Risks & watch-outs
- Climate carrying-cost: moderate wildfire risk; extreme-heat days projected 6→15/yr by 2055 (HVAC capex compounding) — expect insurance premiums to compound above CPI over the hold.
Questions for the listing agent
- Is there a deadline driving the sale (1031 exchange, divorce, estate, relocation)? That informs how much negotiation room exists.
- Crime grade is D in this area — have there been break-ins, vandalism, or insurance claims at this property in the last 3 years? What carrier currently insures it and at what premium?
- What's the average days-on-market for RENTAL listings here right now (not sales)? A rising rental-DOM trend means longer vacancies and softer asking-rent achievability than the comps imply.
- What's the recent tenant-quality profile in this submarket — average credit score on applications, eviction rate, late-payment / NSF rate, and stable-employment percentage? A property-management company in the area should have these aggregated.
- How much new for-sale + rental construction is in the pipeline within 1–3 miles? Heavy new supply typically softens prices + rents 12–24 months out; constrained supply supports both.
Investment metrics
- 1% rule
- 2.27% ✓
- Cap rate
- 19.52%
- Cash-on-cash
- 47.25%
- DSCR
- 3.10
- GRM
- 3.7
CMA / ARV
- ARV (on-the-fly)
- $70,560
- Comps found
- 1
Show comp detail 1 sale within ~0.75 mi
| Address | Dist | Beds/Ba | Sqft | Sold | Price | $/sf | Match |
|---|---|---|---|---|---|---|---|
| 1221 N Dysart Rd #17 | 0.05mi | 2/2.0 | 1,120 (0%) | 11mo | $70,000 | $63 | 89 |
Match score weights: distance 35% · size 25% · config 20% · recency 20%. Top-matched comps best support the ARV.
Projected returns pro-forma
-3.0% appreciation · 0.34% rent growth · sell at horizon
- IRR
- 41.6%
- Equity multiple
- 2.72×
- Total profit
- $33,205
- Equity at exit
- $10,288
- IRR
- 46.5%
- Equity multiple
- 4.91×
- Total profit
- $75,504
- Equity at exit
- $5,966
Cash invested: $19,320 (down + closing). Projections, not guarantees.
Landlord ↔ Tenant lean methodology
- Overall (STATE)
- 87 Strongly Landlord-Friendly
- State Arizona
- 87 Strongly Landlord-Friendly · R+3
- County
- — inherits STATE
- City
- — inherits STATE
ZIP-level market 85323
- Home prices YoY
- -27.1%
- Rents YoY
- 0.3%
- Active inventory
- 305
- Price-to-rent
- 3.7×
Monthly cashflow live
- Estimated rent
- $1,566 high interval (Pro) →
- Mortgage (P&I)
- −$362
- Tax est. 1.5%
- −$86 /mo · $1,035/yr
- Insurance
- −$29
- HOA
- −$0
- Vacancy / Maint / Mgmt
- −$329
- Net cashflow
- $761
Break-even live
UW: 25.0% down · 7.5% · 30yr · 1.5% tax · 5.0% vac · 8.0% maint · 8.0% mgmt
Financing live
Cash to close
- Down payment
- $17,250
- Closing costs
- $2,070
- Reserves months
- —
- Total cash needed
- —
Loan-product check · same deal, 3 products live
Conventional
25% down · 7.5% · 30yr
- Down + closing
- —
- Monthly P&I
- —
- Monthly cashflow
- —
- DSCR
- —
- Eligible?
- —
Personal DTI + credit; lowest rate.
DSCR
20% down · 8.5% · 30yr
- Down + closing
- —
- Monthly P&I
- —
- Monthly cashflow
- —
- DSCR
- —
- Eligible?
- —
No personal income docs; deal must DSCR.
Hard money
10% down · 12.0% · 12mo
- Down + closing
- —
- Monthly P&I
- —
- Monthly cashflow
- —
- DSCR
- —
- Eligible?
- —
Short-term bridge; refi at stabilization.
Rent comps 26 comps
| Address | Beds | Baths | Sqft | Rent | $/sqft | DOM | Units | Dist |
|---|---|---|---|---|---|---|---|---|
| 26 N 126th Ave Avondale, AZ | 3.0 | 2.0 | 1268 | $1,950 | $1.54 | 24d | 1 | 0.47mi |
| 333 E Van Buren St Avondale, AZ | 2.0 | 1.0–2.0 | 574 | $1,365 | $2.38 | 1d | 12 | 0.47mi |
| 1425 N Palo Verde Dr Goodyear, AZ | 2.0 | 1.0 | 847 | $1,250 | $1.48 | 1d | 4 | 0.48mi |
| 302 E Lawrence Blvd #109 Avondale, AZ | 3.0 | 2.5 | 1340 | $2,100 | $1.57 | 1d | 1 | 0.62mi |
| 526 N 4th St Unit B Avondale, AZ | 2.0 | 1.0 | 858 | $1,150 | $1.34 | 1d | 1 | 0.64mi |
| 522 N 4th St Unit A Avondale, AZ | 2.0 | 1.0 | 858 | $1,150 | $1.34 | 1d | 1 | 0.65mi |
| 1701 N Palo Verde Dr Goodyear, AZ | 2.0 | 1.0 | 760 | $1,195 | $1.57 | 1d | 2 | 0.69mi |
| 12375 W Van Buren St Avondale, AZ | 1.0–3.0 | 1.0–2.0 | 1044 | $1,811 | $1.73 | 1d | 47 | 0.72mi |
| 103 E Brinker Dr Avondale, AZ | 3.0 | 1.0 | 900 | $1,150 | $1.28 | 1d | 3 | 0.77mi |
| 312 E Kinderman Dr Unit 1 Avondale, AZ | 2.0 | 1.0 | 717 | $1,375 | $1.92 | 19d | 1 | 0.80mi |
| 1737 N Central Ave Goodyear, AZ | 1.0–3.0 | 1.0–2.0 | 1009 | $1,544 | $1.53 | 1d | 15 | 0.84mi |
| 1408 N Central Ave Avondale, AZ | 2.0–3.0 | 1.5–2.0 | 1050 | $1,284 | $1.22 | 1d | 12 | 0.86mi |
| 12721 W Buckeye Rd Avondale, AZ | 2.0–3.0 | 2.0 | 983 | $1,497 | $1.52 | 1d | 6 | 0.92mi |
| 12 E Hill Dr Avondale, AZ | 3.0 | 1.0 | 1319 | $1,600 | $1.21 | 1d | 1 | 0.97mi |
| 12115 W Van Buren St Avondale, AZ | 1.0 | 1.0 | 754 | $1,155 | $1.53 | 17d | 1 | 1.03mi |
| 12115 W Van Buren St Avondale, AZ | 3.0 | 2.0 | 1241 | $1,740 | $1.40 | 2d | 1 | 1.03mi |
| 12115 W Van Buren St Avondale, AZ | 1.0 | 1.0 | 729 | $1,263 | $1.73 | 5d | 1 | 1.03mi |
| 12115 W Van Buren St Avondale, AZ | 1.0 | 1.0 | 754 | $1,195 | $1.58 | 1d | 1 | 1.03mi |
| 207 S 3rd St Unit 11 Avondale, AZ | 2.0 | 1.0 | 950 | $1,000 | $1.05 | 1d | 1 | 1.05mi |
| 13015 W Rancho Santa Fe Blvd Avondale, AZ | 1.0–3.0 | 1.0–2.0 | 971 | $1,484 | $1.53 | 1d | 22 | 1.05mi |
| 231 S 1st St Unit 1 Avondale, AZ | 2.0 | 1.0 | 1050 | $1,600 | $1.52 | 1d | 1 | 1.15mi |
| 833 N Litchfield Rd Goodyear, AZ | 3.0 | 2.0 | 1419 | $2,388 | $1.68 | 3d | 1 | 1.16mi |
| 620 N Litchfield Rd Goodyear, AZ | 1.0–3.0 | 1.0–2.0 | 802 | $1,532 | $1.91 | 1d | 14 | 1.22mi |
| 102 S 4th Ave Avondale, AZ | 1.0–3.0 | 1.0–2.0 | 853 | $1,550 | $1.82 | 1d | 26 | 1.37mi |
| 105 N Links Dr Avondale, AZ | 1.0–2.0 | 1.0–2.0 | 930 | $1,554 | $1.67 | 1d | 15 | 1.43mi |
| 11850 W Fillmore St Avondale, AZ | 3.0 | 1.0–2.0 | 838 | $1,566 | $1.87 | 1d | 20 | 1.47mi |
Listing history 11 events
-
2026-06-18days on market $69,000 Active 15 DOM
-
2026-06-17days on market $69,000 Active 14 DOM
-
2026-06-16days on market $69,000 Active 13 DOM
-
2026-06-15days on market $69,000 Active 12 DOM
-
2026-06-13days on market $69,000 Active 10 DOM
-
2026-06-13days on market $69,000 Active 9 DOM
-
2026-06-09days on market $69,000 Active 6 DOM
-
2026-06-08days on market $69,000 Active 5 DOM
-
2026-06-07days on market $69,000 Active 4 DOM
-
2026-06-04remarks 699-char remark
-
2026-06-04$69,000 Active 1 DOM
ⓘ Source: listings_history table (triggers on properties + properties_extension) + one-shot
backfill from property_details.listing_events for pre-trigger history.
Climate risk First Street
- Flood 1/10 Low FEMA zone X (shaded) · 0% chance over 30 yrs
- Wildfire 5/10 Major
- Heat 9/10 Extreme 6 d/yr ≥113°F today · 15 d/yr by 30 yrs out
- Wind 1/10 Low
- Air quality 2/10 Low 0 unhealthy d/yr today · 1 by 30 yrs out
Nearby sold comps map
Loading sold comps map…
Walkable amenities ~0.75 mi
Loading nearby amenities…
Taxation est. · year 1
- Rental income
- $18,798
- − Mortgage interest
- −$3,865
- − Property taxes
- −$1,035
- − Insurance
- −$345
- − Repairs & maintenance
- −$1,504
- − Management
- −$1,504
- − Depreciation
- −$2,007
- Taxable income
- $8,538
- Est. tax owed @ 24.0%
- −$2,049
- After-tax cash flow
- $7,079/yr
For passive investors: Depreciation is non-cash, so a rental often shows a tax loss while cash-flowing — sheltering income. Rental losses are passive: they offset passive income freely, and up to $25,000/yr can offset ordinary (W-2) income if you actively participate and your MAGI is under $100k (phasing out to $0 by $150k); unused losses carry forward. On sale, claimed depreciation is recaptured at up to 25%, and gains may owe capital-gains tax (a 1031 exchange can defer both). Figures are a year-1 estimate at your 24.0% rate — not tax advice; consult a CPA.
Condition & rehab AI · 13 photos
This well-maintained manufactured home in a desirable community offers a good investment opportunity with minimal repairs needed.
Value-add opportunities
- Both Paint exterior walls — Enhances curb appeal and value
- Both Replace HVAC filters — Improves air quality and energy efficiency
Renovation cost estimate screening
Value-add ROI direction
- Both Paint exterior walls — Enhances curb appeal and value ↑
- Both Replace HVAC filters — Improves air quality and energy efficiency ↑
ⓘ Cost ranges are severity-bucket heuristics (US national rule-of-thumb). Get contractor quotes + a written scope before underwriting a rehab budget.
Schools (NCES district)
- District
- Agua Fria Union High School District (4289)
- NCES district ID
- 0400450
- Math proficiency
- 24% ▼ -32.00%
- Reading proficiency
- 37% ▼ -12.00%
- Median HH income
- $64,107
- Composite
- 27.92/100
- National rank
- #6865
- State rank
- #99 of 249 in AZ
Livability — Avondale
- Score
- 72/100
- State rank
- #29
- US rank
- #6100
Category grades
Schools grade is shown separately in the Schools card above.
Census & demographics
- Census place
- Avondale, AZ
- County
- Maricopa County · 4,537,380 people
- City population
- 86,122
- Metro
- Phoenix-Mesa-Chandler, AZ
- Population (ZIP)
- 47,043
- Household income
- $83,120
- Rent vs Own
- Severe rent burden
- 1506.0
Population outlook (Maricopa County) Hauer SSP2
- Today (2025)
- 4,979,203 people
- By 2030
- 5,378,229 · +8.0%
- By 2040
- 6,156,598 · +23.6%
- By 2050
- 6,872,376 · +38.0%
- By 2075
- 8,401,270 · +68.7%
- By 2100
- 9,247,439 · +85.7%
Race, ethnicity, and origin ACS 2023
- Neighborhood character
- Diverse neighborhood (Simpson 0.58)
- Race & ethnicity
- Hispanic / Latino 60% Two or more races 26% White 22% Black 13% Asian 2% Native American 2%
- Hispanic origin (detail)
- Mexican 52% Puerto Rican 1%
- Common ancestry
- Italian 2% Portuguese 1% Ukrainian 1%
- Foreign-born
- 19% · Canada, Vietnam
- Languages at home
- 53% English-only · Spanish 42% Arabic 1% Tagalog/Filipino 1%
Political lean MEDSL · Maricopa
- 2024 margin
- Toss-up / Even · D 47.7% · R 51.2% · Other 1.1%
- 2008→2024 swing
- +7.1pp toward D · 2008: -10.6pp · 2024: -3.5pp
- All cycles
- 2024: R+3.5 2020: D+2.2 2016: R+3.5 2012: R+12.0 2008: R+10.6
Not yet ingested
- Civics
- —
Market trends
- HPI YoY
- ▼ -118.44%
- Current HPI
- 319.3653
- Rent YoY
- ▲ 0.34%
- Metro
- Phoenix-Mesa-Chandler, AZ
- State GDP YoY
- ▲ 4.54%
- F500 in state
- 20
Industry mix (Fortune 500 HQ in AZ)
| Industry | F500 HQs | Revenue |
|---|---|---|
| Technology | 2 | $13B |
|
||
| Mining / Metals | 1 | $23B |
|
||
| Environmental Services | 1 | $16B |
|
||
| Metals / Steel | 1 | $14B |
|
||
| Technology Distribution | 1 | $9B |
|
||
| Homebuilding | 1 | $8B |
|
||
Price history
1 event — show timeline
- 2026-06-03 Listed $69,000 ARMLS
Cash-flow waterfall
monthlySold comps — $/sqft
last 12 mo · ≤1 miLoading sold comps…