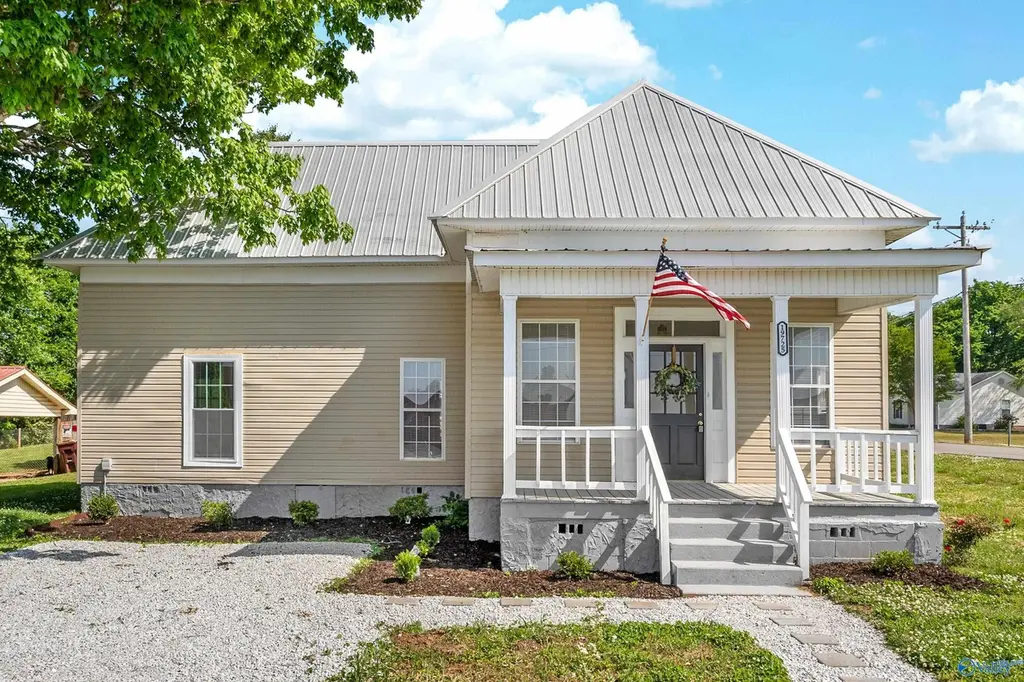
19725 Redus St · Elkmont, AL
Flood risk 1/10 · Minimal
- FEMA flood zone
- X (unshaded)
- Chance of flooding over 30 yrs
- 0.0%
- Est. flood insurance / yr
- $507 – $1,088
Fire risk 4/10 · Minor
- Est. fire insurance / yr
- $916 – $1,700
Heat risk 5/10 · Moderate
- Hot days now (above 105°F)
- 7 days/yr
- Hot days in 30 yrs
- 20 days/yr
Wind risk 4/10 · Minor
- Chance of severe wind over 30 yrs
- 19.0%
Air-quality risk 2/10 · Minimal
- Unhealthy air days now
- 0 days/yr
- Unhealthy air days in 30 yrs
- 1 days/yr
Risk factors via First Street. Map © Google.
Why this score? — see what drove the D grade
The composite is a weighted blend of 9 inputs, each scored 0–100. Each bar is that input's sub-score; the figure is the points it added to the 100-point composite (weight × sub-score).
- ARV discount +13.8/15.0
- Cash flow +10.4/30.0
- Livability +3.5/5.0
- DSCR +3.0/10.0
- Schools +2.8/10.0
- Rent growth +2.5/5.0
- Condition / age +2.5/5.0
- 1% rule +1.8/10.0
- Appreciation +0.0/10.0
$219,000
🖨 Deal sheet 📄 Offer letter ✓ Due diligence
Listing remarks
OPEN HOUSE SUN APRIL 26TH 2-4! Come and tour this incredible full interior remodel, featuring all-new flooring, a completely updated kitchen with modern appliances, fresh paint, and stylish fixtures throughout. Both bathrooms have been beautifully renovated to offer comfort and contemporary appeal. This home combines craftsmanship and convenience — perfectly located beside Elkmont High School, making daily routines easy and efficient. Don’t miss the opportunity to see this move-in-ready gem in person and experience its modern upgrades firsthand!
Key facts
- Renovated bathrooms
- Move-in-ready
- Modern appliances
Tags
Property features AI
Finance
- Other: Subdivision: Metes And Bounds
- HOA & community: No homeowners association
Exterior
- Parking: Gravel driveway
- Utilities: Public water
- Home design: Single-family residence; One story; Not new construction
- Construction: Vinyl siding
- Exterior features: Lot is approximately 0.3 acres (about 13,068 sq ft); Lot dimensions about 153 x 74; Public water
Interior
- Bathrooms: 1 full bathroom; 1 three-quarter bathroom
- Heating & cooling: Central heating; Central cooling
- Interior features: 7 rooms total; Crawl space basement
Neighborhood map
What this means for you Summary
Snapshot
- This is a 3-bed/2.0-bath single-family listed at $219k.
Deal economics
- At list price, monthly cash flow is $-115 ($-1k/yr) — negative.
- To cash-flow at today's rent, offer at most $199k (9.3% below list).
- To meet the 1% rule (rent ≥ 1% of price), the offer needs to be $148k (32.4% below list).
- Recommended offer: $148k (32.4% below list) — sets the bar for 1% rule.
Location & tenants
- Location reads 69/100 on livability (#55 in AL) — a middle-class / working-renter tenant base. Strengths: cost of living A+, housing A+, health & safety A+; Watch: employment D+, amenities F, commute F.
- Limestone County (rural): math 21% / reading 44% proficiency, ranked #52 of 129 in AL (top 40%) — families likely to look elsewhere, expect single-tenant / working-renter base with shorter leases.
- Zoned schools: Elkmont Elementary School (math 27% / reading 42%, grade F, #296 of 627 statewide, top 49%, 376 students, 63% FRL); Elkmont High School (math 9% / reading 34%, grade F, #156 of 305 statewide, top 52%, 643 students, 61% FRL) — zoned schools average 62% FRL vs 40% district-wide (22 pts higher); higher-poverty schools than district average — tighter screening recommended.
- Market conditions: 79 active listings in the ZIP; 494 units permitted in Limestone County in 2024 (0 in 5+ unit buildings).
Forward outlook
- Local home prices are declining (-3.0%/yr); year-one equity from $2k of loan paydown is wiped out by about $7k of value loss. Plan a longer hold.
- Limestone County population projected at +43% by 2050 — long-run rental-demand tailwind backs the buy-and-hold thesis.
Negotiation context
- It's been on market 46 days — a 3% lower offer ($212k) is reasonable based on typical stale-listing flexibility.
- Current owner paid $102k; list at $219k implies a 116% gain — meaningful room to come down on a strong offer.
Risks & watch-outs
- Watch-outs: built in 1940 — expect roof / HVAC / electrical / plumbing capex.
- Climate carrying-cost: extreme-heat days projected 7→20/yr by 2055 (HVAC capex compounding) — expect insurance premiums to compound above CPI over the hold.
Questions for the listing agent
- What do current leases actually rent for vs. the listed asking? Can we see a recent rent roll and the last 12 months of T-12 income?
- It's been on market 46 days. Have you received any prior offers? Is the seller open to a 32% concession, seller financing, or rate buy-down credit?
- Built in 1940 — when were the roof, HVAC, electrical panel, plumbing, and water heater last replaced?
- Is there a deadline driving the sale (1031 exchange, divorce, estate, relocation)? That informs how much negotiation room exists.
- Schools are D-rated, which usually means shorter tenancies and higher turnover. Who's the typical renter profile here, and what's been the actual vacancy rate?
- The area grade is low — what's the realistic commute time and amenity access for the typical tenant pool here? Any planned neighborhood developments (good or bad) we should know about?
- What's the average days-on-market for RENTAL listings here right now (not sales)? A rising rental-DOM trend means longer vacancies and softer asking-rent achievability than the comps imply.
- What's the recent tenant-quality profile in this submarket — average credit score on applications, eviction rate, late-payment / NSF rate, and stable-employment percentage? A property-management company in the area should have these aggregated.
- How much new for-sale + rental construction is in the pipeline within 1–3 miles? Heavy new supply typically softens prices + rents 12–24 months out; constrained supply supports both.
Investment metrics
- 1% rule
- 0.68% ✗
- Cap rate
- 5.66%
- Cash-on-cash
- -2.26%
- DSCR
- 0.90
- GRM
- 12.3
CMA / ARV
- ARV (median comp)
- $254,900
- List price
- $219,000
- Delta
- -14.08%
- Verdict
- UNDERPRICED
- Comps
- 15 within 1.0 mi
Show comp detail 3 sales within ~0.75 mi
| Address | Dist | Beds/Ba | Sqft | Sold | Price | $/sf | Match |
|---|---|---|---|---|---|---|---|
| 25479 Vaughn St | 0.51mi | 3/2.0 | 1,438 (+2%) | 4mo | $254,900 | $177 | 69 |
| 19201 Upper Fort Hampton Rd | 0.21mi | 3/2.0 | 1,200 (-15%) | 18mo | $219,000 | $183 | 51 |
| 25404 Cedar Ave | 0.53mi | 3/1.5 | 1,576 (+12%) | 15mo | $219,900 | $140 | 41 |
Match score weights: distance 35% · size 25% · config 20% · recency 20%. Top-matched comps best support the ARV.
Projected returns pro-forma
-3.0% appreciation · 3.0% rent growth · sell at horizon
- IRR
- -20.1%
- Equity multiple
- 0.30×
- Total profit
- $-42,951
- Equity at exit
- $32,654
- IRR
- -13.3%
- Equity multiple
- 0.23×
- Total profit
- $-47,339
- Equity at exit
- $18,935
Cash invested: $61,320 (down + closing). Projections, not guarantees.
Landlord ↔ Tenant lean methodology
- Overall (STATE)
- 90 Strongly Landlord-Friendly
- State Alabama
- 90 Strongly Landlord-Friendly · R+15
- County
- — inherits STATE
- City
- — inherits STATE
ZIP-level market 35620
- Home prices YoY
- -28.3%
- Active inventory
- 79
- Price-to-rent
- 12.3×
Monthly cashflow live
- Estimated rent
- $1,481 medium interval (Pro) →
- Mortgage (P&I)
- −$1,148
- Tax from tax record
- −$45 /mo · $544/yr
- Insurance
- −$91
- HOA
- −$0
- Vacancy / Maint / Mgmt
- −$311
- Net cashflow
- $-115
Break-even live
UW: 25.0% down · 7.5% · 30yr · 1.5% tax · 5.0% vac · 8.0% maint · 8.0% mgmt
Financing live
Cash to close
- Down payment
- $54,750
- Closing costs
- $6,570
- Reserves months
- —
- Total cash needed
- —
Loan-product check · same deal, 3 products live
Conventional
25% down · 7.5% · 30yr
- Down + closing
- —
- Monthly P&I
- —
- Monthly cashflow
- —
- DSCR
- —
- Eligible?
- —
Personal DTI + credit; lowest rate.
DSCR
20% down · 8.5% · 30yr
- Down + closing
- —
- Monthly P&I
- —
- Monthly cashflow
- —
- DSCR
- —
- Eligible?
- —
No personal income docs; deal must DSCR.
Hard money
10% down · 12.0% · 12mo
- Down + closing
- —
- Monthly P&I
- —
- Monthly cashflow
- —
- DSCR
- —
- Eligible?
- —
Short-term bridge; refi at stabilization.
Listing history 16 events
-
2026-06-14status $219,000 Pending 46 DOM
-
2026-06-10days on market $219,000 Active 46 DOM
-
2026-06-09days on market $219,000 Active 45 DOM
-
2026-06-08days on market $219,000 Active 44 DOM
-
2026-06-07days on market $219,000 Active 43 DOM
-
2026-06-05days on market $219,000 Active 40 DOM
-
2026-06-03days on market $219,000 Active 39 DOM
-
2026-06-03price $219,000 Active 38 DOM
-
2026-06-02days on market $228,000 Active 38 DOM
-
2026-06-01days on market $228,000 Active 37 DOM
-
2026-05-31days on market $228,000 Active 36 DOM
-
2026-05-30days on market $228,000 Active 35 DOM
-
2026-05-15price $228,000 564-char remark
-
2026-04-25$229,000 Active 564-char remark
-
2026-01-21soldstatus $101,500
-
2011-06-08soldstatus $20,500
ⓘ Source: listings_history table (triggers on properties + properties_extension) + one-shot
backfill from property_details.listing_events for pre-trigger history.
Tax reassessment forecast AL · Resets to sale price
- Current annual tax
- $544 · $45/mo
- Projected year-2 tax
- $898 · $75/mo
- Expected delta
- +$354/yr (+$30/mo · 65.1%)
ⓘ Screening estimate from a state-policy table — verify with the county assessor before closing.
Climate risk First Street
- Flood 1/10 Low FEMA zone X (unshaded) · 0% chance over 30 yrs
- Wildfire 4/10 Moderate
- Heat 5/10 Major 7 d/yr ≥105°F today · 20 d/yr by 30 yrs out
- Wind 4/10 Moderate 19% chance of damaging wind over 30 yrs
- Air quality 2/10 Low 0 unhealthy d/yr today · 1 by 30 yrs out
Nearby sold comps map
Loading sold comps map…
Walkable amenities ~0.75 mi
Loading nearby amenities…
Taxation est. · year 1
- Rental income
- $17,768
- − Mortgage interest
- −$12,267
- − Property taxes
- −$544
- − Insurance
- −$1,095
- − Repairs & maintenance
- −$1,421
- − Management
- −$1,421
- − Depreciation
- −$6,371
- Taxable loss
- −$5,352
- Est. tax savings @ 24.0%
- +$1,285
- After-tax cash flow
- $-99/yr
For passive investors: Depreciation is non-cash, so a rental often shows a tax loss while cash-flowing — sheltering income. Rental losses are passive: they offset passive income freely, and up to $25,000/yr can offset ordinary (W-2) income if you actively participate and your MAGI is under $100k (phasing out to $0 by $150k); unused losses carry forward. On sale, claimed depreciation is recaptured at up to 25%, and gains may owe capital-gains tax (a 1031 exchange can defer both). Figures are a year-1 estimate at your 24.0% rate — not tax advice; consult a CPA.
Schools (NCES district)
- District
- Limestone County
- NCES district ID
- 0102100
- Math proficiency
- 21% ▼ -23.00%
- Reading proficiency
- 44% ▼ -3.00%
- Median HH income
- $48,972
- Composite
- 28.09/100
- National rank
- #6829
- State rank
- #52 of 129 in AL
Livability — Elkmont
- Score
- 69/100
- State rank
- #55
- US rank
- #8580
Category grades
Schools grade is shown separately in the Schools card above.
Census & demographics
- Census place
- Elkmont, AL
- Population (ZIP)
- 10,990
Population outlook (Limestone County) Hauer SSP2
- Today (2025)
- 111,441 people
- By 2030
- 121,272 · +8.8%
- By 2040
- 140,705 · +26.3%
- By 2050
- 159,069 · +42.7%
- By 2075
- 202,231 · +81.5%
- By 2100
- 230,608 · +106.9%
Race, ethnicity, and origin ACS 2023
- Neighborhood character
- Predominantly White (92%)
- Race & ethnicity
- White 92% Hispanic / Latino 4% Two or more races 2% Black 1% Native American 1%
- Common ancestry
- Italian 1% Serbian 1% Slovak 1%
- Foreign-born
- 2% · Canada
- Languages at home
- 96% English-only · Spanish 4%
Political lean MEDSL · Limestone
- 2024 margin
- Solid R (+43.9) · D 27.5% · R 71.4% · Other 1.2%
- 2008→2024 swing
- -2.0pp toward R · 2008: -41.9pp · 2024: -43.9pp
- All cycles
- 2024: R+43.9 2020: R+42.6 2016: R+49.5 2012: R+43.6 2008: R+41.9
Not yet ingested
- Civics
- —
Market trends
- HPI YoY
- ▼ -72.17%
- Current HPI
- 182.82
- Rent YoY
- —
- Metro
- —
- State GDP YoY
- ▲ 2.94%
- F500 in state
- 4
Industry mix (Fortune 500 HQ in AL)
| Industry | F500 HQs | Revenue |
|---|---|---|
| Financial Services | 1 | $8B |
|
||
| Healthcare | 1 | $5B |
|
||
Price history
+968.3% since first listed6 events — show timeline
- 2026-06-10 Pending — VMLS
- 2026-06-02 Price Changed $219,000 VMLS
- 2026-05-15 Price Changed $228,000 VMLS
- 2026-04-25 Listed $229,000 VMLS
- 2026-01-21 Sold (Public Records) $101,500 Public Records
- 2011-06-08 Sold (Public Records) $20,500 Public Records
Property tax history
+11.2%/yrLatest (2025): $544 · +3.3% YoY. Source: county tax records.
Cash-flow waterfall
monthlySold comps — $/sqft
last 12 mo · ≤1 miLoading sold comps…