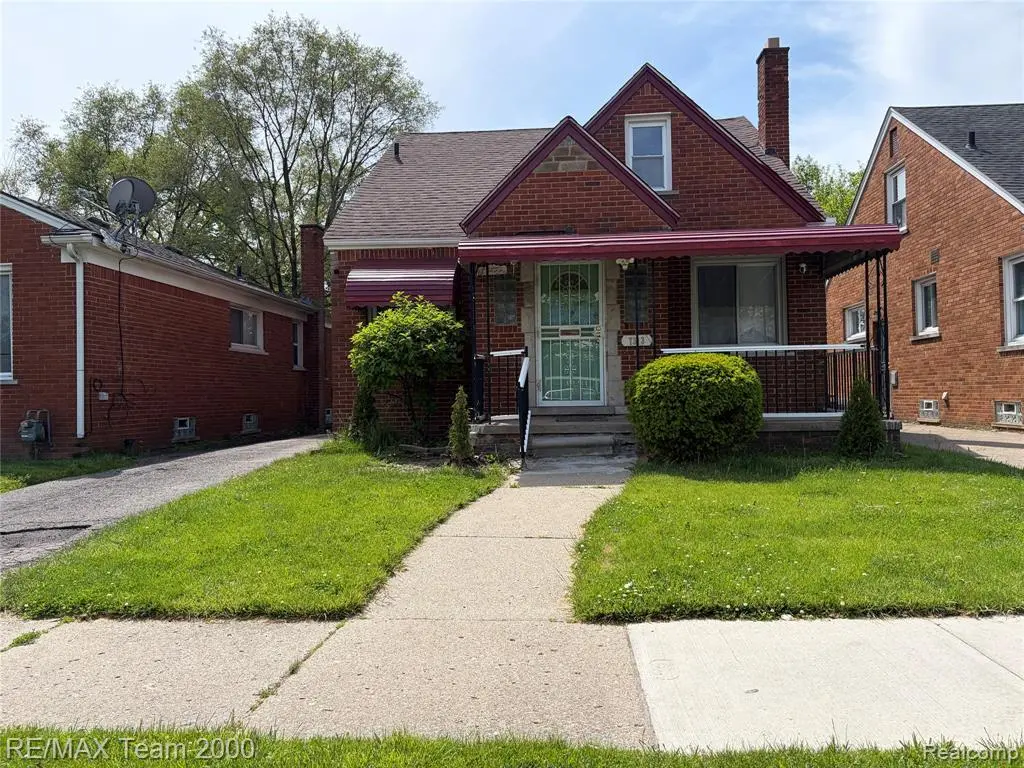
7313 Stout St · Detroit, MI
Flood risk 1/10 · Minimal
- FEMA flood zone
- X (unshaded)
- Chance of flooding over 30 yrs
- 0.0%
- Est. flood insurance / yr
- $473 – $860
Fire risk 1/10 · Minimal
- Est. fire insurance / yr
- $784 – $1,456
Heat risk 3/10 · Minor
- Hot days now (above 99°F)
- 7 days/yr
- Hot days in 30 yrs
- 15 days/yr
Wind risk 2/10 · Minimal
- Chance of severe wind over 30 yrs
- —
Air-quality risk 3/10 · Minor
- Unhealthy air days now
- 2 days/yr
- Unhealthy air days in 30 yrs
- 4 days/yr
Risk factors via First Street. Map © Google.
Why this score? — see what drove the D grade
The composite is a weighted blend of 9 inputs, each scored 0–100. Each bar is that input's sub-score; the figure is the points it added to the 100-point composite (weight × sub-score).
- Cash flow +17.9/30.0
- ARV discount +7.5/15.0
- DSCR +5.6/10.0
- 1% rule +4.4/10.0
- Livability +3.7/5.0
- Condition / age +2.5/5.0
- Rent growth +1.9/5.0
- Schools +1.3/10.0
- Appreciation +0.0/10.0
$159,999
🖨 Deal sheet 📄 Offer letter ✓ Due diligence
Listing remarks MLS
Welcome home to this beautifully updated oversized brick bungalow located in Detroit's desirable Warrendale neighborhood, bordering Dearborn Heights. This spacious family home is great for that larger family or growing family. From the moment you arrive, you'll appreciate the solid brick exterior, with porch, fenced yard, and detached 1 1/2-car garage. Step inside to discover a thoughtfully renovated interior featuring updated plumbing and electrical, fresh paint throughout, newer carpet, interior and exterior doors, and an updated bathroom that gives the home a clean, modern feel. Updates include; new plumbing, new electrical, interior and exterior doors, carpeting, painted throughout, a newer roof, newer vinyl windows, glass block basement windows, and a new hot water heater updated bathroom, basement. The spacious layout is ideal for a growing or multi-generational family, offering four generous bedrooms with two conveniently located on the main floor and two oversized upper bedrooms complete with a half bath upstairs. The inviting living room provides plenty of space for relaxing or entertaining, while the formal dining room is perfect for family gatherings, holiday dinners, and everyday meals. Downstairs, the partially finished basement expands your living space even further and includes an additional half bath, making it ideal for a recreation room, home office, workout area, or entertaining space. Located in the established Warrendale area near Dearborn Heights, this home offers easy access to shopping, dining, schools, parks, and major freeways while still maintaining the charm of a quiet residential neighborhood known for its brick homes and spacious lots. This move-in-ready bungalow is a rare opportunity for buyers seeking space, updates, and value all in one home. Whether you're looking for room to grow or simply want a solid, well-maintained property with character and modern improvements, this home delivers.
Key facts
- Brick bungalow
- Updated electrical
- Fenced yard
Tags
Property features AI
Exterior
- Parking: Detached garage (1.5 car)
- Utilities: Public water; Public sewer; Sewer and water available; Paved road access
- Home design: Single-family residence; One and one-half levels; Ground-level entry
- Construction: Brick construction; Block foundation
- Exterior features: Covered porch; Patio/porch; Fenced backyard
Interior
- Kitchen: Free‑standing gas range; Free‑standing refrigerator; Dishwasher not listed
- Bedrooms: Total of 7 rooms (bedroom count not specified)
- Bathrooms: 1 full bathroom; 2 half bathrooms
- Heating & cooling: Forced air heating (natural gas); Central air conditioning; Ceiling fans
- Interior features: Lighting; Partially finished basement
- Laundry & utility: Dedicated laundry room; Washer and dryer included
Neighborhood map
What this means for you Summary
Snapshot
- This is a 4-bed/1.0-bath single-family listed at $160k.
Deal economics
- At list price, monthly cash flow is $134 ($2k/yr) — positive.
- The deal already cash-flows at list — no discount required.
- To meet the 1% rule (rent ≥ 1% of price), the offer needs to be $150k (6.4% below list).
- Recommended offer: $150k (6.4% below list) — sets the bar for 1% rule.
- Cap rate 7.3% vs local median 10.2% in Detroit — below-typical yield; the buyer is paying a premium for something (appreciation thesis, condition, location) that the cap rate doesn't capture.
Location & tenants
- Location reads 73/100 on livability (#218 in MI) — a middle-class / working-renter tenant base. Strengths: amenities A+, commute A+, cost of living A+; Watch: schools F, crime F, employment F.
- Detroit Public Schools Community District (urban): math 10% / reading 24% proficiency, ranked #499 of 540 in MI (top 92%) — low school quality limits family demand, transient renter base, plan for 1-2y turnover; 90% free/reduced lunch — lower-income household profile, screen leases tightly.
- Market conditions: Rents soft (-2.3%/yr); 363 active listings in the ZIP; 19 comparable units currently listed for rent nearby; rentals at typical pace (median 18d on market — plan ~3-4 weeks tenant-placement turnaround); lower-income renter base — watch delinquency; 2,639 units permitted in Wayne County in 2024 (1,216 in 5+ unit buildings).
- At $1,497/mo this rent would consume 59% of the median local household income ($31k/yr) (locally 4144% of renters already pay >50% of income on rent) — very limited rent-growth headroom before tenants either downsize or default.
Forward outlook
- Local home prices are declining (-3.0%/yr); year-one equity from $1k of loan paydown is wiped out by about $5k of value loss. Plan a longer hold.
- Wayne County population projected at -17% by 2050 — secular population decline; favor cash flow + early exit over multi-decade hold.
Negotiation context
- It's been on market 20 days — a 2% lower offer ($158k) is reasonable based on typical stale-listing flexibility.
- 11 sale attempts since 27y ago with the ask held roughly flat each time — persistent listings suggest the price (not the market) is what's stuck; bring a comps-based counter.
- Current owner paid $124k; 29% above their basis — modest negotiation headroom, anchor on the comps not their cost.
Risks & watch-outs
- Watch-outs: built in 1950 — expect roof / HVAC / electrical / plumbing capex.
Questions for the listing agent
- Built in 1950 — when were the roof, HVAC, electrical panel, plumbing, and water heater last replaced?
- Is there a deadline driving the sale (1031 exchange, divorce, estate, relocation)? That informs how much negotiation room exists.
- Schools are F-rated, which usually means shorter tenancies and higher turnover. Who's the typical renter profile here, and what's been the actual vacancy rate?
- Crime grade is F in this area — have there been break-ins, vandalism, or insurance claims at this property in the last 3 years? What carrier currently insures it and at what premium?
- The area grade is low — what's the realistic commute time and amenity access for the typical tenant pool here? Any planned neighborhood developments (good or bad) we should know about?
- What's the average days-on-market for RENTAL listings here right now (not sales)? A rising rental-DOM trend means longer vacancies and softer asking-rent achievability than the comps imply.
- What's the recent tenant-quality profile in this submarket — average credit score on applications, eviction rate, late-payment / NSF rate, and stable-employment percentage? A property-management company in the area should have these aggregated.
- How much new for-sale + rental construction is in the pipeline within 1–3 miles? Heavy new supply typically softens prices + rents 12–24 months out; constrained supply supports both.
Investment metrics
- 1% rule
- 0.94% ✗
- Cap rate
- 7.30%
- Cash-on-cash
- 3.58%
- DSCR
- 1.16
- GRM
- 8.9
CMA / ARV
- ARV (on-the-fly)
- $91,482
- Comps found
- 12
Show comp detail 12 sales within ~0.75 mi
| Address | Dist | Beds/Ba | Sqft | Sold | Price | $/sf | Match |
|---|---|---|---|---|---|---|---|
| 7601 Stout St | 0.15mi | 3/1.0 (-1) | 1,100 (-5%) | 3mo | $140,000 | $127 | 77 |
| 6488 Vaughan St | 0.46mi | 3/1.0 (-1) | 1,160 (+0%) | 6mo | $75,000 | $65 | 68 |
| 7794 Braile St | 0.36mi | 3/1.0 (-1) | 1,100 (-5%) | 4mo | $71,500 | $65 | 66 |
| 7278 Stout St | 0.04mi | 3/1.5 (-1) | 1,000 (-14%) | 4mo | $109,900 | $110 | 65 |
| 7690 Heyden St | 0.25mi | 3/1.0 (-1) | 1,019 (-12%) | 1mo | $73,000 | $72 | 63 |
| 6782 Evergreen Ave | 0.36mi | 3/1.0 (-1) | 1,041 (-10%) | 3mo | $120,000 | $115 | 59 |
| 7816 Fielding St | 0.35mi | 3/1.0 (-1) | 1,022 (-12%) | 2mo | $57,000 | $56 | 57 |
| 20049 Tireman St | 0.39mi | 3/1.0 (-1) | 1,011 (-13%) | 5mo | $79,900 | $79 | 51 |
| 8201 Heyden St | 0.52mi | 3/1.0 (-1) | 1,306 (+13%) | 0mo | $59,999 | $46 | 49 |
| 8234 Patton St | 0.55mi | 3/1.0 (-1) | 1,010 (-13%) | 2mo | $60,000 | $59 | 46 |
| 6417 Auburn St | 0.59mi | 3/1.0 (-1) | 1,000 (-14%) | 4mo | $95,000 | $95 | 42 |
| 8100 Evergreen Ave | 0.53mi | 3/2.0 (-1) | 1,000 (-14%) | 5mo | $135,000 | $135 | 39 |
Match score weights: distance 35% · size 25% · config 20% · recency 20%. Top-matched comps best support the ARV.
Projected returns pro-forma
-3.0% appreciation · 0.0% rent growth · sell at horizon
- IRR
- -14.0%
- Equity multiple
- 0.51×
- Total profit
- $-21,803
- Equity at exit
- $23,856
- IRR
- -10.6%
- Equity multiple
- 0.44×
- Total profit
- $-25,017
- Equity at exit
- $13,834
Cash invested: $44,800 (down + closing). Projections, not guarantees.
Landlord ↔ Tenant lean methodology
- Overall (STATE)
- 62 Landlord-Friendly
- State Michigan
- 62 Landlord-Friendly · EVEN
- County
- — inherits STATE
- City
- — inherits STATE
ZIP-level market 48228
- Rents YoY
- -2.3%
- Active inventory
- 363
- Price-to-rent
- 8.9×
Monthly cashflow live
- Estimated rent
- $1,497 high interval (Pro) →
- Mortgage (P&I)
- −$839
- Tax from tax record
- −$143 /mo · $1,720/yr
- Insurance
- −$67
- HOA
- −$0
- Vacancy / Maint / Mgmt
- −$314
- Net cashflow
- $134
Break-even live
UW: 25.0% down · 7.5% · 30yr · 1.5% tax · 5.0% vac · 8.0% maint · 8.0% mgmt
Financing live
Cash to close
- Down payment
- $40,000
- Closing costs
- $4,800
- Reserves months
- —
- Total cash needed
- —
Loan-product check · same deal, 3 products live
Conventional
25% down · 7.5% · 30yr
- Down + closing
- —
- Monthly P&I
- —
- Monthly cashflow
- —
- DSCR
- —
- Eligible?
- —
Personal DTI + credit; lowest rate.
DSCR
20% down · 8.5% · 30yr
- Down + closing
- —
- Monthly P&I
- —
- Monthly cashflow
- —
- DSCR
- —
- Eligible?
- —
No personal income docs; deal must DSCR.
Hard money
10% down · 12.0% · 12mo
- Down + closing
- —
- Monthly P&I
- —
- Monthly cashflow
- —
- DSCR
- —
- Eligible?
- —
Short-term bridge; refi at stabilization.
Rent comps 19 comps
| Address | Beds | Baths | Sqft | Rent | $/sqft | DOM | Units | Dist |
|---|---|---|---|---|---|---|---|---|
| 7411 Stout St Detroit, MI | 3.0 | 1.0 | 888 | $1,428 | $1.61 | 13d | 1 | 0.08mi |
| 7265 Braile St Detroit, MI | 3.0 | 1.0 | 1200 | $1,499 | $1.25 | 24d | 1 | 0.16mi |
| 7794 Vaughan St Detroit, MI | 3.0 | 1.0 | 1000 | $1,450 | $1.45 | 17d | 1 | 0.34mi |
| 20431 Tireman St Detroit, MI | 3.0 | 1.0 | 1020 | $1,350 | $1.32 | 17d | 1 | 0.35mi |
| 20571 Brooklawn Dr Dearborn Heights, MI | 3.0 | 2.0 | 1254 | $1,850 | $1.48 | 44d | 1 | 0.55mi |
| 8283 Vaughan St Detroit, MI | 3.0 | 1.0 | 1058 | $1,294 | $1.22 | 5d | 1 | 0.58mi |
| 8270 Trinity St Detroit, MI | 3.0 | 1.0 | 806 | $1,528 | $1.90 | 44d | 1 | 0.67mi |
| 6490 Stahelin Ave Detroit, MI | 3.0 | 1.0 | 960 | $1,299 | $1.35 | 17d | 1 | 0.88mi |
| 9059 Burt Rd Detroit, MI | 3.0 | 1.0 | 980 | $1,400 | $1.43 | 44d | 1 | 1.10mi |
| 8262 Rosemont Ave Detroit, MI | 3.0 | 1.0 | 836 | $1,200 | $1.44 | 5d | 1 | 1.20mi |
| 8451 Rosemont Ave Detroit, MI | 3.0 | 1.0 | 867 | $1,150 | $1.33 | 44d | 1 | 1.24mi |
| 7618 Hazelton St Dearborn Heights, MI | 3.0 | 1.0 | 1310 | $1,700 | $1.30 | 17d | 1 | 1.33mi |
| 8254 W Parkway St Redford, MI | 3.0 | 1.0 | 1220 | $1,350 | $1.11 | 13d | 1 | 1.39mi |
| 19449 W Chicago St Detroit, MI | 3.0 | 1.5 | 950 | $1,500 | $1.58 | 44d | 1 | 1.39mi |
| 8850 Rosemont Ave Detroit, MI | 3.0 | 1.0 | 933 | $1,100 | $1.18 | 18d | 1 | 1.41mi |
| 5521 Fairlane Woods Dr Dearborn, MI | 1.0–3.0 | 1.0–2.0 | 1164 | $2,430 | $2.09 | 2d | 12 | 1.42mi |
| 19440 W Chicago St Detroit, MI | 3.0 | 1.5 | 1200 | $1,225 | $1.02 | 22d | 1 | 1.43mi |
| 19440 W Chicago St Detroit, MI | 3.0 | 1.5 | 1200 | $1,225 | $1.02 | 18d | 1 | 1.43mi |
| 6761 Memorial Ave Detroit, MI | 3.0 | 1.0 | 1060 | $1,100 | $1.04 | 24d | 1 | 1.46mi |
Listing history 13 events
-
2026-06-18days on market $159,999 Active 20 DOM
-
2026-06-17days on market $159,999 Active 19 DOM
-
2026-06-15days on market $159,999 Active 17 DOM
-
2026-06-13days on market $159,999 Active 15 DOM
-
2026-06-13days on market $159,999 Active 14 DOM
-
2026-06-09days on market $159,999 Active 11 DOM
-
2026-06-08days on market $159,999 Active 10 DOM
-
2026-06-07days on market $159,999 Active 9 DOM
-
2026-06-04days on market $159,999 Active 6 DOM
-
2026-06-03days on market $159,999 Active 5 DOM
-
2026-06-02days on market $159,999 Active 4 DOM
-
2026-06-01days on market $159,999 Active 3 DOM
-
2026-05-31days on market $159,999 Active 2 DOM
ⓘ Source: listings_history table (triggers on properties + properties_extension) + one-shot
backfill from property_details.listing_events for pre-trigger history.
Tax reassessment forecast MI · Partial reset (capped growth)
- Current annual tax
- $1,720 · $143/mo
- Projected year-2 tax
- $2,092 · $174/mo
- Expected delta
- +$372/yr (+$31/mo · 21.6%)
ⓘ Screening estimate from a state-policy table — verify with the county assessor before closing.
Climate risk First Street
- Flood 1/10 Low FEMA zone X (unshaded) · 0% chance over 30 yrs
- Wildfire 1/10 Low
- Heat 3/10 Moderate 7 d/yr ≥99°F today · 15 d/yr by 30 yrs out
- Wind 2/10 Low
- Air quality 3/10 Moderate 2 unhealthy d/yr today · 4 by 30 yrs out
Nearby sold comps map
Loading sold comps map…
Walkable amenities ~0.75 mi
Loading nearby amenities…
Taxation est. · year 1
- Rental income
- $17,968
- − Mortgage interest
- −$8,962
- − Property taxes
- −$1,720
- − Insurance
- −$800
- − Repairs & maintenance
- −$1,437
- − Management
- −$1,437
- − Depreciation
- −$4,655
- Taxable loss
- −$1,044
- Est. tax savings @ 24.0%
- +$251
- After-tax cash flow
- $1,857/yr
For passive investors: Depreciation is non-cash, so a rental often shows a tax loss while cash-flowing — sheltering income. Rental losses are passive: they offset passive income freely, and up to $25,000/yr can offset ordinary (W-2) income if you actively participate and your MAGI is under $100k (phasing out to $0 by $150k); unused losses carry forward. On sale, claimed depreciation is recaptured at up to 25%, and gains may owe capital-gains tax (a 1031 exchange can defer both). Figures are a year-1 estimate at your 24.0% rate — not tax advice; consult a CPA.
Schools (NCES district)
- District
- Detroit Public Schools Community District
- NCES district ID
- 2601103
- Math proficiency
- 10% ▼ -2.00%
- Reading proficiency
- 24% ▲ 6.00%
- Median HH income
- $25,815
- Composite
- 13.06/100
- National rank
- #9564
- State rank
- #499 of 540 in MI
Livability — Detroit
- Score
- 73/100
- State rank
- #218
- US rank
- #5427
Category grades
Schools grade is shown separately in the Schools card above.
Census & demographics
- Census place
- Detroit, MI
- County
- Wayne County · 1,562,939 people
- City population
- 572,865
- Metro
- Detroit-Warren-Dearborn, MI
- Population (ZIP)
- 50,117
- Household income
- $30,680
- Rent vs Own
- Severe rent burden
- 4144.0
Population outlook (Wayne County) Hauer SSP2
- Today (2025)
- 1,675,273 people
- By 2030
- 1,620,300 · -3.3%
- By 2040
- 1,502,341 · -10.3%
- By 2050
- 1,384,039 · -17.4%
- By 2075
- 1,124,592 · -32.9%
- By 2100
- 881,193 · -47.4%
Race, ethnicity, and origin ACS 2023
- Neighborhood character
- Predominantly Black (71%)
- Race & ethnicity
- Black 71% White 16% Two or more races 7% Hispanic / Latino 6%
- Hispanic origin (detail)
- Mexican 3% Puerto Rican 2%
- Common ancestry
- Arab 2% Romanian 2% Lithuanian 1%
- Foreign-born
- 11% · Canada
- Languages at home
- 82% English-only · Arabic 11% Spanish 5%
Political lean MEDSL · Wayne
- 2024 margin
- Strong D (+29.0) · D 62.7% · R 33.7% · Other 3.6%
- 2008→2024 swing
- -20.5pp toward R · 2008: 49.5pp · 2024: 29.0pp
- All cycles
- 2024: D+29.0 2020: D+38.1 2016: D+37.3 2012: D+46.9 2008: D+49.5
Not yet ingested
- Civics
- —
Market trends
- HPI YoY
- ▼ -160.81%
- Current HPI
- 168.6843
- Rent YoY
- ▼ -2.30%
- Metro
- Detroit-Warren-Dearborn, MI
- State GDP YoY
- ▲ 1.37%
- F500 in state
- 28
Industry mix (Fortune 500 HQ in MI)
| Industry | F500 HQs | Revenue |
|---|---|---|
| Automotive Parts | 3 | $48B |
|
||
| Automotive | 2 | $372B |
|
||
| Chemicals | 1 | $45B |
|
||
| Automotive Retail | 1 | $29B |
|
||
| Healthcare / Medical Devices | 1 | $23B |
|
||
| Automotive Technology | 1 | $20B |
|
||
Price history
+93.9% since first listed28 events — show timeline
- 2026-05-29 Listed $159,999 REALCOMP
- 2026-05-29 Listed $159,999 MiRealSource-MiMLS
- 2026-01-12 Sold (Public Records) $124,000 Public Records
- 2025-08-25 Sold (MLS) $124,000 REALCOMP
- 2025-08-25 Sold (MLS) $124,000 MiRealSource-MiMLS
- 2025-08-05 Pending — MiRealSource-MiMLS
- 2025-08-05 Pending — REALCOMP
- 2025-07-31 Listed $129,000 REALCOMP
- 2025-07-31 Listed $129,000 MiRealSource-MiMLS
- 2008-09-25 Sold (MLS) $3,000 MiRealSource-MiMLS
- 2008-09-25 Sold (MLS) $3,000 REALCOMP
- 2008-08-08 Listing Removed — MiRealSource-MiMLS
- 2008-08-06 Listed $3,500 MiRealSource-MiMLS
- 2008-08-06 Listed $3,500 REALCOMP
- 2007-10-26 Sold (Public Records) $100,000 Public Records
- 2007-09-28 Sold (MLS) $35,000 REALCOMP
- 2007-08-16 Listing Removed — REALCOMP
- 2007-08-16 Listed $34,500 REALCOMP
- 2007-08-08 Listed $34,500 REALCOMP
- 2006-01-20 Sold (Public Records) $125,000 Public Records
- 2005-06-17 Sold (MLS) $66,500 REALCOMP
- 2005-03-22 Listed $72,900 REALCOMP
- 2003-02-06 Sold (Public Records) $125,000 Public Records
- 2002-12-03 Listing Removed — REALCOMP
- 2002-10-03 Listed $99,900 REALCOMP
- 1999-10-21 Sold (Public Records) $83,000 Public Records
- 1999-09-28 Sold (MLS) $83,000 REALCOMP
- 1999-07-17 Listed $82,500 REALCOMP
Property tax history
-1.0%/yrLatest (2025): $1,720 · -55.7% YoY. Source: county tax records.
Cash-flow waterfall
monthlySold comps — $/sqft
last 12 mo · ≤1 miLoading sold comps…