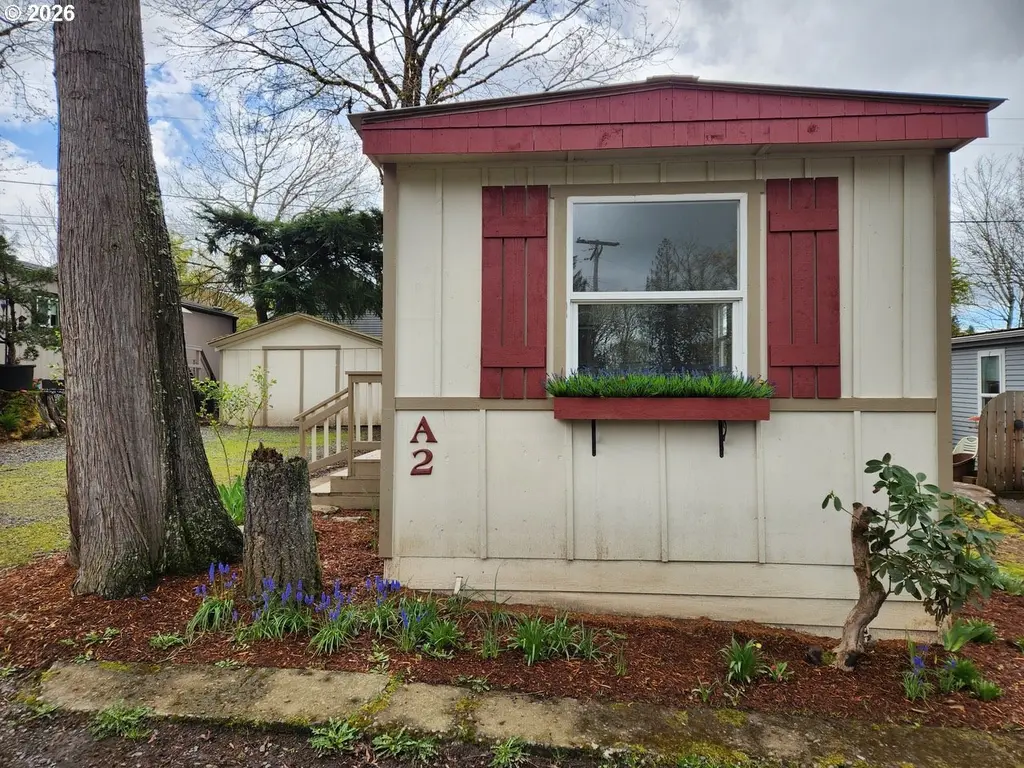
19000 SE Bornstedt Rd Unit A2 · Sandy, OR
Flood risk 1/10 · Minimal
- FEMA flood zone
- X (unshaded)
- Chance of flooding over 30 yrs
- 0.0%
- Est. flood insurance / yr
- $507 – $1,088
Fire risk 4/10 · Minor
- Est. fire insurance / yr
- $498 – $926
Heat risk 2/10 · Minimal
- Hot days now (above 88°F)
- 7 days/yr
- Hot days in 30 yrs
- 15 days/yr
Wind risk 1/10 · Minimal
- Chance of severe wind over 30 yrs
- —
Air-quality risk 9/10 · Severe
- Unhealthy air days now
- 11 days/yr
- Unhealthy air days in 30 yrs
- 12 days/yr
Risk factors via First Street. Map © Google.
Why this score? — see what drove the B grade
The composite is a weighted blend of 9 inputs, each scored 0–100. Each bar is that input's sub-score; the figure is the points it added to the 100-point composite (weight × sub-score).
- Cash flow +30.0/30.0
- 1% rule +10.0/10.0
- DSCR +10.0/10.0
- ARV discount +7.5/15.0
- Schools +5.0/10.0
- Livability +4.2/5.0
- Rent growth +2.5/5.0
- Condition / age +2.5/5.0
- Appreciation +0.0/10.0
$74,900
🖨 Deal sheet 📄 Offer letter ✓ Due diligence
Listing remarks MLS
This clean, fully renovated 2-bed, 1-bath home offers comfortable, move-in-ready living in a quiet Sandy park. Thoughtful updates include a new 50-year roof, upgraded windows, new cabinets with butcher block countertops, a deep farmhouse sink, stylish tile shower and backsplash, and new LVP wood flooring throughout. The 684 sq. ft. layout lives efficiently, while rare features for this price point—such as a 1.5-car garage, a large patio, and a peaceful setting—add exceptional value. A beautifully refreshed home in a location that feels calm, convenient, and welcoming.
Key facts
- Deep farmhouse sink
- Upgraded windows
- New roof
Tags
Neighborhood map
What this means for you Summary
Snapshot
- This is a 2-bed/1.0-bath other listed at $75k.
Deal economics
- At list price, monthly cash flow is $1k ($12k/yr) — positive.
- The deal already cash-flows at list — no discount required.
- Meets the 1% rule at list price ($2k rent vs $75k).
- Recommended offer: $73k (3.0% below list) — sets the bar for market timing.
- Cap rate 22.5% vs local median 2.7% in Sandy — top-decile yield for the area; either an underpriced asset or a hidden risk that comps aren't pricing in. Stress-test before assuming the spread holds.
Location & tenants
- Location reads 84/100 on livability (#30 in OR, #755 nationally) — a professional / high-income tenant draw. Strengths: crime A+, employment A+, housing A+; Watch: cost of living D.
- Oregon Trail SD 46 (town): math 47% / reading 64% proficiency, ranked #12 of 183 in OR (top 7%) — acceptable for families but not a draw, mixed tenant base, ~2y average lease.
- Market conditions: 167 active listings in the ZIP; 1 comparable units currently listed for rent nearby; high-income renter base; 946 units permitted in Clackamas County in 2024 (188 in 5+ unit buildings).
Forward outlook
- Local home prices are declining (-3.0%/yr); year-one equity from $518 of loan paydown is wiped out by about $2k of value loss. Plan a longer hold.
- Clackamas County population projected at +25% by 2050 — long-run rental-demand tailwind backs the buy-and-hold thesis.
- At projected returns (-3.0% appreciation + 3.0% rent growth), your $21k cash investment doubles in ~2 years — after that, you're playing with house money.
Negotiation context
- It's been on market 59 days — a 3% lower offer ($73k) is reasonable based on typical stale-listing flexibility.
Questions for the listing agent
- It's been on market 59 days. Have you received any prior offers? Is the seller open to a 3% concession, seller financing, or rate buy-down credit?
- Built in 1972 — when were the roof, HVAC, electrical panel, plumbing, and water heater last replaced?
- Is there a deadline driving the sale (1031 exchange, divorce, estate, relocation)? That informs how much negotiation room exists.
- Schools are B-rated — typically a magnet for longer-tenancy family renters. What's the average tenant stay here, and is there a school-zone premium baked into asking?
- What's the average days-on-market for RENTAL listings here right now (not sales)? A rising rental-DOM trend means longer vacancies and softer asking-rent achievability than the comps imply.
- What's the recent tenant-quality profile in this submarket — average credit score on applications, eviction rate, late-payment / NSF rate, and stable-employment percentage? A property-management company in the area should have these aggregated.
- How much new for-sale + rental construction is in the pipeline within 1–3 miles? Heavy new supply typically softens prices + rents 12–24 months out; constrained supply supports both.
Investment metrics
- 1% rule
- 2.58% ✓
- Cap rate
- 22.48%
- Cash-on-cash
- 57.80%
- DSCR
- 3.57
- GRM
- 3.2
CMA / ARV
- ARV (median comp)
- $49,484
- List price
- $74,900
- Delta
- 51.36%
- Verdict
- OVERPRICED
- Comps
- 4 within 1.0 mi
Projected returns pro-forma
-3.0% appreciation · 3.0% rent growth · sell at horizon
- IRR
- 56.3%
- Equity multiple
- 3.49×
- Total profit
- $52,232
- Equity at exit
- $11,168
- IRR
- 61.3%
- Equity multiple
- 7.12×
- Total profit
- $128,449
- Equity at exit
- $6,476
Cash invested: $20,972 (down + closing). Projections, not guarantees.
Landlord ↔ Tenant lean methodology
- Overall (STATE)
- 28 Tenant-Leaning
- State Oregon
- 28 Tenant-Leaning · D+6
- County
- — inherits STATE
- City
- — inherits STATE
ZIP-level market 97055
- Active inventory
- 167
- Price-to-rent
- 3.2×
Monthly cashflow live
- Estimated rent
- $1,934 medium interval (Pro) →
- Mortgage (P&I)
- −$393
- Tax est. 1.5%
- −$94 /mo · $1,124/yr
- Insurance
- −$31
- HOA
- −$0
- Vacancy / Maint / Mgmt
- −$406
- Net cashflow
- $1,010
Break-even live
UW: 25.0% down · 7.5% · 30yr · 1.5% tax · 5.0% vac · 8.0% maint · 8.0% mgmt
Financing live
Cash to close
- Down payment
- $18,725
- Closing costs
- $2,247
- Reserves months
- —
- Total cash needed
- —
Loan-product check · same deal, 3 products live
Conventional
25% down · 7.5% · 30yr
- Down + closing
- —
- Monthly P&I
- —
- Monthly cashflow
- —
- DSCR
- —
- Eligible?
- —
Personal DTI + credit; lowest rate.
DSCR
20% down · 8.5% · 30yr
- Down + closing
- —
- Monthly P&I
- —
- Monthly cashflow
- —
- DSCR
- —
- Eligible?
- —
No personal income docs; deal must DSCR.
Hard money
10% down · 12.0% · 12mo
- Down + closing
- —
- Monthly P&I
- —
- Monthly cashflow
- —
- DSCR
- —
- Eligible?
- —
Short-term bridge; refi at stabilization.
Rent comps 1 comps
| Address | Beds | Baths | Sqft | Rent | $/sqft | DOM | Units | Dist |
|---|---|---|---|---|---|---|---|---|
| 38100 Sandy Heights St Sandy, OR | 2.0 | 1.0–2.0 | 864 | $2,070 | $2.39 | 1d | 11 | 0.63mi |
Listing history 11 events
-
2026-06-15statusdays on market $74,900 Pending 59 DOM
-
2026-06-13days on market $74,900 Active 58 DOM
-
2026-06-13days on market $74,900 Active 57 DOM
-
2026-06-09days on market $74,900 Active 54 DOM
-
2026-06-08days on market $74,900 Active 53 DOM
-
2026-06-07days on market $74,900 Active 52 DOM
-
2026-06-03days on market $74,900 Active 48 DOM
-
2026-06-02days on market $74,900 Active 47 DOM
-
2026-06-01days on market $74,900 Active 46 DOM
-
2026-05-31days on market $74,900 Active 45 DOM
-
2026-04-16$74,900 Active 586-char remark
Show marketing remark (586 chars)
This clean, fully renovated 2-bed, 1-bath home offers comfortable, move-in-ready living in a quiet Sandy park. Thoughtful updates include a new 50-year roof, upgraded windows, new cabinets with butcher block countertops, a deep farmhouse sink, stylish tile shower and backsplash, and new LVP wood flooring throughout. The 684 sq. ft. layout lives efficiently, while rare features for this price point—such as a 1.5-car garage, a large patio, and a peaceful setting—add exceptional value. A beautifully refreshed home in a location that feels calm, convenient, and welcoming.
ⓘ Source: listings_history table (triggers on properties + properties_extension) + one-shot
backfill from property_details.listing_events for pre-trigger history.
Climate risk First Street
- Flood 1/10 Low FEMA zone X (unshaded) · 0% chance over 30 yrs
- Wildfire 4/10 Moderate
- Heat 2/10 Low 7 d/yr ≥88°F today · 15 d/yr by 30 yrs out
- Wind 1/10 Low
- Air quality 9/10 Extreme 11 unhealthy d/yr today · 12 by 30 yrs out
Nearby sold comps map
Loading sold comps map…
Walkable amenities ~0.75 mi
Loading nearby amenities…
Taxation est. · year 1
- Rental income
- $23,207
- − Mortgage interest
- −$4,196
- − Property taxes
- −$1,124
- − Insurance
- −$374
- − Repairs & maintenance
- −$1,857
- − Management
- −$1,857
- − Depreciation
- −$2,179
- Taxable income
- $11,622
- Est. tax owed @ 24.0%
- −$2,789
- After-tax cash flow
- $9,333/yr
For passive investors: Depreciation is non-cash, so a rental often shows a tax loss while cash-flowing — sheltering income. Rental losses are passive: they offset passive income freely, and up to $25,000/yr can offset ordinary (W-2) income if you actively participate and your MAGI is under $100k (phasing out to $0 by $150k); unused losses carry forward. On sale, claimed depreciation is recaptured at up to 25%, and gains may owe capital-gains tax (a 1031 exchange can defer both). Figures are a year-1 estimate at your 24.0% rate — not tax advice; consult a CPA.
Schools (NCES district)
- District
- Oregon Trail SD 46
- NCES district ID
- 4110890
- Math proficiency
- 47% ▬ 0.00%
- Reading proficiency
- 64% ▲ 1.00%
- Median HH income
- $61,406
- Composite
- 50.19/100
- National rank
- #4075
- State rank
- #12 of 183 in OR
Livability — Sandy
- Score
- 84/100
- State rank
- #30
- US rank
- #755
Category grades
Schools grade is shown separately in the Schools card above.
Census & demographics
- County
- Clackamas County · 361,406 people
- City population
- 19,786
- Metro
- Portland-Vancouver-Hillsboro, OR-WA
- Population (ZIP)
- 19,786
- Household income
- $112,323
- Rent vs Own
- Severe rent burden
- 377.0
Population outlook (Clackamas County) Hauer SSP2
- Today (2025)
- 458,456 people
- By 2030
- 485,185 · +5.8%
- By 2040
- 532,932 · +16.2%
- By 2050
- 574,445 · +25.3%
- By 2075
- 665,497 · +45.2%
- By 2100
- 697,488 · +52.1%
Race, ethnicity, and origin ACS 2023
- Neighborhood character
- Predominantly White (87%)
- Race & ethnicity
- White 87% Two or more races 8% Hispanic / Latino 5% Asian 1% Native American 1%
- Common ancestry
- Portuguese 4% Iranian 4% Italian 3%
- Foreign-born
- 4% · Canada, Vietnam
- Languages at home
- 95% English-only · Spanish 2% Other Asian/Pacific 1% German/W. Germanic 1%
Political lean MEDSL · Clackamas
- 2024 margin
- Lean D (+9.7) · D 53.4% · R 43.6% · Other 3.0%
- 2008→2024 swing
- -0.6pp no change · 2008: 10.4pp · 2024: 9.7pp
- All cycles
- 2024: D+9.7 2020: D+11.1 2016: D+6.1 2012: D+3.5 2008: D+10.4
Not yet ingested
- Civics
- —
Market trends
- HPI YoY
- ▼ -230.74%
- Current HPI
- 274.9046
- Rent YoY
- —
- Metro
- Portland-Vancouver-Hillsboro, OR-WA
- State GDP YoY
- ▲ 2.05%
- F500 in state
- 2
Industry mix (Fortune 500 HQ in OR)
| Industry | F500 HQs | Revenue |
|---|---|---|
| Consumer Goods | 1 | $51B |
|
||
Price history
1 event — show timeline
- 2026-04-16 Listed $74,900 RMLS
Property tax history
+1.5%/yrLatest (2025): $53 · +230.5% YoY. Source: county tax records.
Cash-flow waterfall
monthlySold comps — $/sqft
last 12 mo · ≤1 miLoading sold comps…