98 Spooner St · DeFuniak Springs, FL
Flood risk 1/10 · Minimal
- FEMA flood zone
- X (unshaded)
- Chance of flooding over 30 yrs
- 0.0%
- Est. flood insurance / yr
- $507 – $1,088
Fire risk 5/10 · Moderate
- Est. fire insurance / yr
- $947 – $1,759
Heat risk 8/10 · Major
- Hot days now (above 107°F)
- 7 days/yr
- Hot days in 30 yrs
- 20 days/yr
Wind risk 9/10 · Severe
- Chance of severe wind over 30 yrs
- 99.0%
Air-quality risk 1/10 · Minimal
- Unhealthy air days now
- 0 days/yr
- Unhealthy air days in 30 yrs
- 0 days/yr
Risk factors via First Street. Map © Google.
Why this score? — see what drove the D- grade
The composite is a weighted blend of 9 inputs, each scored 0–100. Each bar is that input's sub-score; the figure is the points it added to the 100-point composite (weight × sub-score).
- Appreciation +10.0/10.0
- Cash flow +6.0/30.0
- ARV discount +5.8/15.0
- Schools +5.2/10.0
- Livability +3.2/5.0
- Rent growth +2.5/5.0
- Condition / age +2.5/5.0
- 1% rule +1.5/10.0
- DSCR +0.3/10.0
$285,000
🖨 Deal sheet 📄 Offer letter ✓ Due diligence
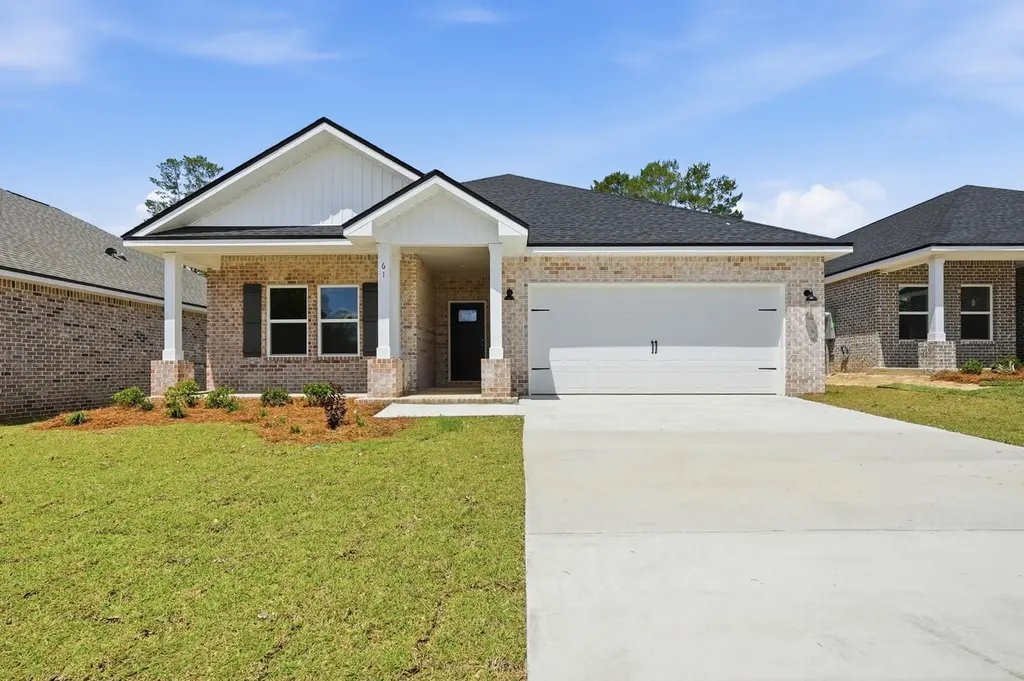
Listing remarks
ALL BRICK AND A NOTICEABLE CUT ABOVE can be seen throughout this ''Maybell III'' floor plan. So conveniently located across from Walton High in McCarthy Estates! All brick construction, fully landscaped yards, finished garage, front & rear porches. Open floor plan featuring raised ceilings, recessed lighting and plenty of windows for natural light. Family gathering space overlooks kitchen & cozy dining nook. Kitchen work island w/ bar seating, corner pantry, quartz countertops and white shaker cabinets. Owner's bath has double vanities, walk-in closet + linen storage, shower only. Luxury vinyl plank flooring in common areas, carpet in bedrooms. Seller may contribute up to $15,0
Key facts
- Open floor plan
- Front porches
- Rear porches
Tags
Property features AI
Finance
- HOA & community: Located in the McCarthy Estates subdivision
Exterior
- Parking: Attached garage with 2 spaces; Garage door opener
- Security: Smoke detectors
- Utilities: Electric service; Public water; Public sewer
- Home design: Single-story Craftsman-style home; Entry and primary living on first floor; Shingle roof; Year built 2026
- Construction: Brick exterior with aluminum and vinyl trim; Built in 2026
- Exterior features: Porch / covered porch; Covenants and restrictions; Interior, level lot; City street frontage (paved road)
Interior
- Kitchen: Kitchen located on first floor; Kitchen island
- Bedrooms: 3 bedrooms (master on first floor, carpeted)
- Flooring: Vinyl flooring; Carpet
- Bathrooms: 2 bathrooms (both full); Master bathroom with double vanity, shower only, and walk-in closet
- Heating & cooling: Central heating; Central air conditioning; Ceiling fans
- Interior features: Vaulted ceilings; Kitchen island; Recessed lighting; Newly painted; Pantry; Pull-down attic stairs; Built-in shelving; Split bedroom floorplan; Washer/dryer hookup; Double pane windows; Doors with energy-efficient features
- Laundry & utility: Washer/dryer hookup; Electric water heater
Neighborhood map
What this means for you Summary
Snapshot
- This is a 3-bed/2.0-bath single-family listed at $285k.
Deal economics
- At list price, monthly cash flow is $-551 ($-7k/yr) — negative.
- To cash-flow at today's rent, offer at most $205k (28.0% below list).
- To meet the 1% rule (rent ≥ 1% of price), the offer needs to be $184k (35.3% below list).
- Recommended offer: $184k (35.3% below list) — sets the bar for 1% rule.
Location & tenants
- Location reads 64/100 on livability (#694 in FL) — a middle-class / working-renter tenant base. Strengths: cost of living A+, housing A+; Watch: health & safety C-, crime D, amenities F.
- Walton (rural): math 62% / reading 61% proficiency, ranked #10 of 73 in FL (top 14%) — acceptable for families but not a draw, mixed tenant base, ~2y average lease.
- Zoned schools: Maude Saunders Elementary School (math 58% / reading 52%, grade C, #872 of 2,144 statewide, top 42%, 553 students, 87% FRL); Walton High School (math 52% / reading 53%, grade C-, #154 of 667 statewide, top 24%, 856 students, 65% FRL) — zoned schools average 76% FRL vs 48% district-wide (28 pts higher); higher-poverty schools than district average — tighter screening recommended.
- Market conditions: 422 active listings in the ZIP; 3 comparable units currently listed for rent nearby; rentals leasing fast (median 14d on market — plan ~1-2 weeks tenant-placement turnaround); 2,883 units permitted in Walton County in 2024 (1,322 in 5+ unit buildings).
- This rent runs 42% of the median local income ($52k/yr) — at the standard rent-burdened threshold; future hikes will face affordability resistance.
Forward outlook
- In year one you build about $30k of equity ($2k loan paydown + $28k appreciation (10.0% local appreciation)).
- Walton County population projected at +46% by 2050 — long-run rental-demand tailwind backs the buy-and-hold thesis.
- By year 2, paydown + projected appreciation supports a ~$49k cash-out refi (75% LTV) — recoverable capital for the next deal without selling this one.
Negotiation context
- It's been on market 20 days — a 2% lower offer ($281k) is reasonable based on typical stale-listing flexibility.
Risks & watch-outs
- Climate carrying-cost: severe wind risk, 99% chance of damaging wind over 30y; moderate wildfire risk; extreme-heat days projected 7→20/yr by 2055 (HVAC capex compounding) — expect insurance premiums to compound above CPI over the hold.
Questions for the listing agent
- What do current leases actually rent for vs. the listed asking? Can we see a recent rent roll and the last 12 months of T-12 income?
- What does the HOA fee cover, when was the last increase, and are there any pending special assessments or reserve-fund shortfalls?
- Is there a deadline driving the sale (1031 exchange, divorce, estate, relocation)? That informs how much negotiation room exists.
- Schools are D-rated, which usually means shorter tenancies and higher turnover. Who's the typical renter profile here, and what's been the actual vacancy rate?
- Crime grade is D in this area — have there been break-ins, vandalism, or insurance claims at this property in the last 3 years? What carrier currently insures it and at what premium?
- The area grade is low — what's the realistic commute time and amenity access for the typical tenant pool here? Any planned neighborhood developments (good or bad) we should know about?
- What's the average days-on-market for RENTAL listings here right now (not sales)? A rising rental-DOM trend means longer vacancies and softer asking-rent achievability than the comps imply.
- What's the recent tenant-quality profile in this submarket — average credit score on applications, eviction rate, late-payment / NSF rate, and stable-employment percentage? A property-management company in the area should have these aggregated.
- How much new for-sale + rental construction is in the pipeline within 1–3 miles? Heavy new supply typically softens prices + rents 12–24 months out; constrained supply supports both.
Investment metrics
- 1% rule
- 0.65% ✗
- Cap rate
- 3.97%
- Cash-on-cash
- -8.28%
- DSCR
- 0.63
- GRM
- 12.9
CMA / ARV
- ARV (on-the-fly)
- $274,720
- Comps found
- 8
Show comp detail 8 sales within ~0.75 mi
| Address | Dist | Beds/Ba | Sqft | Sold | Price | $/sf | Match |
|---|---|---|---|---|---|---|---|
| 61 Spooner St | 0.38mi | 3/2.0 | 1,616 (0%) | 0mo | $282,000 | $175 | 82 |
| 148 Engelbrecht Rd | 0.67mi | 3/2.0 | 1,630 (+1%) | 10mo | $350,000 | $215 | 59 |
| 25 Brandons Ct | 0.30mi | 4/2.0 (+1) | 1,781 (+10%) | 14mo | $260,000 | $146 | 52 |
| 76 Cora Rd | 0.28mi | 4/2.0 (+1) | 1,781 (+10%) | 16mo | $275,000 | $154 | 52 |
| 752 Magnolia Lake Dr | 0.61mi | 3/2.0 | 1,416 (-12%) | 2mo | $356,950 | $252 | 49 |
| 1155 N 20th St. St | 0.51mi | 3/1.5 | 1,400 (-13%) | 6mo | $225,000 | $161 | 47 |
| 140 Orson Dr | 0.33mi | 4/1.0 (+1) | 1,456 (-10%) | 15mo | $227,000 | $156 | 47 |
| 83 Timber Wind Dr | 0.58mi | 4/2.0 (+1) | 1,426 (-12%) | 22mo | $242,000 | $170 | 30 |
Match score weights: distance 35% · size 25% · config 20% · recency 20%. Top-matched comps best support the ARV.
Projected returns pro-forma
10.0% appreciation · 3.0% rent growth · sell at horizon
- IRR
- 18.5%
- Equity multiple
- 2.51×
- Total profit
- $120,198
- Equity at exit
- $256,751
- IRR
- 17.2%
- Equity multiple
- 5.78×
- Total profit
- $381,642
- Equity at exit
- $553,692
Cash invested: $79,800 (down + closing). Projections, not guarantees.
Landlord ↔ Tenant lean methodology
- Overall (STATE)
- 87 Strongly Landlord-Friendly
- State Florida
- 87 Strongly Landlord-Friendly · R+3
- County
- — inherits STATE
- City
- — inherits STATE
ZIP-level market 32433
- Home prices YoY
- 4.2%
- Active inventory
- 422
- Price-to-rent
- 12.9×
Monthly cashflow live
- Estimated rent
- $1,843 medium interval (Pro) →
- Mortgage (P&I)
- −$1,495
- Tax est. 1.5%
- −$356 /mo · $4,275/yr
- Insurance
- −$119
- HOA
- −$37
- Vacancy / Maint / Mgmt
- −$387
- Net cashflow
- $-551
Break-even live
UW: 25.0% down · 7.5% · 30yr · 1.5% tax · 5.0% vac · 8.0% maint · 8.0% mgmt
Financing live
Cash to close
- Down payment
- $71,250
- Closing costs
- $8,550
- Reserves months
- —
- Total cash needed
- —
Loan-product check · same deal, 3 products live
Conventional
25% down · 7.5% · 30yr
- Down + closing
- —
- Monthly P&I
- —
- Monthly cashflow
- —
- DSCR
- —
- Eligible?
- —
Personal DTI + credit; lowest rate.
DSCR
20% down · 8.5% · 30yr
- Down + closing
- —
- Monthly P&I
- —
- Monthly cashflow
- —
- DSCR
- —
- Eligible?
- —
No personal income docs; deal must DSCR.
Hard money
10% down · 12.0% · 12mo
- Down + closing
- —
- Monthly P&I
- —
- Monthly cashflow
- —
- DSCR
- —
- Eligible?
- —
Short-term bridge; refi at stabilization.
Rent comps 3 comps
| Address | Beds | Baths | Sqft | Rent | $/sqft | DOM | Units | Dist |
|---|---|---|---|---|---|---|---|---|
| 51 Yearling Ct Defuniak Springs, FL | 3.0 | 2.0 | 1397 | $1,895 | $1.36 | 21d | 1 | 0.76mi |
| 51 Yearling Ct Defuniak Springs, FL | 3.0 | 2.0 | 1397 | $1,750 | $1.25 | 13d | 1 | 0.76mi |
| 594 Hunters Ridge Rd Defuniak Springs, FL | 3.0 | 2.0 | 1654 | $1,950 | $1.18 | 13d | 1 | 0.87mi |
HOA detail
- Monthly dues
- $37 · $444/yr
Listing history 17 events
-
2026-06-18days on market $285,000 Active 20 DOM
-
2026-06-17days on market $285,000 Active 19 DOM
-
2026-06-16days on market $285,000 Active 18 DOM
-
2026-06-15days on market $285,000 Active 17 DOM
-
2026-06-14days on market $285,000 Active 15 DOM
-
2026-06-13days on market $285,000 Active 14 DOM
-
2026-06-10days on market $285,000 Active 12 DOM
-
2026-06-09days on market $285,000 Active 11 DOM
-
2026-06-08days on market $285,000 Active 10 DOM
-
2026-06-07days on market $285,000 Active 9 DOM
-
2026-06-05days on market $285,000 Active 6 DOM
-
2026-06-03days on market $285,000 Active 5 DOM
-
2026-06-02days on market $285,000 Active 4 DOM
-
2026-06-01days on market $285,000 Active 3 DOM
-
2026-05-31days on market $285,000 Active 2 DOM
-
2026-05-30remarks 691-char remark
-
2026-05-30$285,000 Active 1 DOM
ⓘ Source: listings_history table (triggers on properties + properties_extension) + one-shot
backfill from property_details.listing_events for pre-trigger history.
Climate risk First Street
- Flood 1/10 Low FEMA zone X (unshaded) · 0% chance over 30 yrs
- Wildfire 5/10 Major
- Heat 8/10 Severe 7 d/yr ≥107°F today · 20 d/yr by 30 yrs out
- Wind 9/10 Extreme 99% chance of damaging wind over 30 yrs
- Air quality 1/10 Low 0 unhealthy d/yr today · 0 by 30 yrs out
Nearby sold comps map
Loading sold comps map…
Walkable amenities ~0.75 mi
Loading nearby amenities…
Taxation est. · year 1
- Rental income
- $22,115
- − Mortgage interest
- −$15,964
- − Property taxes
- −$4,275
- − Insurance
- −$1,425
- − Repairs & maintenance
- −$1,769
- − Management
- −$1,769
- − HOA
- −$444
- − Depreciation
- −$8,291
- Taxable loss
- −$11,823
- Est. tax savings @ 24.0%
- +$2,837
- After-tax cash flow
- $-3,770/yr
For passive investors: Depreciation is non-cash, so a rental often shows a tax loss while cash-flowing — sheltering income. Rental losses are passive: they offset passive income freely, and up to $25,000/yr can offset ordinary (W-2) income if you actively participate and your MAGI is under $100k (phasing out to $0 by $150k); unused losses carry forward. On sale, claimed depreciation is recaptured at up to 25%, and gains may owe capital-gains tax (a 1031 exchange can defer both). Figures are a year-1 estimate at your 24.0% rate — not tax advice; consult a CPA.
Schools (NCES district)
- District
- Walton
- NCES district ID
- 1201980
- Math proficiency
- 62% ▼ -4.00%
- Reading proficiency
- 61% ▼ -2.00%
- Median HH income
- $46,794
- Composite
- 52.03/100
- National rank
- #1634
- State rank
- #10 of 73 in FL
Livability — DeFuniak Springs
- Score
- 64/100
- State rank
- #694
- US rank
- #14475
Category grades
Schools grade is shown separately in the Schools card above.
Census & demographics
- Census place
- DeFuniak Springs, FL
- County
- Walton County · 70,839 people
- City population
- 19,746
- Metro
- Crestview-Fort Walton Beach-Destin, FL
- Population (ZIP)
- 19,746
- Household income
- $52,199
- Rent vs Own
- Severe rent burden
- 356.0
Population outlook (Walton County) Hauer SSP2
- Today (2025)
- 80,014 people
- By 2030
- 88,120 · +10.1%
- By 2040
- 103,537 · +29.4%
- By 2050
- 117,034 · +46.3%
- By 2075
- 143,901 · +79.8%
- By 2100
- 155,138 · +93.9%
Race, ethnicity, and origin ACS 2023
- Neighborhood character
- Predominantly White (75%)
- Race & ethnicity
- White 75% Black 10% Hispanic / Latino 8% Two or more races 7% Native American 1%
- Hispanic origin (detail)
- Mexican 5%
- Common ancestry
- Slovak 3% Italian 2% Lithuanian 2%
- Foreign-born
- 6% · Canada
- Languages at home
- 92% English-only · Spanish 4% Other Indo-European 1% French/Haitian/Cajun 1%
Political lean MEDSL · Walton
- 2024 margin
- Solid R (+57.8) · D 20.7% · R 78.6%
- 2008→2024 swing
- -12.0pp toward R · 2008: -45.8pp · 2024: -57.8pp
- All cycles
- 2024: R+57.8 2020: R+51.7 2016: R+56.1 2012: R+52.0 2008: R+45.8
Not yet ingested
- Civics
- —
Market trends
- HPI YoY
- ▲ 14.77%
- Current HPI
- 367.046
- Rent YoY
- —
- Metro
- Crestview-Fort Walton Beach-Destin, FL
- State GDP YoY
- ▲ 3.28%
- F500 in state
- 36
Industry mix (Fortune 500 HQ in FL)
| Industry | F500 HQs | Revenue |
|---|---|---|
| Industrial Technology | 2 | $29B |
|
||
| Insurance | 2 | $17B |
|
||
| Retail | 1 | $60B |
|
||
| Technology Distribution | 1 | $58B |
|
||
| Homebuilding | 1 | $35B |
|
||
| Technology Manufacturing | 1 | $35B |
|
||
Price history
1 event — show timeline
- 2026-05-29 Listed $285,000 ECAR
Cash-flow waterfall
monthlySold comps — $/sqft
last 12 mo · ≤1 miLoading sold comps…