17 Fox Haven Rd · Kidder, PA
Flood risk 1/10 · Minimal
- FEMA flood zone
- X (unshaded)
- Chance of flooding over 30 yrs
- 0.0%
- Est. flood insurance / yr
- $507 – $1,088
Fire risk 2/10 · Minimal
- Est. fire insurance / yr
- $511 – $949
Heat risk 2/10 · Minimal
- Hot days now (above 89°F)
- 7 days/yr
- Hot days in 30 yrs
- 16 days/yr
Wind risk 4/10 · Minor
- Chance of severe wind over 30 yrs
- 8.0%
Air-quality risk 2/10 · Minimal
- Unhealthy air days now
- 1 days/yr
- Unhealthy air days in 30 yrs
- 2 days/yr
Risk factors via First Street. Map © Google.
Why this score? — see what drove the D- grade
The composite is a weighted blend of 9 inputs, each scored 0–100. Each bar is that input's sub-score; the figure is the points it added to the 100-point composite (weight × sub-score).
- Cash flow +13.8/30.0
- DSCR +4.2/10.0
- 1% rule +3.9/10.0
- ARV discount +3.6/15.0
- Appreciation +3.6/10.0
- Schools +3.1/10.0
- Rent growth +2.5/5.0
- Livability +2.5/5.0
- Condition / age +2.2/5.0
$225,000
🖨 Deal sheet (PDF) 📄 Offer letter ✓ Due diligence
Listing remarks MLS
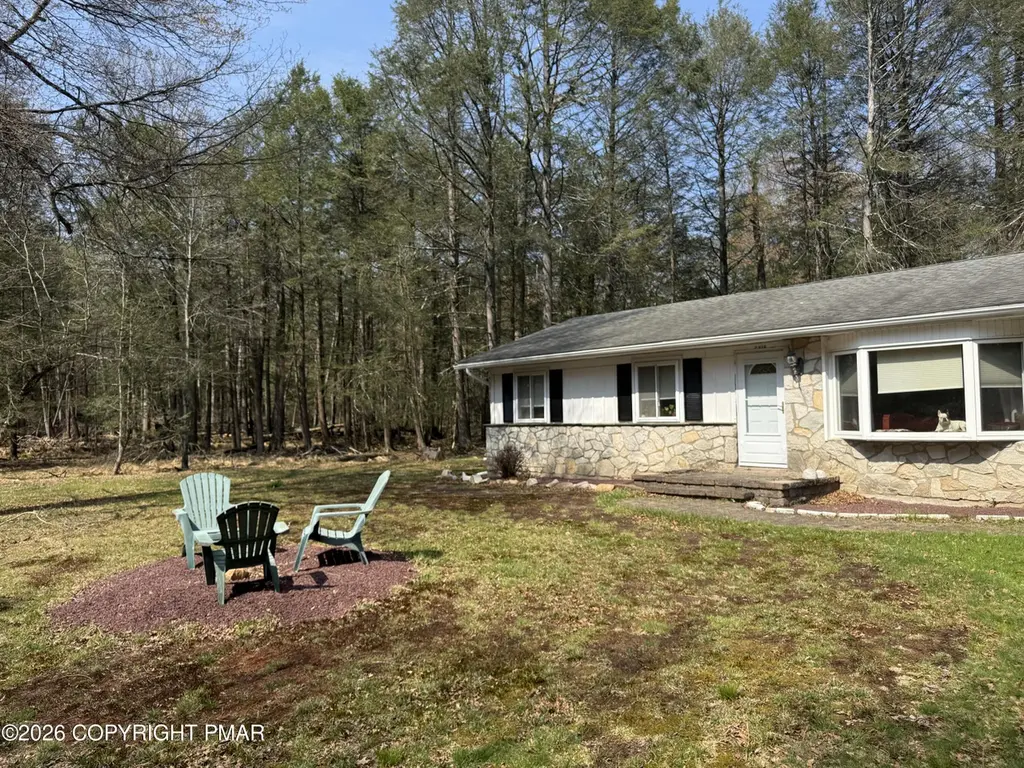
3 bedrooms, 1 bath, updated kitchen, dining area, living room with a stone propane fireplace, and an oversized 1-car attached garage. Located in Holiday Pocono, close to the PA Turnpike and Route 80 for easy commuting. STRs are not permitted. Being sold as is. Motivated seller!
Key facts
- Gated community
- Clubhouse
- Two lakes
Tags
Property features AI
Exterior
- Parking: Attached garage (1 car)
- Utilities: Well water; Septic tank
- Home design: One-story house; 960 above-grade finished area
- Construction: Aluminum siding, stone, and vinyl siding exterior; Asphalt/fiberglass roof
- Exterior features: Crawl space foundation; Lot zoned R2
Interior
- Kitchen: Electric cooktop
- Bedrooms: Three first-floor bedrooms (approx. 10' x 9', 12' x 9', and 12.2' x 11.5')
- Bathrooms: One full bathroom
- Heating & cooling: Electric heating; Fireplace heating (insert)
- Interior features: Dining area; Separate/formal dining room; Living room fireplace with insert
- Laundry & utility: Electric water heater
Neighborhood map
What this means for you Summary
Snapshot
- This is a 3-bed/1.0-bath single-family listed at $225k. Condition is rated fair.
Deal economics
- At list price, monthly cash flow is $22 ($263/yr) — positive.
- The deal already cash-flows at list — no discount required.
- To meet the 1% rule (rent ≥ 1% of price), the offer needs to be $200k (11.3% below list).
- Recommended offer: $200k (11.3% below list) — sets the bar for 1% rule.
Location & tenants
- Location reads: area grade D — affects rentability + tenant quality, not the cash-flow math above.
- Jim Thorpe Area SD (rural): math 25% / reading 47% proficiency, ranked #394 of 539 in PA (top 73%) — families likely to look elsewhere, expect single-tenant / working-renter base with shorter leases.
- Zoned schools: Penn-Kidder Campus (math 18% / reading 45%, grade F, #1,112 of 1,518 statewide, top 73%, 571 students, 62% FRL); Jim Thorpe Area Hs (math 62% / reading 75%, grade B, #53 of 437 statewide, top 13%, 565 students, 45% FRL) — zoned schools average 54% FRL vs 38% district-wide (16 pts higher); higher-poverty schools than district average — tighter screening recommended.
- Zoned-school proficiency averages 50% at this address vs 36% district-wide (+14 pts) — the actual schools serving this property are materially stronger than the Jim Thorpe Area SD average implies; a family-tenant draw the district grade alone would hide.
- Market conditions: 456 active listings in the ZIP; 180 units permitted in Carbon County in 2024 (10 in 5+ unit buildings).
Forward outlook
- Local home prices are declining (-2.9%/yr); year-one equity from $2k of loan paydown is wiped out by about $6k of value loss. Plan a longer hold.
- Carbon County population projected at -18% by 2050 — secular population decline; favor cash flow + early exit over multi-decade hold.
Negotiation context
- It's been on market 54 days — a 3% lower offer ($218k) is reasonable based on typical stale-listing flexibility.
- 2 sale attempts with the ask held roughly flat each time — persistent listings suggest the price (not the market) is what's stuck; bring a comps-based counter.
Questions for the listing agent
- It's been on market 54 days. Have you received any prior offers? Is the seller open to a 11% concession, seller financing, or rate buy-down credit?
- Have any recent inspections been done? Can we get a copy of the seller's disclosures and any deferred-maintenance estimates?
- Built in 1962 — when were the roof, HVAC, electrical panel, plumbing, and water heater last replaced?
- Is there a deadline driving the sale (1031 exchange, divorce, estate, relocation)? That informs how much negotiation room exists.
- The area grade is low — what's the realistic commute time and amenity access for the typical tenant pool here? Any planned neighborhood developments (good or bad) we should know about?
- What's the average days-on-market for RENTAL listings here right now (not sales)? A rising rental-DOM trend means longer vacancies and softer asking-rent achievability than the comps imply.
- What's the recent tenant-quality profile in this submarket — average credit score on applications, eviction rate, late-payment / NSF rate, and stable-employment percentage? A property-management company in the area should have these aggregated.
- How much new for-sale + rental construction is in the pipeline within 1–3 miles? Heavy new supply typically softens prices + rents 12–24 months out; constrained supply supports both.
Investment metrics
- 1% rule
- 0.89% ✗
- Cap rate
- 6.41%
- Cash-on-cash
- 0.42%
- DSCR
- 1.02
- GRM
- 9.4
CMA / ARV
- ARV (median comp)
- $207,137
- List price
- $225,000
- Delta
- 8.62%
- Verdict
- FAIR
- Comps
- 20 within 1.0 mi
Show comp detail 6 sales within ~0.75 mi
| Address | Dist | Beds/Ba | Sqft | Sold | Price | $/sf | Match |
|---|---|---|---|---|---|---|---|
| 32 Foxhaven Rd | 0.08mi | 2/1.0 (-1) | 945 (-2%) | 7mo | $205,000 | $217 | 83 |
| 41 Redwood Dr | 0.66mi | 3/1.0 | 960 (0%) | 16mo | $225,000 | $234 | 56 |
| 63 Tallwood Dr | 0.42mi | 3/1.0 | 896 (-7%) | 18mo | $76,000 | $85 | 54 |
| 24 Skyline Ln | 0.62mi | 2/1.0 (-1) | 950 (-1%) | 15mo | $220,000 | $232 | 52 |
| 132 Tanglewood | 0.46mi | 3/1.0 | 1,056 (+10%) | 21mo | $162,500 | $154 | 44 |
| 67 Tallwood Dr | 0.41mi | 3/2.0 | 1,056 (+10%) | 19mo | $165,000 | $156 | 44 |
Match score weights: distance 35% · size 25% · config 20% · recency 20%. Top-matched comps best support the ARV.
Projected returns pro-forma
-2.89% appreciation · 3.0% rent growth · sell at horizon
- IRR
- -14.9%
- Equity multiple
- 0.46×
- Total profit
- $-33,968
- Equity at exit
- $34,682
- IRR
- -6.5%
- Equity multiple
- 0.58×
- Total profit
- $-26,751
- Equity at exit
- $21,407
Cash invested: $63,000 (down + closing). Projections, not guarantees.
Landlord ↔ Tenant lean methodology
- Overall (STATE)
- 62 Landlord-Friendly
- State Pennsylvania
- 62 Landlord-Friendly · EVEN
- County
- — inherits STATE
- City
- — inherits STATE
ZIP-level market 18210
- Home prices YoY
- -1.4%
- Active inventory
- 456
- Price-to-rent
- 9.4×
Monthly cashflow live
- Estimated rent
- $1,996 medium interval (Pro) →
- Mortgage (P&I)
- −$1,180
- Tax est. 1.5%
- −$281 /mo · $3,375/yr
- Insurance
- −$94
- HOA
- −$0
- Vacancy / Maint / Mgmt
- −$419
- Net cashflow
- $22
Break-even live
Sensitivity live
| Price | -10% $177 | -5% $100 | +0% $22 | +5% $-56 | +10% $-134 |
|---|---|---|---|---|---|
| Rent | -10% $-136 | -5% $-57 | +0% $22 | +5% $101 | +10% $180 |
| Rate | -1.0pp $135 | -0.5pp $79 | base $22 | +0.5pp $-36 | +1.0pp $-96 |
UW: 25.0% down · 7.5% · 30yr · 1.5% tax · 5.0% vac · 8.0% maint · 8.0% mgmt
Financing live
Cash to close
- Down payment
- $56,250
- Closing costs
- $6,750
- Reserves months
- —
- Total cash needed
- —
Loan-product check · same deal, 3 products live
Conventional
25% down · 7.5% · 30yr
- Down + closing
- —
- Monthly P&I
- —
- Monthly cashflow
- —
- DSCR
- —
- Eligible?
- —
Personal DTI + credit; lowest rate.
DSCR
20% down · 8.5% · 30yr
- Down + closing
- —
- Monthly P&I
- —
- Monthly cashflow
- —
- DSCR
- —
- Eligible?
- —
No personal income docs; deal must DSCR.
Hard money
10% down · 12.0% · 12mo
- Down + closing
- —
- Monthly P&I
- —
- Monthly cashflow
- —
- DSCR
- —
- Eligible?
- —
Short-term bridge; refi at stabilization.
Listing history 17 events
-
2026-06-22days on market $225,000 Active 54 DOM
-
2026-06-18days on market $225,000 Active 51 DOM
-
2026-06-17days on market $225,000 Active 50 DOM
-
2026-06-16days on market $225,000 Active 49 DOM
-
2026-06-15days on market $225,000 Active 48 DOM
-
2026-06-14days on market $225,000 Active 46 DOM
-
2026-06-10days on market $225,000 Active 43 DOM
-
2026-06-09days on market $225,000 Active 42 DOM
-
2026-06-08days on market $225,000 Active 41 DOM
-
2026-06-07days on market $225,000 Active 40 DOM
-
2026-06-03days on market $225,000 Active 36 DOM
-
2026-06-02days on market $225,000 Active 35 DOM
-
2026-06-01days on market $225,000 Active 34 DOM
-
2026-05-31days on market $225,000 Active 33 DOM
-
2026-05-31days on market $225,000 Active 32 DOM
-
2026-04-24$225,000 Active 278-char remark
Show marketing remark (278 chars)
3 bedrooms, 1 bath, updated kitchen, dining area, living room with a stone propane fireplace, and an oversized 1-car attached garage. Located in Holiday Pocono, close to the PA Turnpike and Route 80 for easy commuting. STRs are not permitted. Being sold as is. Motivated seller!
-
2026-04-24$225,000 Active 114-char remark
Show marketing remark (278 chars)
3 bedrooms, 1 bath, updated kitchen, dining area, living room with a stone propane fireplace, and an oversized 1-car attached garage. Located in Holiday Pocono, close to the PA Turnpike and Route 80 for easy commuting. STRs are not permitted. Being sold as is. Motivated seller!
ⓘ Source: listings_history table (triggers on properties + properties_extension) + one-shot
backfill from property_details.listing_events for pre-trigger history.
Climate risk First Street
- Flood 1/10 Low FEMA zone X (unshaded) · 0% chance over 30 yrs
- Wildfire 2/10 Low
- Heat 2/10 Low 7 d/yr ≥89°F today · 16 d/yr by 30 yrs out
- Wind 4/10 Moderate 8% chance of damaging wind over 30 yrs
- Air quality 2/10 Low 1 unhealthy d/yr today · 2 by 30 yrs out
Nearby sold comps map
Loading sold comps map…
Walkable amenities ~0.75 mi
Loading nearby amenities…
Taxation est. · year 1
- Rental income
- $23,952
- − Mortgage interest
- −$12,603
- − Property taxes
- −$3,375
- − Insurance
- −$1,125
- − Repairs & maintenance
- −$1,916
- − Management
- −$1,916
- − Depreciation
- −$6,545
- Taxable loss
- −$3,529
- Est. tax savings @ 24.0%
- +$847
- After-tax cash flow
- $1,110/yr
For passive investors: Depreciation is non-cash, so a rental often shows a tax loss while cash-flowing — sheltering income. Rental losses are passive: they offset passive income freely, and up to $25,000/yr can offset ordinary (W-2) income if you actively participate and your MAGI is under $100k (phasing out to $0 by $150k); unused losses carry forward. On sale, claimed depreciation is recaptured at up to 25%, and gains may owe capital-gains tax (a 1031 exchange can defer both). Figures are a year-1 estimate at your 24.0% rate — not tax advice; consult a CPA.
Condition & rehab AI · 13 photos
The home requires moderate renovations, including painting, updating the kitchen, and landscaping, to significantly increase its resale and rental value.
Repairs flagged
- Major Exterior siding — Weathered and in need of repainting
- Major Kitchen — No photos, but based on similar homes, likely outdated
- Major Paint — Faded and needs fresh coats
Value-add opportunities
- Both Painting and updating the kitchen — Fresh paint and updated kitchen would attract more buyers and renters
- Both Landscaping and curb appeal — A well-maintained exterior would improve curb appeal and attract more potential buyers
Renovation cost estimate screening
| Repair item | Severity | Est. cost |
|---|---|---|
| Exterior siding · Weathered and in need of repainting | Major | $15,000–50,000 |
| Kitchen · No photos, but based on similar homes, likely outdated | Major | $15,000–50,000 |
| Paint · Faded and needs fresh coats | Major | $15,000–50,000 |
| Total estimated repair cost · 3 items | $45,000–150,000 |
Value-add ROI direction
- Both Painting and updating the kitchen — Fresh paint and updated kitchen would attract more buyers and renters ↑
- Both Landscaping and curb appeal — A well-maintained exterior would improve curb appeal and attract more potential buyers ↑
ⓘ Cost ranges are severity-bucket heuristics (US national rule-of-thumb). Get contractor quotes + a written scope before underwriting a rehab budget.
Schools (NCES district)
- District
- Jim Thorpe Area SD
- NCES district ID
- 4212540
- Math proficiency
- 25% ▼ -12.00%
- Reading proficiency
- 47% ▼ -11.00%
- Median HH income
- $53,476
- Composite
- 31.42/100
- National rank
- #5988
- State rank
- #394 of 539 in PA
Livability — Kidder
No livability data for this city. (Only ~50 U.S. cities are tracked.)
Census & demographics
- Census place
- Holiday Pocono, PA
- Population (ZIP)
- 7,879
Population outlook (Carbon County) Hauer SSP2
- Today (2025)
- 61,643 people
- By 2030
- 59,840 · -2.9%
- By 2040
- 55,413 · -10.1%
- By 2050
- 50,843 · -17.5%
- By 2075
- 43,326 · -29.7%
- By 2100
- 37,126 · -39.8%
Race, ethnicity, and origin ACS 2023
- Neighborhood character
- Predominantly White (69%)
- Race & ethnicity
- White 69% Hispanic / Latino 22% Two or more races 11% Black 6% Native American 1% Asian 1%
- Hispanic origin (detail)
- Puerto Rican 12% Cuban 2% Dominican 1%
- Common ancestry
- Romanian 8% Russian 4% Iranian 2%
- Foreign-born
- 12% · Canada
- Languages at home
- 81% English-only · Spanish 10% Russian/Polish/Slavic 7% Other Indo-European 1%
Political lean MEDSL · Carbon
- 2024 margin
- Solid R (+34.8) · D 32.2% · R 67.0%
- 2008→2024 swing
- -36.7pp toward R · 2008: 1.9pp · 2024: -34.8pp
- All cycles
- 2024: R+34.8 2020: R+32.0 2016: R+34.1 2012: R+6.9 2008: D+1.9
Not yet ingested
- Civics
- —
Market trends
- HPI YoY
- ▼ -2.89%
- Current HPI
- 203.8099
- Rent YoY
- —
- Metro
- —
- State GDP YoY
- ▲ 1.68%
- F500 in state
- 34
Industry mix (Fortune 500 HQ in PA)
| Industry | F500 HQs | Revenue |
|---|---|---|
| Healthcare | 2 | $309B |
|
||
| Insurance | 2 | $27B |
|
||
| Telecommunications / Media | 1 | $124B |
|
||
| Industrial Distribution | 1 | $22B |
|
||
| Financial Services | 1 | $20B |
|
||
| Chemicals / Materials | 1 | $18B |
|
||
Price history
+0.0% since first listed2 events — show timeline
- 2026-04-24 Listed $225,000 GLVRMLS
- 2026-04-24 Listed $225,000 PMAR
Cash-flow waterfall
monthlySold comps — $/sqft
last 12 mo · ≤1 miLoading sold comps…