 🏗️ New Construction
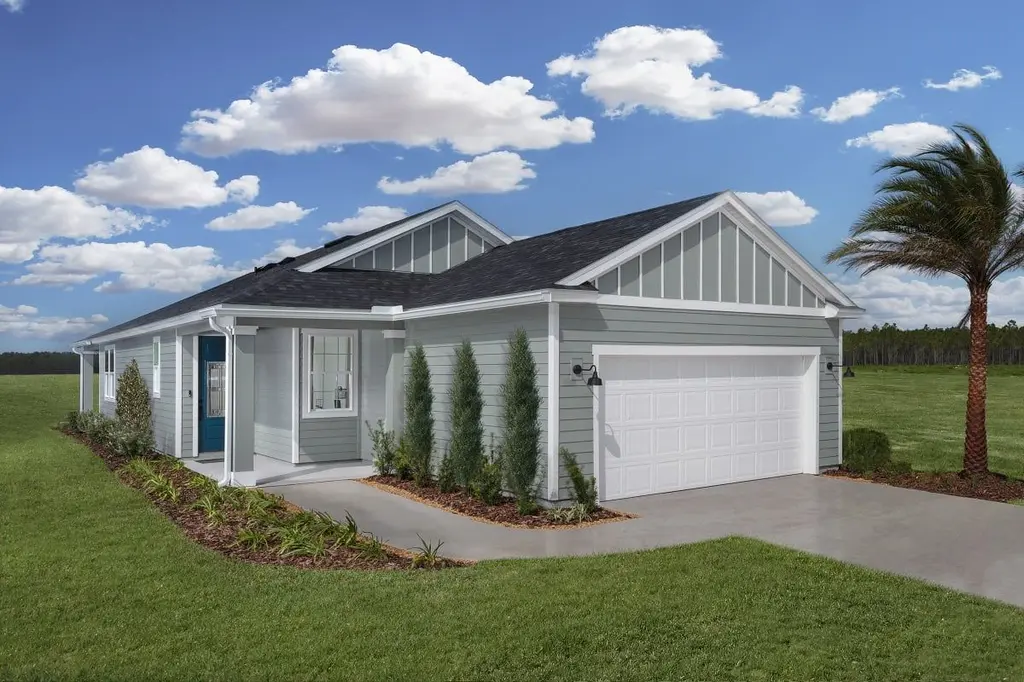
Plan 1638 Modeled Plan · Palm Coast, FL
Flood risk 5/10 · Moderate
- FEMA flood zone
- X (unshaded)
- Chance of flooding over 30 yrs
- 0.66%
- Est. flood insurance / yr
- $507 – $1,088
Fire risk 4/10 · Minor
- Est. fire insurance / yr
- $947 – $1,759
Heat risk 10/10 · Severe
- Hot days now (above 106°F)
- 7 days/yr
- Hot days in 30 yrs
- 21 days/yr
Wind risk 10/10 · Severe
- Chance of severe wind over 30 yrs
- 99.0%
Air-quality risk 2/10 · Minimal
- Unhealthy air days now
- 2 days/yr
- Unhealthy air days in 30 yrs
- 2 days/yr
Risk factors via First Street. Map © Google.
Why this score? — see what drove the F grade
The composite is a weighted blend of 9 inputs, each scored 0–100. Each bar is that input's sub-score; the figure is the points it added to the 100-point composite (weight × sub-score).
- ARV discount +7.5/15.0
- Cash flow +7.2/30.0
- Schools +4.6/10.0
- Livability +3.5/5.0
- Rent growth +2.7/5.0
- Condition / age +2.5/5.0
- 1% rule +2.0/10.0
- DSCR +1.3/10.0
- Appreciation +0.0/10.0
$263,990
🖨 Deal sheet (PDF) 📄 Offer letter ✓ Due diligence
Key facts
- 2 garage spots
- Listed 955 days
Property features AI
Finance
- Other: Located at 61 Camellia St, Palm Coast, FL 32137; Listing status: Active
- Financial info: List price $260,990
Exterior
- Home design: Single-family new construction (Plan 1638 Modeled)
- Exterior features: Living area of 1,638 square feet
Interior
- Bedrooms: 4 bedrooms
- Bathrooms: 2 full bathrooms
- Interior features: Active new-construction plan (Plan 1638 Modeled)
Neighborhood map
What this means for you Summary
Snapshot
- This is a 4-bed/2.0-bath single-family listed at $264k.
Deal economics
- At list price, monthly cash flow is $-447 ($-5k/yr) — negative.
- To cash-flow at today's rent, offer at most $256k (2.9% below list).
- To meet the 1% rule (rent ≥ 1% of price), the offer needs to be $224k (15.1% below list).
- Recommended offer: $224k (15.1% below list) — sets the bar for 1% rule.
- Cap rate 4.6% vs local median 3.8% in Palm Coast — meaningfully above typical; check what's discounted (condition, days-on-market, listing class) to confirm the premium yield is real.
Location & tenants
- Location reads 69/100 on livability (#478 in FL) — a middle-class / working-renter tenant base. Strengths: housing A+, health & safety A+, cost of living B+; Watch: amenities F, commute F.
- Flagler (rural): math 53% / reading 56% proficiency, ranked #20 of 73 in FL (top 27%) — acceptable for families but not a draw, mixed tenant base, ~2y average lease.
- Market conditions: Rents flat; 1616 active listings in the ZIP; 30 comparable units currently listed for rent nearby; rentals at typical pace (median 21d on market — plan ~3-4 weeks tenant-placement turnaround); solid renter incomes; 2,588 units permitted in Flagler County in 2024 (0 in 5+ unit buildings).
- This rent runs 32% of the median local income ($84k/yr) — at the standard rent-burdened threshold; future hikes will face affordability resistance.
Forward outlook
- Local home prices are declining (-3.0%/yr); year-one equity from $2k of loan paydown is wiped out by about $10k of value loss. Plan a longer hold.
- Flagler County population projected at +28% by 2050 — long-run rental-demand tailwind backs the buy-and-hold thesis.
Negotiation context
- It's been on market 956 days — a 12% lower offer ($232k) is reasonable based on typical stale-listing flexibility.
Risks & watch-outs
- Climate carrying-cost: moderate flood risk; severe wind risk, 99% chance of damaging wind over 30y; extreme-heat days projected 7→21/yr by 2055 (HVAC capex compounding) — expect insurance premiums to compound above CPI over the hold.
Questions for the listing agent
- What do current leases actually rent for vs. the listed asking? Can we see a recent rent roll and the last 12 months of T-12 income?
- It's been on market 956 days. Have you received any prior offers? Is the seller open to a 15% concession, seller financing, or rate buy-down credit?
- Why hasn't it sold? Are there any deal-killer items the seller is aware of (foundation, flood, title, zoning, code violations)?
- Is there a deadline driving the sale (1031 exchange, divorce, estate, relocation)? That informs how much negotiation room exists.
- The area grade is low — what's the realistic commute time and amenity access for the typical tenant pool here? Any planned neighborhood developments (good or bad) we should know about?
- What's the average days-on-market for RENTAL listings here right now (not sales)? A rising rental-DOM trend means longer vacancies and softer asking-rent achievability than the comps imply.
- What's the recent tenant-quality profile in this submarket — average credit score on applications, eviction rate, late-payment / NSF rate, and stable-employment percentage? A property-management company in the area should have these aggregated.
- How much new for-sale + rental construction is in the pipeline within 1–3 miles? Heavy new supply typically softens prices + rents 12–24 months out; constrained supply supports both.
Investment metrics
- 1% rule
- 0.70% ✗
- Cap rate
- 4.62%
- Cash-on-cash
- -5.97%
- DSCR
- 0.73
- GRM
- 11.9
CMA / ARV
- ARV (on-the-fly)
- $321,048
- Comps found
- 12
Show comp detail 12 sales within ~0.75 mi
| Address | Dist | Beds/Ba | Sqft | Sold | Price | $/sf | Match |
|---|---|---|---|---|---|---|---|
| 48 Bradmore Ln | 0.39mi | 4/2.0 | 1,574 (-4%) | 3mo | $315,000 | $200 | 73 |
| 48 Ballard Ln | 0.55mi | 4/2.0 | 1,654 (+1%) | 3mo | $325,000 | $196 | 70 |
| 10 Barring | 0.48mi | 3/2.0 (-1) | 1,663 (+2%) | 3mo | $305,000 | $183 | 67 |
| 29 Beckner Ln | 0.55mi | 3/2.0 (-1) | 1,668 (+2%) | 1mo | $282,000 | $169 | 66 |
| 7 Beechwood Ln | 0.42mi | 3/2.0 (-1) | 1,768 (+8%) | 3mo | $336,000 | $190 | 59 |
| 123 Boulder Rock Dr | 0.70mi | 3/2.0 (-1) | 1,668 (+2%) | 0mo | $366,000 | $219 | 59 |
| 171 Bayside Dr | 0.46mi | 3/2.0 (-1) | 1,497 (-9%) | 0mo | $180,000 | $120 | 59 |
| 102 Beauford Ln | 0.56mi | 3/2.0 (-1) | 1,500 (-8%) | 1mo | $361,500 | $241 | 54 |
| 23 Brownstone Ln | 0.62mi | 4/2.0 | 1,820 (+11%) | 0mo | $336,900 | $185 | 52 |
| 57 Botany Ln | 0.74mi | 3/2.0 (-1) | 1,535 (-6%) | 1mo | $245,000 | $160 | 49 |
| 70 Bennett Ln | 0.56mi | 3/3.0 (-1) | 1,810 (+10%) | 1mo | $450,000 | $249 | 47 |
| 32 Barkley Ln | 0.73mi | 3/2.0 (-1) | 1,471 (-10%) | 2mo | $338,000 | $230 | 42 |
Match score weights: distance 35% · size 25% · config 20% · recency 20%. Top-matched comps best support the ARV.
Projected returns pro-forma
-3.0% appreciation · 0.85% rent growth · sell at horizon
- IRR
- -28.9%
- Equity multiple
- 0.05×
- Total profit
- $-85,220
- Equity at exit
- $47,869
- IRR
- -40.3%
- Equity multiple
- -0.44×
- Total profit
- $-129,410
- Equity at exit
- $27,758
Cash invested: $89,893 (down + closing). Projections, not guarantees.
Landlord ↔ Tenant lean methodology
- Overall (STATE)
- 87 Strongly Landlord-Friendly
- State Florida
- 87 Strongly Landlord-Friendly · R+3
- County
- — inherits STATE
- City
- — inherits STATE
ZIP-level market 32137
- Home prices YoY
- -34.5%
- Rents YoY
- 0.8%
- Active inventory
- 1616
- Price-to-rent
- 9.8×
Monthly cashflow live
- Estimated rent
- $2,242 high interval (Pro) →
- Mortgage (P&I)
- −$1,684
- Tax est. 1.5%
- −$401 /mo · $4,816/yr
- Insurance
- −$134
- HOA
- −$0
- Vacancy / Maint / Mgmt
- −$471
- Net cashflow
- $-447
Break-even live
Sensitivity live
| Price | -10% $-225 | -5% $-336 | +0% $-447 | +5% $-558 | +10% $-669 |
|---|---|---|---|---|---|
| Rent | -10% $-624 | -5% $-536 | +0% $-447 | +5% $-359 | +10% $-270 |
| Rate | -1.0pp $-285 | -0.5pp $-366 | base $-447 | +0.5pp $-530 | +1.0pp $-615 |
UW: 25.0% down · 7.5% · 30yr · 1.5% tax · 5.0% vac · 8.0% maint · 8.0% mgmt
Financing live
Cash to close
- Down payment
- $80,262
- Closing costs
- $9,631
- Reserves months
- —
- Total cash needed
- —
Loan-product check · same deal, 3 products live
Conventional
25% down · 7.5% · 30yr
- Down + closing
- —
- Monthly P&I
- —
- Monthly cashflow
- —
- DSCR
- —
- Eligible?
- —
Personal DTI + credit; lowest rate.
DSCR
20% down · 8.5% · 30yr
- Down + closing
- —
- Monthly P&I
- —
- Monthly cashflow
- —
- DSCR
- —
- Eligible?
- —
No personal income docs; deal must DSCR.
Hard money
10% down · 12.0% · 12mo
- Down + closing
- —
- Monthly P&I
- —
- Monthly cashflow
- —
- DSCR
- —
- Eligible?
- —
Short-term bridge; refi at stabilization.
Rent comps 30 comps
| Address | Beds | Baths | Sqft | Rent | $/sqft | DOM | Units | Dist |
|---|---|---|---|---|---|---|---|---|
| 273 Beachway Dr Palm Coast, FL | 3.0 | 2.0 | 1784 | $2,450 | $1.37 | 24d | 1 | 0.23mi |
| 26 Brooklyn Ln Palm Coast, FL | 4.0 | 2.0 | 1862 | $2,250 | $1.21 | 20d | 1 | 0.46mi |
| 24 Barring Pl Palm Coast, FL | 3.0 | 2.0 | 1668 | $1,875 | $1.12 | 24d | 1 | 0.48mi |
| 44 Barrington Dr Palm Coast, FL | 4.0 | 2.0 | 1862 | $2,250 | $1.21 | 15d | 1 | 0.52mi |
| 53 Brownstone Ln Palm Coast, FL | 4.0 | 2.0 | 1582 | $1,950 | $1.23 | 4d | 1 | 0.55mi |
| 20 Bressler Ln Palm Coast, FL | 4.0 | 3.0 | 2141 | $2,060 | $0.96 | 24d | 1 | 0.62mi |
| 69 Beckner Ln Unit NA Palm Coast, FL | 3.0 | 2.0 | 1412 | $1,998 | $1.42 | 4d | 1 | 0.64mi |
| 63 Beaverdam Ln Palm Coast, FL | 3.0 | 2.0 | 1591 | $1,895 | $1.19 | 4d | 1 | 0.65mi |
| 102 Brittany Ln Palm Coast, FL | 4.0 | 2.0 | 1902 | $2,450 | $1.29 | 24d | 1 | 0.66mi |
| 121 Pine Lakes Pkwy N Palm Coast, FL | 1.0–3.0 | 1.0–2.0 | 1090 | $1,966 | $1.80 | 4d | 10 | 0.67mi |
| 73 Bruce Ln Palm Coast, FL | 3.0 | 3.0 | 2245 | $2,189 | $0.98 | 4d | 1 | 0.67mi |
| 78 Belvedere Ln Palm Coast, FL | 3.0 | 2.0 | 1557 | $1,750 | $1.12 | 15d | 1 | 0.77mi |
| 55 Brittany Ln Palm Coast, FL | 3.0 | 2.0 | 1281 | $1,850 | $1.44 | 20d | 1 | 0.82mi |
| 113 Brunswick Ln Unit A Palm Coast, FL | 3.0 | 2.0 | 1198 | $1,550 | $1.29 | 4d | 1 | 0.88mi |
| 134 Beechwood Ln Palm Coast, FL | 3.0 | 2.0 | 1368 | $1,870 | $1.37 | 22d | 1 | 0.92mi |
| 1 Fanshawe Ln Unit 1B Palm Coast, FL | 3.0 | 2.5 | 2085 | $2,350 | $1.13 | 24d | 1 | 1.06mi |
| 1 Fanshawe Ln Palm Coast, FL | 3.0 | 2.5 | 2085 | $2,350 | $1.13 | 15d | 1 | 1.06mi |
| 116 Wellwood Ln Unit B Palm Coast, FL | 3.0 | 2.0 | 1217 | $1,475 | $1.21 | 24d | 1 | 1.15mi |
| 75A Wellwood Ln Palm Coast, FL | 3.0 | 2.0 | 1093 | $1,500 | $1.37 | 24d | 1 | 1.16mi |
| 59 Wellhaven Ln Unit B Palm Coast, FL | 3.0 | 2.0 | 1198 | $1,900 | $1.59 | 15d | 1 | 1.16mi |
| 75 Wellwood Ln Unit A Palm Coast, FL | 3.0 | 2.0 | 1093 | $1,500 | $1.37 | 24d | 1 | 1.16mi |
| 45 Wellham Ln Unit B Palm Coast, FL | 3.0 | 2.0 | 1505 | $1,850 | $1.23 | 4d | 1 | 1.17mi |
| 129 Wellwood Ln Unit B Palm Coast, FL | 3.0 | 2.0 | 1287 | $1,650 | $1.28 | 24d | 1 | 1.18mi |
| 35 Wellham Ln Palm Coast, FL | 3.0 | 2.0 | 1298 | $1,750 | $1.35 | 24d | 1 | 1.21mi |
| 12 Bunker View Pl Palm Coast, FL | 3.0 | 2.5 | 1600 | $1,725 | $1.08 | 4d | 1 | 1.22mi |
| 11 Birchtree Way Palm Coast, FL | 3.0 | 2.0 | 1360 | $1,800 | $1.32 | 4d | 1 | 1.34mi |
| 59 Wellstream Ln Palm Coast, FL | 3.0 | 2.0 | 1367 | $1,795 | $1.31 | 24d | 1 | 1.35mi |
| 57 Wellstream Ln Palm Coast, FL | 3.0 | 2.0 | 2040 | $1,900 | $0.93 | 24d | 1 | 1.35mi |
| 14 Bunker View Dr Unit 2 Palm Coast, FL | 3.0 | 2.0 | 1190 | $1,645 | $1.38 | 4d | 1 | 1.41mi |
| 42 Farmsworth Dr Unit A Palm Coast, FL | 3.0 | 2.0 | 1338 | $1,995 | $1.49 | 4d | 1 | 1.48mi |
Listing history 16 events
-
2026-06-21days on market $263,990 Active 956 DOM
-
2026-06-18days on market $263,990 Active 953 DOM
-
2026-06-17days on market $263,990 Active 952 DOM
-
2026-06-16days on market $263,990 Active 951 DOM
-
2026-06-15days on market $263,990 Active 950 DOM
-
2026-06-14days on market $263,990 Active 948 DOM
-
2026-06-13days on market $263,990 Active 947 DOM
-
2026-06-10days on market $263,990 Active 945 DOM
-
2026-06-09days on market $263,990 Active 944 DOM
-
2026-06-08days on market $263,990 Active 943 DOM
-
2026-06-07days on market $263,990 Active 942 DOM
-
2026-06-03days on market $263,990 Active 938 DOM
-
2026-06-02days on market $263,990 Active 937 DOM
-
2026-06-01days on market $263,990 Active 936 DOM
-
2026-06-01price $263,990 Active 935 DOM
-
2026-05-31days on market $260,990 Active 935 DOM
ⓘ Source: listings_history table (triggers on properties + properties_extension) + one-shot
backfill from property_details.listing_events for pre-trigger history.
Climate risk First Street
- Flood 5/10 Major FEMA zone X (unshaded) · 66% chance over 30 yrs
- Wildfire 4/10 Moderate
- Heat 10/10 Extreme 7 d/yr ≥106°F today · 21 d/yr by 30 yrs out
- Wind 10/10 Extreme 99% chance of damaging wind over 30 yrs
- Air quality 2/10 Low 2 unhealthy d/yr today · 2 by 30 yrs out
Nearby sold comps map
Loading sold comps map…
Walkable amenities ~0.75 mi
Loading nearby amenities…
Taxation est. · year 1
- Rental income
- $26,909
- − Mortgage interest
- −$17,984
- − Property taxes
- −$4,816
- − Insurance
- −$1,605
- − Repairs & maintenance
- −$2,153
- − Management
- −$2,153
- − Depreciation
- −$9,340
- Taxable loss
- −$11,141
- Est. tax savings @ 24.0%
- +$2,674
- After-tax cash flow
- $-2,692/yr
For passive investors: Depreciation is non-cash, so a rental often shows a tax loss while cash-flowing — sheltering income. Rental losses are passive: they offset passive income freely, and up to $25,000/yr can offset ordinary (W-2) income if you actively participate and your MAGI is under $100k (phasing out to $0 by $150k); unused losses carry forward. On sale, claimed depreciation is recaptured at up to 25%, and gains may owe capital-gains tax (a 1031 exchange can defer both). Figures are a year-1 estimate at your 24.0% rate — not tax advice; consult a CPA.
Schools (NCES district)
- District
- Flagler
- NCES district ID
- 1200540
- Math proficiency
- 53% ▼ -9.00%
- Reading proficiency
- 56% ▼ -4.00%
- Median HH income
- $48,354
- Composite
- 46.35/100
- National rank
- #2464
- State rank
- #20 of 73 in FL
Livability — Palm Coast
- Score
- 69/100
- State rank
- #478
- US rank
- #8721
Category grades
Schools grade is shown separately in the Schools card above.
Census & demographics
- Census place
- Palm Coast, FL
- County
- Flagler County · 113,412 people
- City population
- 105,049
- Metro
- Deltona-Daytona Beach-Ormond Beach, FL
- Population (ZIP)
- 48,391
- Household income
- $83,923
- Rent vs Own
- Severe rent burden
- 816.0
Population outlook (Flagler County) Hauer SSP2
- Today (2025)
- 123,474 people
- By 2030
- 131,864 · +6.8%
- By 2040
- 146,176 · +18.4%
- By 2050
- 157,398 · +27.5%
- By 2075
- 177,990 · +44.2%
- By 2100
- 183,381 · +48.5%
Race, ethnicity, and origin ACS 2023
- Neighborhood character
- Predominantly White (77%)
- Race & ethnicity
- White 77% Hispanic / Latino 10% Two or more races 8% Black 6% Asian 3%
- Hispanic origin (detail)
- Puerto Rican 4% Cuban 1%
- Common ancestry
- Romanian 4% Russian 2% Lithuanian 2%
- Foreign-born
- 13% · Canada, Jamaica
- Languages at home
- 85% English-only · Spanish 7% Other Indo-European 3% Russian/Polish/Slavic 2%
Political lean MEDSL · Flagler
- 2024 margin
- Strong R (+28.2) · D 35.6% · R 63.8%
- 2008→2024 swing
- -29.8pp toward R · 2008: 1.6pp · 2024: -28.2pp
- All cycles
- 2024: R+28.2 2020: R+20.8 2016: R+20.6 2012: R+7.4 2008: D+1.6
Not yet ingested
- Civics
- —
Market trends
- HPI YoY
- ▼ -153.27%
- Current HPI
- 290.4607
- Rent YoY
- ▲ 0.85%
- Metro
- Deltona-Daytona Beach-Ormond Beach, FL
- State GDP YoY
- ▲ 3.28%
- F500 in state
- 36
Industry mix (Fortune 500 HQ in FL)
| Industry | F500 HQs | Revenue |
|---|---|---|
| Industrial Technology | 2 | $29B |
|
||
| Insurance | 2 | $17B |
|
||
| Retail | 1 | $60B |
|
||
| Technology Distribution | 1 | $58B |
|
||
| Homebuilding | 1 | $35B |
|
||
| Technology Manufacturing | 1 | $35B |
|
||
Cash-flow waterfall
monthlySold comps — $/sqft
last 12 mo · ≤1 miLoading sold comps…