 Duplex
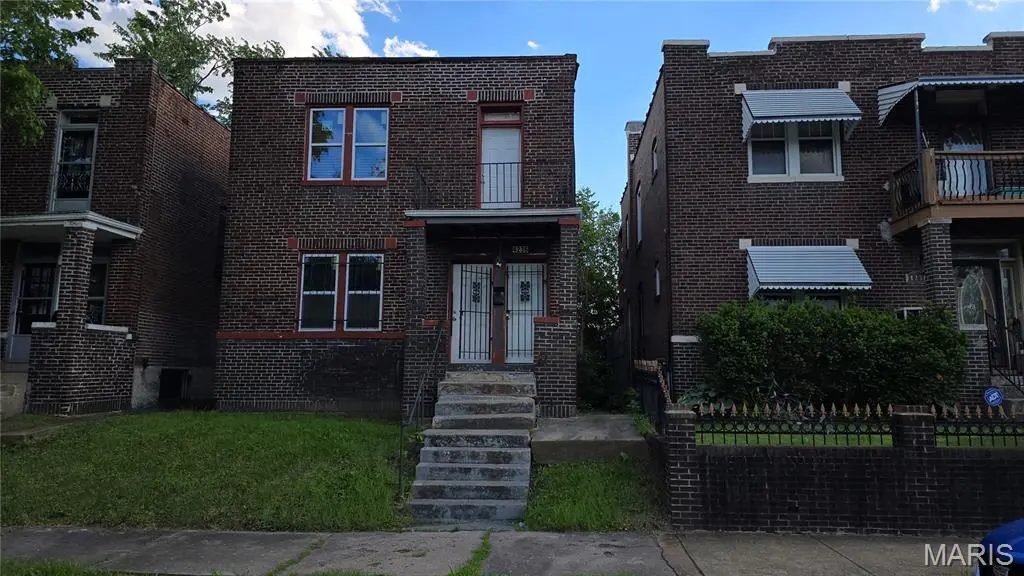
4236 W Aldine Ave · St. Louis, MO
Flood risk 1/10 · Minimal
- FEMA flood zone
- X (unshaded)
- Chance of flooding over 30 yrs
- 0.0%
- Est. flood insurance / yr
- $473 – $860
Fire risk 1/10 · Minimal
- Est. fire insurance / yr
- $1,054 – $1,958
Heat risk 5/10 · Moderate
- Hot days now (above 107°F)
- 7 days/yr
- Hot days in 30 yrs
- 21 days/yr
Wind risk 2/10 · Minimal
- Chance of severe wind over 30 yrs
- 1.0%
Air-quality risk 4/10 · Minor
- Unhealthy air days now
- 5 days/yr
- Unhealthy air days in 30 yrs
- 6 days/yr
Risk factors via First Street. Map © Google.
Why this score? — see what drove the B grade
The composite is a weighted blend of 9 inputs, each scored 0–100. Each bar is that input's sub-score; the figure is the points it added to the 100-point composite (weight × sub-score).
- Cash flow +30.0/30.0
- 1% rule +10.0/10.0
- DSCR +10.0/10.0
- ARV discount +7.5/15.0
- Appreciation +3.9/10.0
- Rent growth +2.5/5.0
- Livability +2.5/5.0
- Condition / age +2.5/5.0
- Schools +1.2/10.0
$100,000
🖨 Deal sheet (PDF) 📄 Offer letter ✓ Due diligence
Multi-family units
County records classify this as Multi-Family (2-4 Unit). Listing-text estimate: 2 units. confirmed
Listing remarks
Welcome to 4236 W Aldine Ave! Great opportunity in the heart of the city! This duplex feature two spacious units, each offering a comfortable living room, kitchen, full bathroom, and 2 bedrooms. Perfect for an owner-occupant looking to live in one unit while generating rental income from the other, or for an investor seeking to add a solid income-producing property to their portfolio. Conveniently located near public transportation, major highways, shopping, and everyday amenities, making it attractive for both homeowners and tenants alike. A smart investment with excellent potential!
Key facts
- 3,685 sq ft lot
- Built 1926
- Listed 40 days
Property features AI
Finance
- Other: Property type: Residential income; Property subtype: 2–4 units; Unit mix: two 2-bedroom units (total unit count: 1 unit type listed with 2 units)
Exterior
- Parking: No driveway; No garage; On-street parking
- Utilities: Public water; Electricity connected; Sewer connected; Water connected
- Home design: Residential income property (2–4 units); Above-grade finished area reported as 3,683 (public records); Living area reported as 1,924 (public records)
- Construction: Brick veneer exterior
- Exterior features: Brick veneer construction; Frontage approximately 128 x 29; Lot about 0.0846 acre; Private ownership
Interior
- Bedrooms: Two 2-bedroom units (unit count: 2)
- Bathrooms: Each unit has 1 bathroom
- Heating & cooling: Electric forced-air heating; Ceiling fan(s); Window cooling units
- Interior features: Basement present (other type)
Neighborhood map
What this means for you Summary
Snapshot
- This is a 2 × 2-bed/1.0-bath units multifamily listed at $100k.
Deal economics
- At list price, monthly cash flow is $2k ($20k/yr) — positive. Per door: $826/mo.
- The deal already cash-flows at list — no discount required.
- Meets the 1% rule at list price ($3k rent vs $100k).
- Recommended offer: $97k (3.0% below list) — sets the bar for market timing.
- Cap rate 26.1% vs local median 5.0% in St. Louis — top-decile yield for the area; either an underpriced asset or a hidden risk that comps aren't pricing in. Stress-test before assuming the spread holds.
Location & tenants
- Location reads: area grade B — affects rentability + tenant quality, not the cash-flow math above.
- St. Louis City (urban): math 10% / reading 18% proficiency, ranked #312 of 324 in MO (top 96%) — low school quality limits family demand, transient renter base, plan for 1-2y turnover; 80% free/reduced lunch — lower-income household profile, screen leases tightly.
- Zoned schools: Nahed Chapman New American Aca (math 2% / reading 2%, grade F, #1,099 of 1,115 statewide, top 100%, 335 students, 99% FRL); Gateway Middle (math 0% / reading 8%, grade F, #389 of 391 statewide, top 100%, 506 students, 99% FRL); Sumner High (math 2% / reading 2%, grade F, #520 of 521 statewide, top 100%, 264 students, 99% FRL) — zoned schools average 99% FRL vs 80% district-wide (19 pts higher); higher-poverty schools than district average — tighter screening recommended.
- Market conditions: 58 active listings in the ZIP; 17 comparable units currently listed for rent nearby; rentals leasing fast (median 12d on market — plan ~1-2 weeks tenant-placement turnaround); 294 units permitted in St. Louis city in 2024 (227 in 5+ unit buildings).
Forward outlook
- Local home prices are declining (-2.1%/yr); year-one equity from $691 of loan paydown is wiped out by about $2k of value loss. Plan a longer hold.
- St. Louis County population projected to shrink 6% by 2050 — rents likely to lag national; underwrite the cash flow, not the appreciation.
- At projected returns (-2.1% appreciation + 3.0% rent growth), your $28k cash investment doubles in ~2 years — after that, you're playing with house money.
Negotiation context
- It's been on market 41 days — a 3% lower offer ($97k) is reasonable based on typical stale-listing flexibility.
- Current owner paid $18k; list at $100k implies a 456% gain — meaningful room to come down on a strong offer.
Risks & watch-outs
- Watch-outs: built in 1926 — expect roof / HVAC / electrical / plumbing capex.
- Climate carrying-cost: extreme-heat days projected 7→21/yr by 2055 (HVAC capex compounding) — expect insurance premiums to compound above CPI over the hold.
Questions for the listing agent
- It's been on market 41 days. Have you received any prior offers? Is the seller open to a 3% concession, seller financing, or rate buy-down credit?
- Can we see the unit-by-unit rent roll, current vacancy, and any below-market leases? What's the average tenancy length?
- What capital expenditures (roof, boiler, parking lot, exteriors) have been made in the last 5 years, and what's planned in the next 2?
- Built in 1926 — when were the roof, HVAC, electrical panel, plumbing, and water heater last replaced?
- Is there a deadline driving the sale (1031 exchange, divorce, estate, relocation)? That informs how much negotiation room exists.
- What's the average days-on-market for RENTAL listings here right now (not sales)? A rising rental-DOM trend means longer vacancies and softer asking-rent achievability than the comps imply.
- What's the recent tenant-quality profile in this submarket — average credit score on applications, eviction rate, late-payment / NSF rate, and stable-employment percentage? A property-management company in the area should have these aggregated.
- How much new apartment / multifamily construction is in the pipeline within 1–3 miles? Heavy new supply (>2% of stock underway) typically softens rents 12–24 months out; light construction supports rent growth.
Investment metrics
- 1% rule
- 2.96% ✓
- Cap rate
- 26.11%
- Cash-on-cash
- 70.77%
- DSCR
- 4.15
- GRM
- 2.8
CMA / ARV
- ARV (median comp)
- $56,944
- List price
- $100,000
- Delta
- 75.61%
- Verdict
- OVERPRICED
- Comps
- 17 within 1.0 mi
Projected returns pro-forma
-2.14% appreciation · 3.0% rent growth · sell at horizon
- IRR
- 71.1%
- Equity multiple
- 4.31×
- Total profit
- $92,634
- Equity at exit
- $18,765
- IRR
- 74.4%
- Equity multiple
- 8.84×
- Total profit
- $219,477
- Equity at exit
- $15,414
Cash invested: $28,000 (down + closing). Projections, not guarantees.
Landlord ↔ Tenant lean methodology
- Overall (STATE)
- 81 Strongly Landlord-Friendly
- State Missouri
- 81 Strongly Landlord-Friendly · R+10
- County
- — inherits STATE
- City
- — inherits STATE
ZIP-level market 63113
- Home prices YoY
- -2.0%
- Active inventory
- 58
- Price-to-rent
- 5.6×
Monthly cashflow live
- Estimated rent
- $2,965 high interval (Pro) →
- Mortgage (P&I)
- −$524
- Tax est. 1.5%
- −$125 /mo · $1,500/yr
- Insurance
- −$42
- HOA
- −$0
- Vacancy / Maint / Mgmt
- −$623
- Net cashflow
- $1,651
Break-even live
Sensitivity live
| Price | -10% $1,720 | -5% $1,686 | +0% $1,651 | +5% $1,617 | +10% $1,582 |
|---|---|---|---|---|---|
| Rent | -10% $1,417 | -5% $1,534 | +0% $1,651 | +5% $1,768 | +10% $1,886 |
| Rate | -1.0pp $1,702 | -0.5pp $1,677 | base $1,651 | +0.5pp $1,625 | +1.0pp $1,599 |
2-unit breakdown (identical units grouped — click to expand)
| Units | Beds | Baths | Est. rent |
|---|---|---|---|
| 2× units | 2 | 1 | $2,966 |
| #1 | 2 | 1 | $1,483 |
| #2 | 2 | 1 | $1,483 |
| Total (2 units) | $2,965 | ||
UW: 25.0% down · 7.5% · 30yr · 1.5% tax · 5.0% vac · 8.0% maint · 8.0% mgmt
Financing live
Cash to close
- Down payment
- $25,000
- Closing costs
- $3,000
- Reserves months
- —
- Total cash needed
- —
Loan-product check · same deal, 3 products live
Conventional
25% down · 7.5% · 30yr
- Down + closing
- —
- Monthly P&I
- —
- Monthly cashflow
- —
- DSCR
- —
- Eligible?
- —
Personal DTI + credit; lowest rate.
DSCR
20% down · 8.5% · 30yr
- Down + closing
- —
- Monthly P&I
- —
- Monthly cashflow
- —
- DSCR
- —
- Eligible?
- —
No personal income docs; deal must DSCR.
Hard money
10% down · 12.0% · 12mo
- Down + closing
- —
- Monthly P&I
- —
- Monthly cashflow
- —
- DSCR
- —
- Eligible?
- —
Short-term bridge; refi at stabilization.
Rent comps 17 comps
| Address | Beds | Baths | Sqft | Rent | $/sqft | DOM | Units | Dist |
|---|---|---|---|---|---|---|---|---|
| 4247 Maffitt Ave St. Louis, MO | 3.0 | 1.5 | 1700 | $1,000 | $0.59 | 6d | 1 | 0.46mi |
| 4400 Delmar Blvd St. Louis, MO | 3.0 | 1.0 | 1450 | $1,600 | $1.10 | 45d | 1 | 0.73mi |
| 404 N Sarah St Saint Louis, MO | 3.0 | 2.5 | 1772 | $2,600 | $1.47 | 45d | 1 | 1.01mi |
| 4390 McPherson Ave Saint Louis, MO | 3.0 | 2.5 | 1500 | $1,800 | $1.20 | 0d | 1 | 1.01mi |
| 4256 Maryland Ave Saint Louis, MO | 3.0 | 2.0 | 1400 | $1,800 | $1.29 | 12d | 1 | 1.10mi |
| 4256 Maryland Ave Saint Louis, MO | 3.0 | 2.0 | 1400 | $1,900 | $1.36 | 45d | 1 | 1.10mi |
| 3906 Lindell Blvd St. Louis, MO | 2.0–3.0 | 1.0 | 1072 | $1,650 | $1.54 | 0d | 15 | 1.19mi |
| 3906 Lindell Blvd St. Louis, MO | 2.0–3.0 | 1.0 | 1072 | $1,725 | $1.61 | 45d | 10 | 1.19mi |
| 3717-3721 Westminster Pl St. Louis, MO | 3.0 | 1.0–3.0 | 1343 | $2,735 | $2.04 | 17d | 4 | 1.19mi |
| 401 N Euclid Ave St. Louis, MO | 3.0 | 1.0 | 1025 | $1,875 | $1.83 | 0d | 4 | 1.20mi |
| 4065 W Pine Blvd Saint Louis, MO | 1.0–3.0 | 1.0–2.0 | 1075 | $2,550 | $2.37 | 45d | 8 | 1.21mi |
| 3701 Lindell Blvd Saint Louis, MO | 3.0 | 1.0–3.0 | 1073 | $2,500 | $2.33 | 17d | 81 | 1.24mi |
| 3701 Lindell Blvd Saint Louis, MO | 3.0 | 1.0–3.0 | 1073 | $2,500 | $2.33 | 0d | 128 | 1.24mi |
| 4400 Lindell Blvd Saint Louis, MO | 3.0 | 1.0–3.0 | 1100 | $2,879 | $2.62 | 0d | 16 | 1.25mi |
| 3681 Lindell Blvd Saint Louis, MO | 3.0 | 1.0–2.5 | 1292 | $3,579 | $2.77 | 0d | 60 | 1.26mi |
| 5096 Minerva Ave Unit C St. Louis, MO | 3.0 | 1.0 | 1800 | $1,395 | $0.78 | 45d | 1 | 1.39mi |
| 4567 W Pine Blvd Saint Louis, MO | 2.0–3.0 | 2.0 | 1326 | $4,350 | $3.28 | 0d | 6 | 1.45mi |
Listing history 19 events
-
2026-06-21days on market $100,000 Active 41 DOM
-
2026-06-18days on market $100,000 Active 38 DOM
-
2026-06-17days on market $100,000 Active 37 DOM
-
2026-06-16days on market $100,000 Active 36 DOM
-
2026-06-15days on market $100,000 Active 35 DOM
-
2026-06-13days on market $100,000 Active 33 DOM
-
2026-06-09days on market $100,000 Active 29 DOM
-
2026-06-08days on market $100,000 Active 28 DOM
-
2026-06-07days on market $100,000 Active 27 DOM
-
2026-06-05days on market $100,000 Active 24 DOM
-
2026-06-03days on market $100,000 Active 23 DOM
-
2026-06-02days on market $100,000 Active 22 DOM
-
2026-06-01days on market $100,000 Active 21 DOM
-
2026-05-31days on market $100,000 Active 20 DOM
-
2026-05-12$100,000 Active 592-char remark
-
2026-05-12historical $100,000 592-char remark
-
2008-09-29soldstatus $18,000
-
1995-04-19soldstatus
-
1995-03-08soldstatus
ⓘ Source: listings_history table (triggers on properties + properties_extension) + one-shot
backfill from property_details.listing_events for pre-trigger history.
Climate risk First Street
- Flood 1/10 Low FEMA zone X (unshaded) · 0% chance over 30 yrs
- Wildfire 1/10 Low
- Heat 5/10 Major 7 d/yr ≥107°F today · 21 d/yr by 30 yrs out
- Wind 2/10 Low 100% chance of damaging wind over 30 yrs
- Air quality 4/10 Moderate 5 unhealthy d/yr today · 6 by 30 yrs out
Nearby sold comps map
Loading sold comps map…
Walkable amenities ~0.75 mi
Loading nearby amenities…
Taxation est. · year 1
- Rental income
- $35,580
- − Mortgage interest
- −$5,602
- − Property taxes
- −$1,500
- − Insurance
- −$500
- − Repairs & maintenance
- −$2,846
- − Management
- −$2,846
- − Depreciation
- −$2,909
- Taxable income
- $19,377
- Est. tax owed @ 24.0%
- −$4,650
- After-tax cash flow
- $15,165/yr
For passive investors: Depreciation is non-cash, so a rental often shows a tax loss while cash-flowing — sheltering income. Rental losses are passive: they offset passive income freely, and up to $25,000/yr can offset ordinary (W-2) income if you actively participate and your MAGI is under $100k (phasing out to $0 by $150k); unused losses carry forward. On sale, claimed depreciation is recaptured at up to 25%, and gains may owe capital-gains tax (a 1031 exchange can defer both). Figures are a year-1 estimate at your 24.0% rate — not tax advice; consult a CPA.
Schools (NCES district)
- District
- St. Louis City
- NCES district ID
- 2929280
- Math proficiency
- 10% ▼ -6.00%
- Reading proficiency
- 18% ▼ -3.00%
- Median HH income
- $35,685
- Composite
- 11.54/100
- National rank
- #9699
- State rank
- #312 of 324 in MO
Livability — St. Louis
No livability data for this city. (Only ~50 U.S. cities are tracked.)
Census & demographics
- Census place
- St. Louis, MO
- City population
- 283,259
- Population (ZIP)
- 11,610
Population outlook (St. Louis County) Hauer SSP2
- Today (2025)
- 315,737 people
- By 2030
- 313,865 · -0.6%
- By 2040
- 305,439 · -3.3%
- By 2050
- 296,529 · -6.1%
- By 2075
- 271,028 · -14.2%
- By 2100
- 255,359 · -19.1%
Race, ethnicity, and origin ACS 2023
- Neighborhood character
- Predominantly Black (91%)
- Race & ethnicity
- Black 91% White 6% Two or more races 2% Hispanic / Latino 1%
- Foreign-born
- 2% · Canada
Political lean MEDSL · St. Louis
- 2024 margin
- Solid D (+64.7) · D 81.4% · R 16.7% · Other 2.0%
- 2008→2024 swing
- -3.5pp toward R · 2008: 68.2pp · 2024: 64.7pp
- All cycles
- 2024: D+64.7 2020: D+66.2 2016: D+63.7 2012: D+66.6 2008: D+68.2
Not yet ingested
- Civics
- —
Market trends
- HPI YoY
- ▼ -2.14%
- Current HPI
- 107.1335
- Rent YoY
- —
- Metro
- —
- State GDP YoY
- ▲ 1.84%
- F500 in state
- 20
Industry mix (Fortune 500 HQ in MO)
| Industry | F500 HQs | Revenue |
|---|---|---|
| Healthcare | 1 | $163B |
|
||
| Insurance | 1 | $21B |
|
||
| Industrial Technology | 1 | $17B |
|
||
| Retail | 1 | $16B |
|
||
| Industrial Distribution | 1 | $10B |
|
||
| Utilities | 1 | $9B |
|
||
Price history
+455.6% since first listed5 events — show timeline
- 2026-05-12 Listed $100,000 MARIS as Distributed by MLS Grid
- 2026-05-12 Coming Soon $100,000 MARIS as Distributed by MLS Grid
- 2008-09-29 Sold (Public Records) $18,000 Public Records
- 1995-04-19 Sold (Public Records) — Public Records
- 1995-03-08 Sold (Public Records) — Public Records
Property tax history
-2.3%/yrLatest (2024): $147 · +4.1% YoY. Source: county tax records.
Cash-flow waterfall
monthlySold comps — $/sqft
last 12 mo · ≤1 miLoading sold comps…