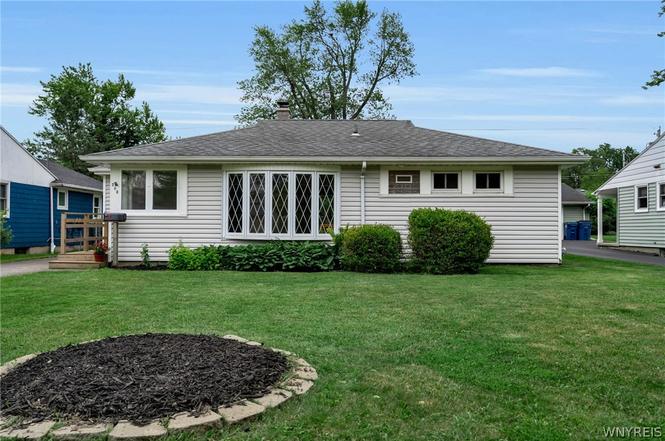
208 Bennington Rd · Cheektowaga, NY
Flood risk 1/10 · Minimal
- FEMA flood zone
- X (unshaded)
- Chance of flooding over 30 yrs
- 0.0%
- Est. flood insurance / yr
- $507 – $1,088
Fire risk 1/10 · Minimal
- Est. fire insurance / yr
- $691 – $1,283
Heat risk 2/10 · Minimal
- Hot days now (above 92°F)
- 7 days/yr
- Hot days in 30 yrs
- 15 days/yr
Wind risk 1/10 · Minimal
- Chance of severe wind over 30 yrs
- —
Air-quality risk 3/10 · Minor
- Unhealthy air days now
- 2 days/yr
- Unhealthy air days in 30 yrs
- 3 days/yr
Risk factors via First Street. Map © Google.
Why this score? — see what drove the D grade
The composite is a weighted blend of 9 inputs, each scored 0–100. Each bar is that input's sub-score; the figure is the points it added to the 100-point composite (weight × sub-score).
- ARV discount +15.0/15.0
- Cash flow +7.8/30.0
- Schools +5.3/10.0
- Rent growth +4.8/5.0
- Livability +4.2/5.0
- 1% rule +3.4/10.0
- Condition / age +2.5/5.0
- DSCR +1.9/10.0
- Appreciation +0.0/10.0
$214,900
🖨 Deal sheet (PDF) 📄 Offer letter ✓ Due diligence
Listing remarks
Welcome to 208 Bennington; a charming storybook ranch tucked in a beautiful neighborhood within Smallwood Schools! This three bedroom, two full bath home features a functional floor plan poised to live and entertain with ease. As you enter from the front steps, a foyer with built-in bench leads you to the light filled living room with LVP flooring and bay window overlooking the front yard. To the left, a galley kitchen with breakfast bar, white cabinetry, granite countertops and energy efficient appliances. First bedroom functions as a convertible bedroom/living space with movable bookcase. Full bath aside it with large tub, ceramic tile and medicine cabinet. Two additional spacious bedroom
Key facts
- Galley kitchen
- Full bath
- Granite countertops
Tags
Property features AI
Exterior
- Parking: No garage
- Utilities: Electricity connected; Public water connected; Sewer connected
- Home design: Single-story home; Vinyl siding; Existing/resale property
- Construction: Poured foundation
- Exterior features: Blacktop driveway; Deck; Fully fenced yard; Shed(s) / storage
Interior
- Kitchen: Eat-in kitchen; Walk-in pantry; Appliances negotiable
- Bedrooms: Three main-level bedrooms
- Flooring: Carpet; Ceramic tile; Hardwood; Varies; Vinyl
- Bathrooms: Two full bathrooms (both on the main level)
- Heating & cooling: Gas forced-air heating
- Interior features: Sliding doors; Breakfast bar; Ceiling fan(s); Den; Separate/formal dining room; Entrance foyer; Eat-in kitchen; Separate/formal living room; Pull-down attic stairs; Sliding glass doors; Walk-in pantry; Bedroom on main level
- Laundry & utility: Main-level laundry; Gas water heater
Neighborhood map
What this means for you Summary
Snapshot
- This is a 3-bed/2.0-bath single-family listed at $215k.
Deal economics
- At list price, monthly cash flow is $-242 ($-3k/yr) — negative.
- To cash-flow at today's rent, offer at most $172k (19.9% below list).
- To meet the 1% rule (rent ≥ 1% of price), the offer needs to be $181k (15.7% below list).
- Recommended offer: $172k (19.9% below list) — sets the bar for cash-flow.
- Cap rate 4.9% vs local median 3.8% in Cheektowaga — top-decile yield for the area; either an underpriced asset or a hidden risk that comps aren't pricing in. Stress-test before assuming the spread holds.
Location & tenants
- Location reads 84/100 on livability (#54 in NY, #811 nationally) — a professional / high-income tenant draw. Strengths: commute A+, housing A+, health & safety A+; Watch: crime C-.
- Amherst Central School District (suburban): math 53% / reading 68% proficiency, ranked #209 of 590 in NY (top 35%) — acceptable for families but not a draw, mixed tenant base, ~2y average lease.
- Zoned schools: Smallwood Drive School (math 53% / reading 68%, grade B-, #741 of 2,108 statewide, top 35%, 659 students, 19% FRL); Amherst Middle School (math 36% / reading 69%, grade C+, #235 of 729 statewide, top 33%, 623 students, 34% FRL); Amherst Central High School (math 100% / reading 82%, grade A+, #226 of 1,100 statewide, top 21%, 870 students, 38% FRL).
- Market conditions: Rents rising fast (+9.0%/yr); 144 active listings in the ZIP; 11 comparable units currently listed for rent nearby; rentals at typical pace (median 26d on market — plan ~3-4 weeks tenant-placement turnaround); 45% of comp listings sitting > 30 days — soft ceiling on asking rent; solid renter incomes; 1,244 units permitted in Erie County in 2024 (563 in 5+ unit buildings).
Forward outlook
- Local home prices are declining (-3.0%/yr); year-one equity from $1k of loan paydown is wiped out by about $6k of value loss. Plan a longer hold.
Negotiation context
- Only 5 days on market — expect competitive offers; lowballing is unlikely to land.
- Current owner paid $81k; list at $215k implies a 165% gain — meaningful room to come down on a strong offer.
Risks & watch-outs
- Watch-outs: property tax is 2.5% of price; built in 1948 — expect roof / HVAC / electrical / plumbing capex.
Questions for the listing agent
- What do current leases actually rent for vs. the listed asking? Can we see a recent rent roll and the last 12 months of T-12 income?
- Built in 1948 — when were the roof, HVAC, electrical panel, plumbing, and water heater last replaced?
- Property tax is high relative to price — has the assessment been appealed recently, and will the sale trigger a re-assessment?
- Is there a deadline driving the sale (1031 exchange, divorce, estate, relocation)? That informs how much negotiation room exists.
- Schools are B-rated — typically a magnet for longer-tenancy family renters. What's the average tenant stay here, and is there a school-zone premium baked into asking?
- The area grade is low — what's the realistic commute time and amenity access for the typical tenant pool here? Any planned neighborhood developments (good or bad) we should know about?
- What's the average days-on-market for RENTAL listings here right now (not sales)? A rising rental-DOM trend means longer vacancies and softer asking-rent achievability than the comps imply.
- What's the recent tenant-quality profile in this submarket — average credit score on applications, eviction rate, late-payment / NSF rate, and stable-employment percentage? A property-management company in the area should have these aggregated.
- How much new for-sale + rental construction is in the pipeline within 1–3 miles? Heavy new supply typically softens prices + rents 12–24 months out; constrained supply supports both.
Investment metrics
- 1% rule
- 0.84% ✗
- Cap rate
- 4.94%
- Cash-on-cash
- -4.83%
- DSCR
- 0.79
- GRM
- 9.9
CMA / ARV
- ARV (on-the-fly)
- $271,491
- Comps found
- 12
Show comp detail 12 sales within ~0.75 mi
| Address | Dist | Beds/Ba | Sqft | Sold | Price | $/sf | Match |
|---|---|---|---|---|---|---|---|
| 38 Bennington Rd | 0.30mi | 3/2.0 | 1,355 (+4%) | 3mo | $347,500 | $256 | 76 |
| 108 Brauncroft Ln | 0.10mi | 3/2.0 | 1,476 (+14%) | 4mo | $355,000 | $241 | 69 |
| 605 Roycroft Blvd | 0.52mi | 3/1.0 | 1,300 (+0%) | 4mo | $235,000 | $181 | 68 |
| 99 Briarcliff Rd | 0.54mi | 3/1.5 | 1,275 (-2%) | 3mo | $170,000 | $133 | 68 |
| 505 Lamarck Dr | 0.33mi | 3/1.0 | 1,165 (-10%) | 2mo | $257,505 | $221 | 62 |
| 14 Binner Rd | 0.61mi | 3/1.5 | 1,364 (+5%) | 2mo | $314,800 | $231 | 60 |
| 204 Ridgewood Dr | 0.31mi | 3/2.0 | 1,492 (+15%) | 3mo | $312,000 | $209 | 59 |
| 266 Merrymont Rd | 0.60mi | 4/1.0 (+1) | 1,398 (+8%) | 1mo | $250,000 | $179 | 50 |
| 82 Ontario Dr | 0.66mi | 3/1.0 | 1,167 (-10%) | 5mo | $170,000 | $146 | 44 |
| 149 S Huxley Dr | 0.69mi | 2/2.0 (-1) | 1,140 (-12%) | 1mo | $241,500 | $212 | 41 |
| 150 Oehman Blvd | 0.67mi | 4/2.0 (+1) | 1,448 (+12%) | 5mo | $160,000 | $110 | 40 |
| 652 Wehrle Dr | 0.60mi | 2/1.0 (-1) | 1,136 (-12%) | 5mo | $176,500 | $155 | 38 |
Match score weights: distance 35% · size 25% · config 20% · recency 20%. Top-matched comps best support the ARV.
Projected returns pro-forma
-3.0% appreciation · 8.0% rent growth · sell at horizon
- IRR
- -18.3%
- Equity multiple
- 0.33×
- Total profit
- $-40,526
- Equity at exit
- $32,042
- IRR
- -2.2%
- Equity multiple
- 0.82×
- Total profit
- $-11,004
- Equity at exit
- $18,581
Cash invested: $60,172 (down + closing). Projections, not guarantees.
Landlord ↔ Tenant lean methodology
- Overall (STATE)
- 15 Strongly Tenant-Friendly
- State New York
- 15 Strongly Tenant-Friendly · D+10
- County
- — inherits STATE
- City
- — inherits STATE
ZIP-level market 14226
- Rents YoY
- 9.0%
- Active inventory
- 144
- Price-to-rent
- 9.9×
Monthly cashflow live
- Estimated rent
- $1,811 high interval (Pro) →
- Mortgage (P&I)
- −$1,127
- Tax from tax record
- −$456 /mo · $5,473/yr
- Insurance
- −$90
- HOA
- −$0
- Vacancy / Maint / Mgmt
- −$380
- Net cashflow
- $-242
Break-even live
Sensitivity live
| Price | -10% $-120 | -5% $-181 | +0% $-242 | +5% $-303 | +10% $-364 |
|---|---|---|---|---|---|
| Rent | -10% $-385 | -5% $-314 | +0% $-242 | +5% $-171 | +10% $-99 |
| Rate | -1.0pp $-134 | -0.5pp $-187 | base $-242 | +0.5pp $-298 | +1.0pp $-354 |
UW: 25.0% down · 7.5% · 30yr · 1.5% tax · 5.0% vac · 8.0% maint · 8.0% mgmt
Financing live
Cash to close
- Down payment
- $53,725
- Closing costs
- $6,447
- Reserves months
- —
- Total cash needed
- —
Loan-product check · same deal, 3 products live
Conventional
25% down · 7.5% · 30yr
- Down + closing
- —
- Monthly P&I
- —
- Monthly cashflow
- —
- DSCR
- —
- Eligible?
- —
Personal DTI + credit; lowest rate.
DSCR
20% down · 8.5% · 30yr
- Down + closing
- —
- Monthly P&I
- —
- Monthly cashflow
- —
- DSCR
- —
- Eligible?
- —
No personal income docs; deal must DSCR.
Hard money
10% down · 12.0% · 12mo
- Down + closing
- —
- Monthly P&I
- —
- Monthly cashflow
- —
- DSCR
- —
- Eligible?
- —
Short-term bridge; refi at stabilization.
Rent comps 11 comps
| Address | Beds | Baths | Sqft | Rent | $/sqft | DOM | Units | Dist |
|---|---|---|---|---|---|---|---|---|
| 455-495 Wehrle Dr Cheektowaga, NY | 2.0 | 1.0 | 1012 | $1,450 | $1.43 | 3d | 1 | 0.24mi |
| 1035 Beach Rd Buffalo, NY | 2.0 | 1.0 | 900 | $1,300 | $1.44 | 45d | 1 | 0.71mi |
| 22 Matthew Ln Unit Left Cheektowaga, NY | 2.0 | 1.0 | 1200 | $1,100 | $0.92 | 45d | 1 | 0.75mi |
| 142 Ellen Dr Buffalo, NY | 2.0 | 1.0 | 1612 | $1,800 | $1.12 | 45d | 1 | 0.81mi |
| 44 Aurora Dr Buffalo, NY | 3.0 | 1.0 | 1272 | $3,300 | $2.59 | 3d | 1 | 0.83mi |
| 32 Bernhardt Dr #10 Buffalo, NY | 2.0 | 1.5 | 1634 | $2,200 | $1.35 | 45d | 1 | 0.94mi |
| 202 S Union Rd Unit 8 Amherst, NY | 2.0 | 1.0 | 1200 | $1,500 | $1.25 | 5d | 1 | 0.98mi |
| 202 S Union Rd Unit 8 Amherst, NY | 2.0 | 1.0 | 1200 | $1,500 | $1.25 | 25d | 1 | 0.98mi |
| 61 Park Club Ln Unit C Buffalo, NY | 2.0 | 1.0 | 1000 | $1,900 | $1.90 | 5d | 1 | 1.00mi |
| 1328 Cleveland Dr Buffalo, NY | 3.0 | 1.0 | 1020 | $2,200 | $2.16 | 3d | 1 | 1.19mi |
| 307 S Cayuga Rd Buffalo, NY | 2.0 | 1.0 | 1008 | $1,500 | $1.49 | 45d | 1 | 1.41mi |
Listing history 4 events
-
2026-06-21days on market $214,900 Active 5 DOM
-
2026-06-18days on market $214,900 Active 2 DOM
-
2026-06-17remarks 699-char remark
-
2026-06-17$214,900 Active 1 DOM
ⓘ Source: listings_history table (triggers on properties + properties_extension) + one-shot
backfill from property_details.listing_events for pre-trigger history.
Tax reassessment forecast NY · Partial reset (capped growth)
- Current annual tax
- $5,473 · $456/mo
- Projected year-2 tax
- $5,473 · $456/mo
- Expected delta
- $0/yr ($0/mo · 0.0%)
ⓘ Screening estimate from a state-policy table — verify with the county assessor before closing.
Climate risk First Street
- Flood 1/10 Low FEMA zone X (unshaded) · 0% chance over 30 yrs
- Wildfire 1/10 Low
- Heat 2/10 Low 7 d/yr ≥92°F today · 15 d/yr by 30 yrs out
- Wind 1/10 Low
- Air quality 3/10 Moderate 2 unhealthy d/yr today · 3 by 30 yrs out
Nearby sold comps map
Loading sold comps map…
Walkable amenities ~0.75 mi
Loading nearby amenities…
Taxation est. · year 1
- Rental income
- $21,730
- − Mortgage interest
- −$12,038
- − Property taxes
- −$5,473
- − Insurance
- −$1,074
- − Repairs & maintenance
- −$1,738
- − Management
- −$1,738
- − Depreciation
- −$6,252
- Taxable loss
- −$6,584
- Est. tax savings @ 24.0%
- +$1,580
- After-tax cash flow
- $-1,324/yr
For passive investors: Depreciation is non-cash, so a rental often shows a tax loss while cash-flowing — sheltering income. Rental losses are passive: they offset passive income freely, and up to $25,000/yr can offset ordinary (W-2) income if you actively participate and your MAGI is under $100k (phasing out to $0 by $150k); unused losses carry forward. On sale, claimed depreciation is recaptured at up to 25%, and gains may owe capital-gains tax (a 1031 exchange can defer both). Figures are a year-1 estimate at your 24.0% rate — not tax advice; consult a CPA.
Schools (NCES district)
- District
- Amherst Central School District
- NCES district ID
- 3602920
- Math proficiency
- 53% ▼ -16.00%
- Reading proficiency
- 68% ▲ 4.00%
- Median HH income
- $68,551
- Composite
- 53.21/100
- National rank
- #1502
- State rank
- #209 of 590 in NY
Livability — Cheektowaga
- Score
- 84/100
- State rank
- #54
- US rank
- #811
Category grades
Schools grade is shown separately in the Schools card above.
Census & demographics
- County
- Erie County · 714,559 people
- City population
- 55,470
- Metro
- Buffalo-Cheektowaga, NY
- Population (ZIP)
- 29,159
- Household income
- $84,325
- Rent vs Own
- Severe rent burden
- 856.0
Population outlook (Erie County) Hauer SSP2
- Today (2025)
- 933,037 people
- By 2030
- 935,181 · +0.2%
- By 2040
- 928,531 · -0.5%
- By 2050
- 905,725 · -2.9%
- By 2075
- 834,037 · -10.6%
- By 2100
- 708,033 · -24.1%
Race, ethnicity, and origin ACS 2023
- Neighborhood character
- Predominantly White (74%)
- Race & ethnicity
- White 74% Black 10% Asian 7% Two or more races 6% Hispanic / Latino 5%
- Common ancestry
- Romanian 7% Lithuanian 2% Slovak 1%
- Foreign-born
- 13% · Canada, China, India
- Languages at home
- 87% English-only · Other Indo-European 4% Spanish 2% Arabic 1%
Political lean MEDSL · Erie
- 2024 margin
- Lean D (+9.7) · D 54.8% · R 45.2%
- 2008→2024 swing
- -7.9pp toward R · 2008: 17.5pp · 2024: 9.7pp
- All cycles
- 2024: D+9.7 2020: D+14.7 2016: D+4.8 2012: D+15.6 2008: D+17.5
Not yet ingested
- Civics
- —
Market trends
- HPI YoY
- ▼ -270.71%
- Current HPI
- 331.1929
- Rent YoY
- ▲ 9.01%
- Metro
- Buffalo-Cheektowaga, NY
- State GDP YoY
- ▲ 2.60%
- F500 in state
- 92
Industry mix (Fortune 500 HQ in NY)
| Industry | F500 HQs | Revenue |
|---|---|---|
| Financial Services | 10 | $950B |
|
||
| Consumer Goods | 9 | $162B |
|
||
| Insurance | 4 | $225B |
|
||
| Telecommunications | 2 | $144B |
|
||
| Pharmaceuticals | 2 | $112B |
|
||
| Media / Entertainment | 2 | $69B |
|
||
Price history
+198.1% since first listed3 events — show timeline
- 2026-06-17 Listed $214,900 WNYREIS
- 2006-06-01 Sold (Public Records) $81,000 Public Records
- 1996-04-16 Sold (Public Records) $72,100 Public Records
Property tax history
+5.3%/yrLatest (2025): $5,473 · +7.4% YoY. Source: county tax records.
Cash-flow waterfall
monthlySold comps — $/sqft
last 12 mo · ≤1 miLoading sold comps…