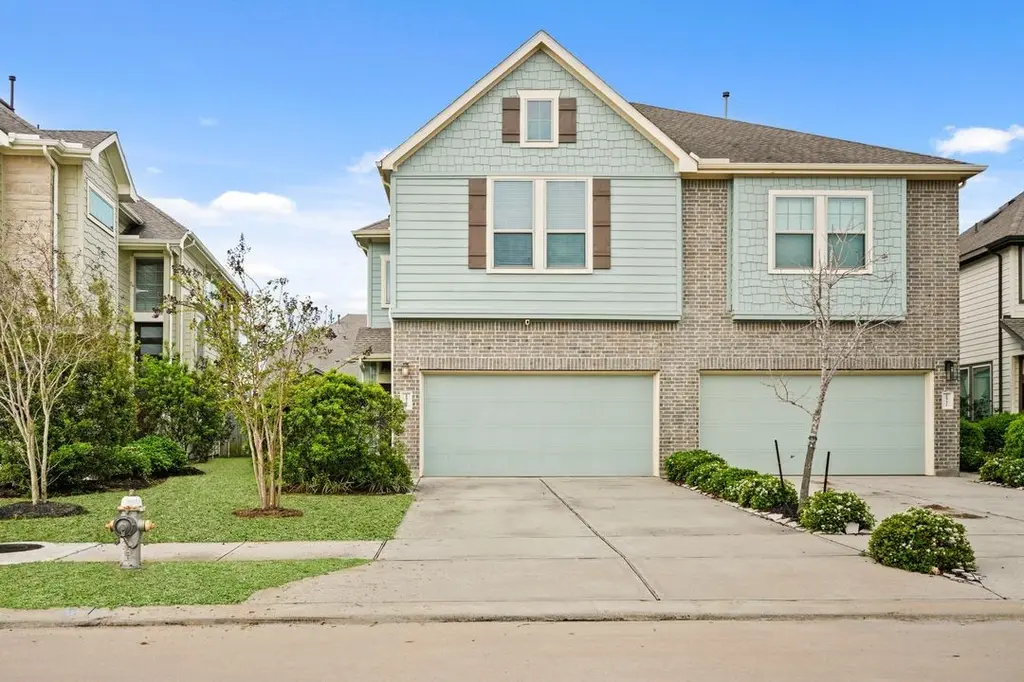
2527 Bordelon Ln · Sienna, TX
Flood risk 1/10 · Minimal
- FEMA flood zone
- X
- Chance of flooding over 30 yrs
- 0.0%
- Est. flood insurance / yr
- $507 – $1,088
Fire risk 4/10 · Minor
- Est. fire insurance / yr
- $1,222 – $2,270
Heat risk 9/10 · Severe
- Hot days now (above 111°F)
- 7 days/yr
- Hot days in 30 yrs
- 23 days/yr
Wind risk 9/10 · Severe
- Chance of severe wind over 30 yrs
- 99.0%
Air-quality risk 2/10 · Minimal
- Unhealthy air days now
- 2 days/yr
- Unhealthy air days in 30 yrs
- 2 days/yr
Risk factors via First Street. Map © Google.
Why this score? — see what drove the B+ grade
The composite is a weighted blend of 9 inputs, each scored 0–100. Each bar is that input's sub-score; the figure is the points it added to the 100-point composite (weight × sub-score).
- Cash flow +30.0/30.0
- ARV discount +10.8/15.0
- 1% rule +10.0/10.0
- DSCR +10.0/10.0
- Schools +4.5/10.0
- Appreciation +4.2/10.0
- Rent growth +2.5/5.0
- Livability +2.5/5.0
- Condition / age +2.5/5.0
$267,500
🖨 Deal sheet 📄 Offer letter ✓ Due diligence
Listing remarks MLS
Beautifully maintained 3 bed, 2.5 bath Townhome located in the amenity-rich Sienna Plantation Community. This Chesmar Home features an open concept living that include high ceilings and hard surface floors throughout the main level. The first floor boasts a spacious living room, open dining area, convenient powder room & well-appointed kitchen w/custom backsplash, Quartz counters, gas range, pantry, center island with seating and ample storage. The upper level offers a nice sized game room, two additional bedrooms, a full guest bath & large laundry. The primary bedroom includes vaulted ceilings, natural light, with a spa-like bath with walk-in closet. The backyard has a large patio with a huge backyard that is great for entertaining. The resort-style amenities include a 12-acre recreation complex, with 2 fitness centers, tennis courts, 5 pools, 2 water parks, 34 parks, 2 community centers, dog parks, and miles of walking trails! Sienna a great place to live!
Key facts
- Custom backsplash
- Quartz counters
- Open concept living
Tags
Neighborhood map
What this means for you Summary
Snapshot
- This is a 3-bed/2.0-bath townhouse listed at $268k.
Deal economics
- At list price, monthly cash flow is $1k ($16k/yr) — positive.
- The deal already cash-flows at list — no discount required.
- Meets the 1% rule at list price ($5k rent vs $268k).
- Recommended offer: $251k (6.0% below list) — sets the bar for market timing.
- Cap rate 12.1% vs local median 3.3% in Sienna — top-decile yield for the area; either an underpriced asset or a hidden risk that comps aren't pricing in. Stress-test before assuming the spread holds.
Location & tenants
- Location reads: area grade B — affects rentability + tenant quality, not the cash-flow math above.
- Fort Bend ISD (suburban): math 44% / reading 53% proficiency, ranked #140 of 826 in TX (top 17%) — families likely to look elsewhere, expect single-tenant / working-renter base with shorter leases.
- Market conditions: Rents soft (-0.1%/yr); 1215 active listings in the ZIP; 3 comparable units currently listed for rent nearby; rentals at typical pace (median 22d on market — plan ~3-4 weeks tenant-placement turnaround); high-income renter base; 12,093 units permitted in Fort Bend County in 2024 (815 in 5+ unit buildings).
- This rent runs 43% of the median local income ($129k/yr) — at the standard rent-burdened threshold; future hikes will face affordability resistance.
Forward outlook
- Local home prices are declining (-1.7%/yr); year-one equity from $2k of loan paydown is wiped out by about $4k of value loss. Plan a longer hold.
- Fort Bend County population projected at +75% by 2050 — long-run rental-demand tailwind backs the buy-and-hold thesis.
- At projected returns (-1.7% appreciation + 0.0% rent growth), your $75k cash investment doubles in ~6 years — after that, you're playing with house money.
Negotiation context
- It's been on market 73 days — a 6% lower offer ($251k) is reasonable based on typical stale-listing flexibility.
- 4 sale attempts since 4y ago; this cycle's ask has dropped $17k (6%) from the opening price — seller is motivated, your offer sets the floor, not the list.
Risks & watch-outs
- Watch-outs: property tax is 3.3% of price.
- Climate carrying-cost: severe wind risk, 99% chance of damaging wind over 30y; extreme-heat days projected 7→23/yr by 2055 (HVAC capex compounding) — expect insurance premiums to compound above CPI over the hold.
Questions for the listing agent
- It's been on market 73 days. Have you received any prior offers? Is the seller open to a 6% concession, seller financing, or rate buy-down credit?
- Property tax is high relative to price — has the assessment been appealed recently, and will the sale trigger a re-assessment?
- What does the HOA fee cover, when was the last increase, and are there any pending special assessments or reserve-fund shortfalls?
- Why hasn't it sold? Are there any deal-killer items the seller is aware of (foundation, flood, title, zoning, code violations)?
- Is there a deadline driving the sale (1031 exchange, divorce, estate, relocation)? That informs how much negotiation room exists.
- What's the average days-on-market for RENTAL listings here right now (not sales)? A rising rental-DOM trend means longer vacancies and softer asking-rent achievability than the comps imply.
- What's the recent tenant-quality profile in this submarket — average credit score on applications, eviction rate, late-payment / NSF rate, and stable-employment percentage? A property-management company in the area should have these aggregated.
- How much new for-sale + rental construction is in the pipeline within 1–3 miles? Heavy new supply typically softens prices + rents 12–24 months out; constrained supply supports both.
Investment metrics
- 1% rule
- 1.73% ✓
- Cap rate
- 12.11%
- Cash-on-cash
- 20.76%
- DSCR
- 1.92
- GRM
- 4.8
CMA / ARV
- ARV (median comp)
- $288,620
- List price
- $267,500
- Delta
- -7.32%
- Verdict
- FAIR
- Comps
- 20 within 1.0 mi
Show comp detail 12 sales within ~0.75 mi
| Address | Dist | Beds/Ba | Sqft | Sold | Price | $/sf | Match |
|---|---|---|---|---|---|---|---|
| 2527 Bordelon Ln | 0.00mi | 3/2.5 | 1,820 (0%) | 0mo | $267,500 | $147 | 98 |
| 2546 Bordelon Ln | 0.07mi | 3/2.5 | 1,870 (+3%) | 4mo | $255,000 | $136 | 87 |
| 8758 Laurel Crest Dr | 0.06mi | 3/2.5 | 1,900 (+4%) | 2mo | $275,000 | $145 | 86 |
| 2531 Terrace Point Dr | 0.06mi | 3/2.5 | 1,903 (+5%) | 6mo | $275,000 | $145 | 83 |
| 2522 Terrace Point Dr | 0.04mi | 3/2.5 | 1,953 (+7%) | 3mo | $280,000 | $143 | 82 |
| 2546 Manor Valley Ct | 0.11mi | 3/2.5 | 1,958 (+8%) | 5mo | $344,900 | $176 | 76 |
| 2523 Terrace Point Dr | 0.06mi | 3/2.5 | 1,737 (-5%) | 19mo | $279,900 | $161 | 72 |
| 2526 Terrace Point Dr | 0.03mi | 3/2.5 | 1,890 (+4%) | 24mo | $289,000 | $153 | 70 |
| 2558 Terrace Point Dr | 0.04mi | 3/2.5 | 1,903 (+5%) | 23mo | $300,000 | $158 | 70 |
| 2571 Terrace Point Dr | 0.07mi | 3/2.5 | 1,973 (+8%) | 24mo | $295,000 | $150 | 61 |
| 2506 Bordelon Ln | 0.04mi | 3/3.0 | 2,073 (+14%) | 12mo | $299,900 | $145 | 61 |
| 2502 Bordelon Ln | 0.04mi | 3/3.0 | 2,013 (+11%) | 23mo | $317,500 | $158 | 57 |
Match score weights: distance 35% · size 25% · config 20% · recency 20%. Top-matched comps best support the ARV.
Projected returns pro-forma
-1.67% appreciation · 0.0% rent growth · sell at horizon
- IRR
- 13.2%
- Equity multiple
- 1.55×
- Total profit
- $41,209
- Equity at exit
- $56,102
- IRR
- 17.3%
- Equity multiple
- 2.40×
- Total profit
- $105,008
- Equity at exit
- $51,964
Cash invested: $74,900 (down + closing). Projections, not guarantees.
Landlord ↔ Tenant lean methodology
- Overall (STATE)
- 87 Strongly Landlord-Friendly
- State Texas
- 87 Strongly Landlord-Friendly · R+5
- County
- — inherits STATE
- City
- — inherits STATE
ZIP-level market 77459
- Home prices YoY
- -0.8%
- Rents YoY
- -0.1%
- Active inventory
- 1215
- Price-to-rent
- 4.8×
Monthly cashflow live
- Estimated rent
- $4,640 medium interval (Pro) →
- Mortgage (P&I)
- −$1,403
- Tax from tax record
- −$746 /mo · $8,947/yr
- Insurance
- −$111
- HOA
- −$110
- Vacancy / Maint / Mgmt
- −$974
- Net cashflow
- $1,296
Break-even live
UW: 25.0% down · 7.5% · 30yr · 1.5% tax · 5.0% vac · 8.0% maint · 8.0% mgmt
Financing live
Cash to close
- Down payment
- $66,875
- Closing costs
- $8,025
- Reserves months
- —
- Total cash needed
- —
Loan-product check · same deal, 3 products live
Conventional
25% down · 7.5% · 30yr
- Down + closing
- —
- Monthly P&I
- —
- Monthly cashflow
- —
- DSCR
- —
- Eligible?
- —
Personal DTI + credit; lowest rate.
DSCR
20% down · 8.5% · 30yr
- Down + closing
- —
- Monthly P&I
- —
- Monthly cashflow
- —
- DSCR
- —
- Eligible?
- —
No personal income docs; deal must DSCR.
Hard money
10% down · 12.0% · 12mo
- Down + closing
- —
- Monthly P&I
- —
- Monthly cashflow
- —
- DSCR
- —
- Eligible?
- —
Short-term bridge; refi at stabilization.
Rent comps 3 comps
| Address | Beds | Baths | Sqft | Rent | $/sqft | DOM | Units | Dist |
|---|---|---|---|---|---|---|---|---|
| 2142 Ironwood Pass Dr Missouri City, TX | 4.0 | 3.0 | 2140 | $6,000 | $2.80 | 1d | 1 | 0.45mi |
| 8719 Fox Trail Dr Missouri City, TX | 4.0 | 3.5 | 2143 | $6,000 | $2.80 | 22d | 1 | 0.68mi |
| 1714 Forest Mist Dr Missouri City, TX | 3.0 | 3.0 | 1979 | $3,000 | $1.52 | 43d | 1 | 1.47mi |
HOA detail
- Monthly dues
- $110 · $1,320/yr
- Likely covers
- watergaspoolgym
Listing history 15 events
-
2026-05-02price $267,500 981-char remark
Show marketing remark (981 chars)
Beautifully maintained 3 bed, 2.5 bath Townhome located in the amenity-rich Sienna Plantation Community. This Chesmar Home features an open concept living that include high ceilings and hard surface floors throughout the main level. The first floor boasts a spacious living room, open dining area, convenient powder room & well-appointed kitchen w/custom backsplash, Quartz counters, gas range, pantry, center island with seating and ample storage. The upper level offers a nice sized game room, two additional bedrooms, a full guest bath & large laundry. The primary bedroom includes vaulted ceilings, natural light, with a spa-like bath with walk-in closet. The backyard has a large patio with a huge backyard that is great for entertaining. The resort-style amenities include a 12-acre recreation complex, with 2 fitness centers, tennis courts, 5 pools, 2 water parks, 34 parks, 2 community centers, dog parks, and miles of walking trails! Sienna a great place to live!
-
2026-04-07price $275,000 981-char remark
Show marketing remark (981 chars)
Beautifully maintained 3 bed, 2.5 bath Townhome located in the amenity-rich Sienna Plantation Community. This Chesmar Home features an open concept living that include high ceilings and hard surface floors throughout the main level. The first floor boasts a spacious living room, open dining area, convenient powder room & well-appointed kitchen w/custom backsplash, Quartz counters, gas range, pantry, center island with seating and ample storage. The upper level offers a nice sized game room, two additional bedrooms, a full guest bath & large laundry. The primary bedroom includes vaulted ceilings, natural light, with a spa-like bath with walk-in closet. The backyard has a large patio with a huge backyard that is great for entertaining. The resort-style amenities include a 12-acre recreation complex, with 2 fitness centers, tennis courts, 5 pools, 2 water parks, 34 parks, 2 community centers, dog parks, and miles of walking trails! Sienna a great place to live!
-
2026-03-11$284,900 Active 981-char remark
Show marketing remark (981 chars)
Beautifully maintained 3 bed, 2.5 bath Townhome located in the amenity-rich Sienna Plantation Community. This Chesmar Home features an open concept living that include high ceilings and hard surface floors throughout the main level. The first floor boasts a spacious living room, open dining area, convenient powder room & well-appointed kitchen w/custom backsplash, Quartz counters, gas range, pantry, center island with seating and ample storage. The upper level offers a nice sized game room, two additional bedrooms, a full guest bath & large laundry. The primary bedroom includes vaulted ceilings, natural light, with a spa-like bath with walk-in closet. The backyard has a large patio with a huge backyard that is great for entertaining. The resort-style amenities include a 12-acre recreation complex, with 2 fitness centers, tennis courts, 5 pools, 2 water parks, 34 parks, 2 community centers, dog parks, and miles of walking trails! Sienna a great place to live!
-
2024-12-08historical
-
2024-06-10$314,900 Active
-
2022-12-07soldstatus
-
2022-12-06soldstatus Sold
-
2022-11-20status Pending
-
2022-11-12status Option Pending
-
2022-09-21$335,000 Active
-
2022-09-20historical
-
2022-07-22price $345,000
-
2022-06-26price $360,000
-
2022-06-25price $350,000
-
2022-06-25$650,000 Active
ⓘ Source: listings_history table (triggers on properties + properties_extension) + one-shot
backfill from property_details.listing_events for pre-trigger history.
Tax reassessment forecast TX · Resets to sale price
- Current annual tax
- $8,947 · $746/mo
- Projected year-2 tax
- $8,947 · $746/mo
- Expected delta
- $0/yr ($0/mo · 0.0%)
ⓘ Screening estimate from a state-policy table — verify with the county assessor before closing.
Climate risk First Street
- Flood 1/10 Low FEMA zone X · 0% chance over 30 yrs
- Wildfire 4/10 Moderate
- Heat 9/10 Extreme 7 d/yr ≥111°F today · 23 d/yr by 30 yrs out
- Wind 9/10 Extreme 99% chance of damaging wind over 30 yrs
- Air quality 2/10 Low 2 unhealthy d/yr today · 2 by 30 yrs out
Nearby sold comps map
Loading sold comps map…
Walkable amenities ~0.75 mi
Loading nearby amenities…
Taxation est. · year 1
- Rental income
- $55,678
- − Mortgage interest
- −$14,984
- − Property taxes
- −$8,947
- − Insurance
- −$1,338
- − Repairs & maintenance
- −$4,454
- − Management
- −$4,454
- − HOA
- −$1,320
- − Depreciation
- −$7,782
- Taxable income
- $12,399
- Est. tax owed @ 24.0%
- −$2,976
- After-tax cash flow
- $12,572/yr
For passive investors: Depreciation is non-cash, so a rental often shows a tax loss while cash-flowing — sheltering income. Rental losses are passive: they offset passive income freely, and up to $25,000/yr can offset ordinary (W-2) income if you actively participate and your MAGI is under $100k (phasing out to $0 by $150k); unused losses carry forward. On sale, claimed depreciation is recaptured at up to 25%, and gains may owe capital-gains tax (a 1031 exchange can defer both). Figures are a year-1 estimate at your 24.0% rate — not tax advice; consult a CPA.
Schools (NCES district)
- District
- Fort Bend ISD
- NCES district ID
- 4819650
- Math proficiency
- 44% ▼ -15.00%
- Reading proficiency
- 53% ▼ -4.00%
- Median HH income
- $82,360
- Composite
- 44.61/100
- National rank
- #2779
- State rank
- #140 of 826 in TX
Livability — Sienna
No livability data for this city. (Only ~50 U.S. cities are tracked.)
Census & demographics
- Census place
- Sienna, TX
- County
- Fort Bend County · 836,777 people
- Metro
- Houston-The Woodlands-Sugar Land, TX
- Population (ZIP)
- 84,221
- Household income
- $129,151
- Rent vs Own
- Severe rent burden
- 1004.0
Population outlook (Fort Bend County) Hauer SSP2
- Today (2025)
- 1,004,526 people
- By 2030
- 1,153,104 · +14.8%
- By 2040
- 1,453,718 · +44.7%
- By 2050
- 1,753,781 · +74.6%
- By 2075
- 2,455,772 · +144.5%
- By 2100
- 2,930,528 · +191.7%
Race, ethnicity, and origin ACS 2023
- Neighborhood character
- Highly diverse neighborhood (Simpson 0.75)
- Race & ethnicity
- White 34% Black 26% Asian 22% Hispanic / Latino 13% Two or more races 10%
- Hispanic origin (detail)
- Mexican 7%
- Common ancestry
- Lithuanian 2% Slovak 1% Italian 1%
- Foreign-born
- 21% · Canada, China, Vietnam
- Languages at home
- 73% English-only · Other Asian/Pacific 8% Spanish 7% Other Indo-European 5%
Political lean MEDSL · Fort Bend
- 2024 margin
- Toss-up / Even · D 49.5% · R 47.9% · Other 2.6%
- 2008→2024 swing
- +4.0pp toward D · 2008: -2.4pp · 2024: 1.6pp
- All cycles
- 2024: D+1.6 2020: D+10.6 2016: D+6.6 2012: R+6.8 2008: R+2.4
Not yet ingested
- Civics
- —
Market trends
- HPI YoY
- ▼ -1.67%
- Current HPI
- 212.3573
- Rent YoY
- ▼ -0.15%
- Metro
- Houston-The Woodlands-Sugar Land, TX
- State GDP YoY
- ▲ 3.95%
- F500 in state
- 110
Industry mix (Fortune 500 HQ in TX)
| Industry | F500 HQs | Revenue |
|---|---|---|
| Energy | 16 | $1,198B |
|
||
| Technology | 5 | $198B |
|
||
| Engineering / Construction | 4 | $72B |
|
||
| Energy Services | 3 | $60B |
|
||
| Utilities | 3 | $41B |
|
||
| Healthcare | 2 | $330B |
|
||
Price history
-58.8% since first listed15 events — show timeline
- 2026-05-02 Price Changed $267,500 HARMLS
- 2026-04-07 Price Changed $275,000 HARMLS
- 2026-03-11 Listed $284,900 HARMLS
- 2024-12-08 Listing Removed — HARMLS
- 2024-06-10 Listed $314,900 HARMLS
- 2022-12-07 Sold (Public Records) — Public Records
- 2022-12-06 Sold (MLS) — HARMLS
- 2022-11-20 Pending — HARMLS
- 2022-11-12 Pending — HARMLS
- 2022-09-21 Listed $335,000 HARMLS
- 2022-09-20 Listing Removed — HARMLS
- 2022-07-22 Price Changed $345,000 HARMLS
- 2022-06-26 Price Changed $360,000 HARMLS
- 2022-06-25 Price Changed $350,000 HARMLS
- 2022-06-25 Listed $650,000 HARMLS
Property tax history
+100.8%/yrLatest (2025): $8,947 · -0.6% YoY. Source: county tax records.
Cash-flow waterfall
monthlySold comps — $/sqft
last 12 mo · ≤1 miLoading sold comps…