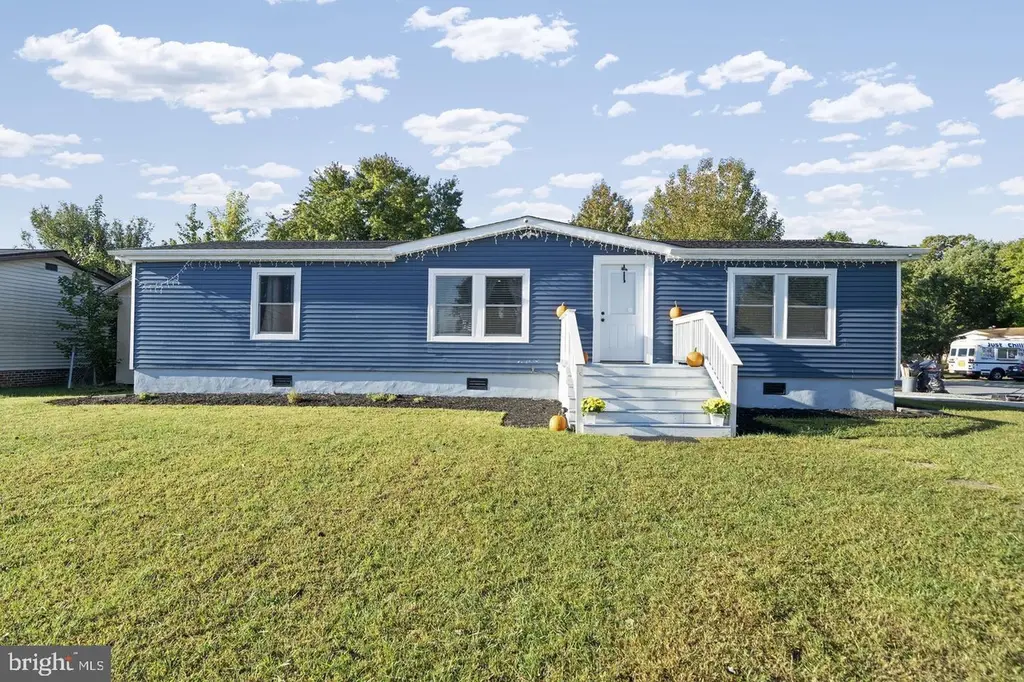
45939 Halsey Ct · California, MD
Flood risk 1/10 · Minimal
- FEMA flood zone
- X (unshaded)
- Chance of flooding over 30 yrs
- 0.0%
- Est. flood insurance / yr
- $507 – $1,088
Fire risk 4/10 · Minor
- Est. fire insurance / yr
- $755 – $1,403
Heat risk 9/10 · Severe
- Hot days now (above 101°F)
- 7 days/yr
- Hot days in 30 yrs
- 17 days/yr
Wind risk 6/10 · Moderate
- Chance of severe wind over 30 yrs
- 71.0%
Air-quality risk 2/10 · Minimal
- Unhealthy air days now
- 1 days/yr
- Unhealthy air days in 30 yrs
- 2 days/yr
Risk factors via First Street. Map © Google.
Why this score? — see what drove the C- grade
The composite is a weighted blend of 9 inputs, each scored 0–100. Each bar is that input's sub-score; the figure is the points it added to the 100-point composite (weight × sub-score).
- Cash flow +16.2/30.0
- ARV discount +6.3/15.0
- Appreciation +6.2/10.0
- DSCR +5.0/10.0
- Rent growth +4.2/5.0
- 1% rule +3.7/10.0
- Livability +3.7/5.0
- Schools +3.0/10.0
- Condition / age +2.5/5.0
$284,900
🖨 Deal sheet 📄 Offer letter ✓ Due diligence
Listing remarks MLS
Welcome home to Halsey Court. Just bring your toothbrush and move right into this sweet corner lot rambler. With roof, HVAC, kitchen, flooring and water heater all being replaced within the past 3 years, this place is practically a new build! A beautifully updated and generous open living space and kitchen greet you upon entry. Grill out with family and friends on the large back deck. The split floorpan allows for privacy between primary and secondary bedrooms, but also easy accessibility when needed. Great location, close to PAX, shopping and restaurants!
Key facts
- 6,534 sq ft lot
- Built 1985
- Listed 25 days
Property features AI
Exterior
- Parking: Driveway
- Utilities: Public water; Public sewer; Electric service for heating, cooling, and hot water
- Home design: Detached property; Fee simple ownership; Year built estimated
- Construction: Vinyl siding; Other foundation
- Exterior features: Detached single-family structure; Above-grade other structures noted
Interior
- Kitchen: Kitchen (appliances not specified)
- Bedrooms: 3 bedrooms on the main level (part of the 3-bedroom layout)
- Bathrooms: 2 full bathrooms
- Heating & cooling: Forced air heating (electric); Heat pump cooling (electric); Electric hot water
- Interior features: Estimated living area; 7 total rooms; No basement
Neighborhood map
What this means for you Summary
Snapshot
- This is a 3-bed/2.0-bath single-family listed at $285k.
Deal economics
- At list price, monthly cash flow is $152 ($2k/yr) — positive.
- The deal already cash-flows at list — no discount required.
- To meet the 1% rule (rent ≥ 1% of price), the offer needs to be $247k (13.3% below list).
- Recommended offer: $247k (13.3% below list) — sets the bar for 1% rule.
- Cap rate 6.9% vs local median 4.3% in California — top-decile yield for the area; either an underpriced asset or a hidden risk that comps aren't pricing in. Stress-test before assuming the spread holds.
Location & tenants
- Location reads 73/100 on livability (#127 in MD) — a middle-class / working-renter tenant base. Strengths: employment A+, housing A+, health & safety A+; Watch: crime D+, amenities F, commute F.
- St. Mary'S County Public Schools (rural): math 23% / reading 38% proficiency, ranked #8 of 24 in MD (top 33%) — families likely to look elsewhere, expect single-tenant / working-renter base with shorter leases.
- Market conditions: Rents rising fast (+6.7%/yr); 65 active listings in the ZIP; high-income renter base; 265 units permitted in St. Mary's County in 2024 (0 in 5+ unit buildings).
Forward outlook
- In year one you build about $9k of equity ($2k loan paydown + $7k appreciation (2.3% local appreciation)).
- St. Mary's County population projected at +16% by 2050 — long-run rental-demand tailwind backs the buy-and-hold thesis.
- At projected returns (2.3% appreciation + 6.7% rent growth), your $80k cash investment doubles in ~6 years — after that, you're playing with house money.
- By year 5, paydown + projected appreciation supports a ~$37k cash-out refi (75% LTV) — recoverable capital for the next deal without selling this one.
Negotiation context
- It's been on market 25 days — a 2% lower offer ($281k) is reasonable based on typical stale-listing flexibility.
- 6 sale attempts since 30y ago with the ask held roughly flat each time — persistent listings suggest the price (not the market) is what's stuck; bring a comps-based counter.
- Current owner paid $245k; 16% above their basis — modest negotiation headroom, anchor on the comps not their cost.
Risks & watch-outs
- Climate carrying-cost: major wind risk, 71% chance of damaging wind over 30y; extreme-heat days projected 7→17/yr by 2055 (HVAC capex compounding) — expect insurance premiums to compound above CPI over the hold.
Questions for the listing agent
- Is there a deadline driving the sale (1031 exchange, divorce, estate, relocation)? That informs how much negotiation room exists.
- Crime grade is D in this area — have there been break-ins, vandalism, or insurance claims at this property in the last 3 years? What carrier currently insures it and at what premium?
- What's the average days-on-market for RENTAL listings here right now (not sales)? A rising rental-DOM trend means longer vacancies and softer asking-rent achievability than the comps imply.
- What's the recent tenant-quality profile in this submarket — average credit score on applications, eviction rate, late-payment / NSF rate, and stable-employment percentage? A property-management company in the area should have these aggregated.
- How much new for-sale + rental construction is in the pipeline within 1–3 miles? Heavy new supply typically softens prices + rents 12–24 months out; constrained supply supports both.
Investment metrics
- 1% rule
- 0.87% ✗
- Cap rate
- 6.93%
- Cash-on-cash
- 2.29%
- DSCR
- 1.10
- GRM
- 9.6
CMA / ARV
- ARV (on-the-fly)
- $277,472
- Comps found
- 12
Show comp detail 12 sales within ~0.75 mi
| Address | Dist | Beds/Ba | Sqft | Sold | Price | $/sf | Match |
|---|---|---|---|---|---|---|---|
| 45939 Halsey Ct | 0.00mi | 3/2.0 | 1,196 (0%) | 0mo | $280,000 | $234 | 100 |
| 22518 Armsworthy Ct | 0.05mi | 3/2.0 | 1,248 (+4%) | 4mo | $252,000 | $202 | 87 |
| 45857 N Poteat Ct | 0.21mi | 3/2.0 | 1,152 (-4%) | 4mo | $260,000 | $226 | 81 |
| 22436 Macarthur Blvd | 0.15mi | 3/2.0 | 1,248 (+4%) | 6mo | $289,900 | $232 | 80 |
| 45880 S Springsteen Ct | 0.25mi | 3/2.0 | 1,152 (-4%) | 2mo | $166,000 | $144 | 80 |
| 45908 S Springsteen Ct S | 0.28mi | 3/2.0 | 1,248 (+4%) | 4mo | $303,000 | $243 | 77 |
| 45895 S Poteat Ct | 0.24mi | 3/2.0 | 1,152 (-4%) | 8mo | $290,000 | $252 | 76 |
| 45958 Shields Ct | 0.16mi | 3/2.0 | 1,250 (+4%) | 13mo | $250,000 | $200 | 74 |
| 22489 Wainwright Ct | 0.07mi | 3/2.0 | 1,338 (+12%) | 4mo | $290,000 | $217 | 73 |
| 45756 Sayre Dr | 0.34mi | 3/2.0 | 1,104 (-8%) | 2mo | $322,000 | $292 | 70 |
| 45899 S Springsteen Ct | 0.30mi | 3/2.0 | 1,248 (+4%) | 14mo | $280,000 | $224 | 68 |
| 45801 Belvoir Rd | 0.58mi | 3/2.0 | 1,224 (+2%) | 9mo | $350,000 | $286 | 62 |
Match score weights: distance 35% · size 25% · config 20% · recency 20%. Top-matched comps best support the ARV.
Projected returns pro-forma
2.3% appreciation · 6.73% rent growth · sell at horizon
- IRR
- 9.7%
- Equity multiple
- 1.54×
- Total profit
- $43,225
- Equity at exit
- $117,101
- IRR
- 14.4%
- Equity multiple
- 3.13×
- Total profit
- $170,241
- Equity at exit
- $172,337
Cash invested: $79,772 (down + closing). Projections, not guarantees.
Landlord ↔ Tenant lean methodology
- Overall (STATE)
- 27 Tenant-Leaning
- State Maryland
- 27 Tenant-Leaning · D+14
- County
- — inherits STATE
- City
- — inherits STATE
ZIP-level market 20619
- Home prices YoY
- 1.0%
- Rents YoY
- 6.7%
- Active inventory
- 65
- Price-to-rent
- 9.6×
Monthly cashflow live
- Estimated rent
- $2,471 medium interval (Pro) →
- Mortgage (P&I)
- −$1,494
- Tax from tax record
- −$187 /mo · $2,242/yr
- Insurance
- −$119
- HOA
- −$0
- Vacancy / Maint / Mgmt
- −$519
- Net cashflow
- $152
Break-even live
UW: 25.0% down · 7.5% · 30yr · 1.5% tax · 5.0% vac · 8.0% maint · 8.0% mgmt
Financing live
Cash to close
- Down payment
- $71,225
- Closing costs
- $8,547
- Reserves months
- —
- Total cash needed
- —
Loan-product check · same deal, 3 products live
Conventional
25% down · 7.5% · 30yr
- Down + closing
- —
- Monthly P&I
- —
- Monthly cashflow
- —
- DSCR
- —
- Eligible?
- —
Personal DTI + credit; lowest rate.
DSCR
20% down · 8.5% · 30yr
- Down + closing
- —
- Monthly P&I
- —
- Monthly cashflow
- —
- DSCR
- —
- Eligible?
- —
No personal income docs; deal must DSCR.
Hard money
10% down · 12.0% · 12mo
- Down + closing
- —
- Monthly P&I
- —
- Monthly cashflow
- —
- DSCR
- —
- Eligible?
- —
Short-term bridge; refi at stabilization.
Listing history 21 events
-
2026-05-01status Pending
-
2026-04-06$284,900 Active
-
2023-05-10soldstatus $245,000
-
2023-04-27soldstatus $245,000 Closed 562-char remark
Show marketing remark (562 chars)
Welcome home to Halsey Court. Just bring your toothbrush and move right into this sweet corner lot rambler. With roof, HVAC, kitchen, flooring and water heater all being replaced within the past 3 years, this place is practically a new build! A beautifully updated and generous open living space and kitchen greet you upon entry. Grill out with family and friends on the large back deck. The split floorpan allows for privacy between primary and secondary bedrooms, but also easy accessibility when needed. Great location, close to PAX, shopping and restaurants!
-
2023-02-27historical Active Under Contract 562-char remark
Show marketing remark (562 chars)
Welcome home to Halsey Court. Just bring your toothbrush and move right into this sweet corner lot rambler. With roof, HVAC, kitchen, flooring and water heater all being replaced within the past 3 years, this place is practically a new build! A beautifully updated and generous open living space and kitchen greet you upon entry. Grill out with family and friends on the large back deck. The split floorpan allows for privacy between primary and secondary bedrooms, but also easy accessibility when needed. Great location, close to PAX, shopping and restaurants!
-
2023-01-31$245,000 Active 562-char remark
Show marketing remark (562 chars)
Welcome home to Halsey Court. Just bring your toothbrush and move right into this sweet corner lot rambler. With roof, HVAC, kitchen, flooring and water heater all being replaced within the past 3 years, this place is practically a new build! A beautifully updated and generous open living space and kitchen greet you upon entry. Grill out with family and friends on the large back deck. The split floorpan allows for privacy between primary and secondary bedrooms, but also easy accessibility when needed. Great location, close to PAX, shopping and restaurants!
-
2023-01-31historical
Show marketing remark (562 chars)
Welcome home to Halsey Court. Just bring your toothbrush and move right into this sweet corner lot rambler. With roof, HVAC, kitchen, flooring and water heater all being replaced within the past 3 years, this place is practically a new build! A beautifully updated and generous open living space and kitchen greet you upon entry. Grill out with family and friends on the large back deck. The split floorpan allows for privacy between primary and secondary bedrooms, but also easy accessibility when needed. Great location, close to PAX, shopping and restaurants!
-
2022-11-18price $249,900
-
2022-10-14$250,000 Active
-
2019-02-22soldstatus $54,900 Closed
-
2019-01-23status Pending
-
2019-01-15$54,900 Active
-
2007-06-27soldstatus $182,000
-
2006-09-01soldstatus $182,000
-
2006-08-18historical
-
2006-06-12$184,000
-
1998-08-13soldstatus $87,500
-
1998-08-11soldstatus $87,500
-
1998-07-05historical
-
1996-09-24$84,900
-
1993-12-08soldstatus $84,500
ⓘ Source: listings_history table (triggers on properties + properties_extension) + one-shot
backfill from property_details.listing_events for pre-trigger history.
Tax reassessment forecast MD · Partial reset (capped growth)
- Current annual tax
- $2,242 · $187/mo
- Projected year-2 tax
- $2,674 · $223/mo
- Expected delta
- +$431/yr (+$36/mo · 19.2%)
ⓘ Screening estimate from a state-policy table — verify with the county assessor before closing.
Climate risk First Street
- Flood 1/10 Low FEMA zone X (unshaded) · 0% chance over 30 yrs
- Wildfire 4/10 Moderate
- Heat 9/10 Extreme 7 d/yr ≥101°F today · 17 d/yr by 30 yrs out
- Wind 6/10 Major 71% chance of damaging wind over 30 yrs
- Air quality 2/10 Low 1 unhealthy d/yr today · 2 by 30 yrs out
Nearby sold comps map
Loading sold comps map…
Walkable amenities ~0.75 mi
Loading nearby amenities…
Taxation est. · year 1
- Rental income
- $29,648
- − Mortgage interest
- −$15,959
- − Property taxes
- −$2,242
- − Insurance
- −$1,424
- − Repairs & maintenance
- −$2,372
- − Management
- −$2,372
- − Depreciation
- −$8,288
- Taxable loss
- −$3,009
- Est. tax savings @ 24.0%
- +$722
- After-tax cash flow
- $2,549/yr
For passive investors: Depreciation is non-cash, so a rental often shows a tax loss while cash-flowing — sheltering income. Rental losses are passive: they offset passive income freely, and up to $25,000/yr can offset ordinary (W-2) income if you actively participate and your MAGI is under $100k (phasing out to $0 by $150k); unused losses carry forward. On sale, claimed depreciation is recaptured at up to 25%, and gains may owe capital-gains tax (a 1031 exchange can defer both). Figures are a year-1 estimate at your 24.0% rate — not tax advice; consult a CPA.
Schools (NCES district)
- District
- St. Mary'S County Public Schools
- NCES district ID
- 2400600
- Math proficiency
- 23% ▼ -23.00%
- Reading proficiency
- 38% ▼ -12.00%
- Median HH income
- $83,240
- Composite
- 29.74/100
- National rank
- #6444
- State rank
- #8 of 24 in MD
Livability — California
- Score
- 73/100
- State rank
- #127
- US rank
- #5421
Category grades
Schools grade is shown separately in the Schools card above.
Census & demographics
- Census place
- California, MD
- County
- Saint Marys County · 48,152 people
- City population
- 14,212
- Metro
- California-Lexington Park, MD
- Population (ZIP)
- 14,212
- Household income
- $119,432
- Rent vs Own
- Severe rent burden
- 357.0
Population outlook (St. Mary's County) Hauer SSP2
- Today (2025)
- 123,125 people
- By 2030
- 128,374 · +4.3%
- By 2040
- 137,305 · +11.5%
- By 2050
- 143,065 · +16.2%
- By 2075
- 153,408 · +24.6%
- By 2100
- 151,790 · +23.3%
Race, ethnicity, and origin ACS 2023
- Neighborhood character
- Predominantly White (68%)
- Race & ethnicity
- White 68% Black 13% Hispanic / Latino 10% Two or more races 6% Asian 5%
- Hispanic origin (detail)
- Mexican 5%
- Common ancestry
- Slovak 3% Iranian 3% Italian 3%
- Foreign-born
- 7% · Canada, Jamaica, Vietnam
- Languages at home
- 90% English-only · Spanish 5% Chinese 1% Tagalog/Filipino 1%
Political lean MEDSL · St. Mary's
- 2024 margin
- R (+17.2) · D 40.2% · R 57.4% · Other 2.4%
- 2008→2024 swing
- -4.4pp toward R · 2008: -12.8pp · 2024: -17.2pp
- All cycles
- 2024: R+17.2 2020: R+13.8 2016: R+24.6 2012: R+16.1 2008: R+12.8
Not yet ingested
- Civics
- —
Market trends
- HPI YoY
- ▲ 2.30%
- Current HPI
- 239.4326
- Rent YoY
- ▲ 6.73%
- Metro
- California-Lexington Park, MD
- State GDP YoY
- ▲ 2.97%
- F500 in state
- 12
Industry mix (Fortune 500 HQ in MD)
| Industry | F500 HQs | Revenue |
|---|---|---|
| Aerospace / Defense | 1 | $71B |
|
||
| Utilities | 1 | $25B |
|
||
| Hotels | 1 | $24B |
|
||
| Consumer Goods | 1 | $7B |
|
||
| Real Estate | 1 | $6B |
|
||
| Chemicals | 1 | $2B |
|
||
Price history
+237.2% since first listed21 events — show timeline
- 2026-05-01 Pending — BRIGHT MLS
- 2026-04-06 Listed $284,900 BRIGHT MLS
- 2023-05-10 Sold (Public Records) $245,000 Public Records
- 2023-04-27 Sold (MLS) $245,000 BRIGHT MLS
- 2023-02-27 Contingent — BRIGHT MLS
- 2023-01-31 Listing Removed — BRIGHT MLS
- 2023-01-31 Listed $245,000 BRIGHT MLS
- 2022-11-18 Price Changed $249,900 BRIGHT MLS
- 2022-10-14 Listed $250,000 BRIGHT MLS
- 2019-02-22 Sold (MLS) $54,900 BRIGHT MLS
- 2019-01-23 Pending — BRIGHT MLS
- 2019-01-15 Listed $54,900 BRIGHT MLS
- 2007-06-27 Sold (Public Records) $182,000 Public Records
- 2006-09-01 Sold (MLS) $182,000 MRIS
- 2006-08-18 Delisted — MRIS
- 2006-06-12 Listed $184,000 MRIS
- 1998-08-13 Sold (Public Records) $87,500 Public Records
- 1998-08-11 Sold (MLS) $87,500 MRIS
- 1998-07-05 Delisted — MRIS
- 1996-09-24 Listed $84,900 MRIS
- 1993-12-08 Sold (Public Records) $84,500 Public Records
Property tax history
+4.2%/yrLatest (2025): $2,242 · +21.8% YoY. Source: county tax records.
Cash-flow waterfall
monthlySold comps — $/sqft
last 12 mo · ≤1 miLoading sold comps…