921 Evans St · Bonham, TX
Flood risk 1/10 · Minimal
- FEMA flood zone
- X (unshaded)
- Chance of flooding over 30 yrs
- 0.0%
- Est. flood insurance / yr
- $507 – $1,088
Fire risk 7/10 · Major
- Est. fire insurance / yr
- $1,222 – $2,270
Heat risk 7/10 · Major
- Hot days now (above 111°F)
- 7 days/yr
- Hot days in 30 yrs
- 22 days/yr
Wind risk 6/10 · Moderate
- Chance of severe wind over 30 yrs
- 27.0%
Air-quality risk 2/10 · Minimal
- Unhealthy air days now
- 1 days/yr
- Unhealthy air days in 30 yrs
- 1 days/yr
Risk factors via First Street. Map © Google.
Why this score? — see what drove the D grade
The composite is a weighted blend of 9 inputs, each scored 0–100. Each bar is that input's sub-score; the figure is the points it added to the 100-point composite (weight × sub-score).
- ARV discount +14.7/15.0
- Cash flow +9.8/30.0
- 1% rule +3.5/10.0
- Schools +3.2/10.0
- Livability +3.2/5.0
- DSCR +2.8/10.0
- Rent growth +2.5/5.0
- Condition / age +2.5/5.0
- Appreciation +0.0/10.0
$185,000
🖨 Deal sheet (PDF) 📄 Offer letter ✓ Due diligence
Listing remarks MLS
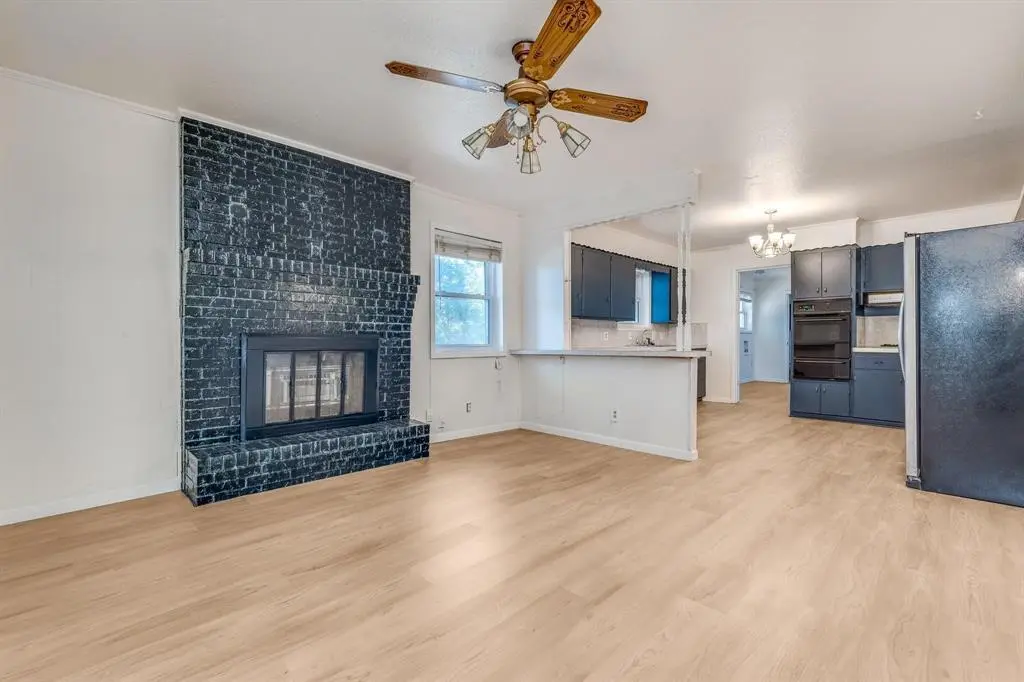
Welcome! This freshly renovated 4-bedroom, 3-bathroom home spans 1,669 sq. ft. and is perfect for those seeking space and comfort. Recently updated with a new coat of paint and all-new flooring, this home offers a bright and modern feel throughout while keeping the timeless original details. The cozy living area features a charming brick, wood-burning fireplace, ideal for relaxing evenings. The kitchen provides ample storage and updated appliances, making it both functional and stylish. Situated on a generous 0.4-acre corner lot, this property boasts a massive backyard, ideal for gardening, entertaining, or just enjoying outdoor activities. The full-size storm shelter adds peace of mind, providing safety during severe weather. Additional outdoor amenities include a covered porch perfect for morning coffee, two-car garage, two-car carport and a durable metal roof designed for longevity and low maintenance. Foundation was repaired in September 2024. Located within walking distance to local schools and nearby amenities, this home offers the convenience of small-town living with easy access to shops, parks, and major highways. Whether you are looking for a family home or a quiet retreat, this property provides the perfect blend of comfort, safety, and charm. With its spacious layout and thoughtful updates, home is move-in ready and waiting to welcome its next owners. Don’t miss out on this fantastic opportunity to own a well-maintained and updated home in the heart of Bonham, TX. Schedule your showing today!
Key facts
- Updated appliances
- New coat of paint
- Massive backyard
Tags
Neighborhood map
What this means for you Summary
Snapshot
- This is a 4-bed/3.0-bath single-family listed at $185k.
Deal economics
- At list price, monthly cash flow is $-120 ($-1k/yr) — negative.
- To cash-flow at today's rent, offer at most $164k (11.5% below list).
- To meet the 1% rule (rent ≥ 1% of price), the offer needs to be $158k (14.5% below list).
- Recommended offer: $158k (14.5% below list) — sets the bar for 1% rule.
- Cap rate 5.5% vs local median 3.2% in Bonham — top-decile yield for the area; either an underpriced asset or a hidden risk that comps aren't pricing in. Stress-test before assuming the spread holds.
Location & tenants
- Location reads 64/100 on livability (#785 in TX) — a middle-class / working-renter tenant base. Strengths: crime A+, cost of living A+, housing A+; Watch: employment D, amenities F, commute F.
- Bonham ISD (town): math 37% / reading 38% proficiency, ranked #477 of 826 in TX (top 58%) — families likely to look elsewhere, expect single-tenant / working-renter base with shorter leases.
- Zoned schools: Finley-Oates El (math 17% / reading 32%, grade F, #3,052 of 4,322 statewide, top 74%, 533 students, 73% FRL); Evans El (math 41% / reading 33%, grade F, #756 of 1,662 statewide, top 47%, 374 students, 69% FRL); Bonham H S (math 37% / reading 32%, grade F, #963 of 1,632 statewide, top 61%, 548 students, 59% FRL).
- Market conditions: 278 active listings in the ZIP; 12 comparable units currently listed for rent nearby; rentals lingering (median 46d on market — plan ~5-8 weeks vacancy on turnover, expect pricing pressure); 83% of comp listings sitting > 30 days — soft ceiling on asking rent; 82 units permitted in Fannin County in 2024 (0 in 5+ unit buildings).
Forward outlook
- Local home prices are declining (-3.0%/yr); year-one equity from $1k of loan paydown is wiped out by about $6k of value loss. Plan a longer hold.
- Fannin County population projected to shrink 6% by 2050 — rents likely to lag national; underwrite the cash flow, not the appreciation.
Negotiation context
- It's been on market 165 days — a 12% lower offer ($163k) is reasonable based on typical stale-listing flexibility.
- 9 sale attempts since 10y ago; this cycle's ask is 10037% above the opening price — seller raised mid-cycle; expect resistance to lowballs.
Risks & watch-outs
- Climate carrying-cost: major wind risk, 27% chance of damaging wind over 30y; major wildfire risk; extreme-heat days projected 7→22/yr by 2055 (HVAC capex compounding) — expect insurance premiums to compound above CPI over the hold.
Questions for the listing agent
- What do current leases actually rent for vs. the listed asking? Can we see a recent rent roll and the last 12 months of T-12 income?
- It's been on market 165 days. Have you received any prior offers? Is the seller open to a 15% concession, seller financing, or rate buy-down credit?
- Built in 1965 — when were the roof, HVAC, electrical panel, plumbing, and water heater last replaced?
- Why hasn't it sold? Are there any deal-killer items the seller is aware of (foundation, flood, title, zoning, code violations)?
- Is there a deadline driving the sale (1031 exchange, divorce, estate, relocation)? That informs how much negotiation room exists.
- Schools are D-rated, which usually means shorter tenancies and higher turnover. Who's the typical renter profile here, and what's been the actual vacancy rate?
- The area grade is low — what's the realistic commute time and amenity access for the typical tenant pool here? Any planned neighborhood developments (good or bad) we should know about?
- What's the average days-on-market for RENTAL listings here right now (not sales)? A rising rental-DOM trend means longer vacancies and softer asking-rent achievability than the comps imply.
- What's the recent tenant-quality profile in this submarket — average credit score on applications, eviction rate, late-payment / NSF rate, and stable-employment percentage? A property-management company in the area should have these aggregated.
- How much new for-sale + rental construction is in the pipeline within 1–3 miles? Heavy new supply typically softens prices + rents 12–24 months out; constrained supply supports both.
Investment metrics
- 1% rule
- 0.85% ✗
- Cap rate
- 5.51%
- Cash-on-cash
- -2.78%
- DSCR
- 0.88
- GRM
- 9.7
CMA / ARV
- ARV (median comp)
- $220,132
- List price
- $185,000
- Delta
- -15.96%
- Verdict
- UNDERPRICED
- Comps
- 20 within 1.0 mi
Show comp detail 10 sales within ~0.75 mi
| Address | Dist | Beds/Ba | Sqft | Sold | Price | $/sf | Match |
|---|---|---|---|---|---|---|---|
| 621 W 12th St | 0.32mi | 3/2.0 (-1) | 1,708 (+2%) | 6mo | $99,900 | $58 | 67 |
| 1016 Poplar St | 0.43mi | 3/2.5 (-1) | 1,680 (+1%) | 12mo | $169,900 | $101 | 62 |
| 1203 Evans St | 0.21mi | 3/2.0 (-1) | 1,656 (-1%) | 23mo | $60,000 | $36 | 61 |
| 608 W 6th St | 0.38mi | 3/2.0 (-1) | 1,699 (+2%) | 13mo | $185,000 | $109 | 59 |
| 903 W 8th St | 0.20mi | 3/2.0 (-1) | 1,456 (-13%) | 3mo | $145,000 | $100 | 58 |
| 816 W 11th St | 0.18mi | 3/2.0 (-1) | 1,489 (-11%) | 21mo | $249,900 | $168 | 47 |
| 707 Cedar St | 0.37mi | 3/2.0 (-1) | 1,494 (-10%) | 24mo | $153,000 | $102 | 36 |
| 1313 Franklin Ave | 0.61mi | 3/2.0 (-1) | 1,446 (-13%) | 9mo | $264,500 | $183 | 33 |
| 1308 Cedar St | 0.46mi | 3/2.0 (-1) | 1,453 (-13%) | 20mo | $275,000 | $189 | 31 |
| 321 W 6th St | 0.55mi | 3/1.0 (-1) | 1,846 (+11%) | 21mo | $55,500 | $30 | 26 |
Match score weights: distance 35% · size 25% · config 20% · recency 20%. Top-matched comps best support the ARV.
Projected returns pro-forma
-3.0% appreciation · 3.0% rent growth · sell at horizon
- IRR
- -20.9%
- Equity multiple
- 0.28×
- Total profit
- $-37,545
- Equity at exit
- $27,584
- IRR
- -14.1%
- Equity multiple
- 0.19×
- Total profit
- $-42,216
- Equity at exit
- $15,995
Cash invested: $51,800 (down + closing). Projections, not guarantees.
Landlord ↔ Tenant lean methodology
- Overall (STATE)
- 87 Strongly Landlord-Friendly
- State Texas
- 87 Strongly Landlord-Friendly · R+5
- County
- — inherits STATE
- City
- — inherits STATE
ZIP-level market 75418
- Home prices YoY
- -8.9%
- Active inventory
- 278
- Price-to-rent
- 9.7×
Monthly cashflow live
- Estimated rent
- $1,581 high interval (Pro) →
- Mortgage (P&I)
- −$970
- Tax from tax record
- −$322 /mo · $3,866/yr
- Insurance
- −$77
- HOA
- −$0
- Vacancy / Maint / Mgmt
- −$332
- Net cashflow
- $-120
Break-even live
Sensitivity live
| Price | -10% $-15 | -5% $-68 | +0% $-120 | +5% $-172 | +10% $-225 |
|---|---|---|---|---|---|
| Rent | -10% $-245 | -5% $-183 | +0% $-120 | +5% $-58 | +10% $5 |
| Rate | -1.0pp $-27 | -0.5pp $-73 | base $-120 | +0.5pp $-168 | +1.0pp $-217 |
UW: 25.0% down · 7.5% · 30yr · 1.5% tax · 5.0% vac · 8.0% maint · 8.0% mgmt
Financing live
Cash to close
- Down payment
- $46,250
- Closing costs
- $5,550
- Reserves months
- —
- Total cash needed
- —
Loan-product check · same deal, 3 products live
Conventional
25% down · 7.5% · 30yr
- Down + closing
- —
- Monthly P&I
- —
- Monthly cashflow
- —
- DSCR
- —
- Eligible?
- —
Personal DTI + credit; lowest rate.
DSCR
20% down · 8.5% · 30yr
- Down + closing
- —
- Monthly P&I
- —
- Monthly cashflow
- —
- DSCR
- —
- Eligible?
- —
No personal income docs; deal must DSCR.
Hard money
10% down · 12.0% · 12mo
- Down + closing
- —
- Monthly P&I
- —
- Monthly cashflow
- —
- DSCR
- —
- Eligible?
- —
Short-term bridge; refi at stabilization.
Rent comps 12 comps
| Address | Beds | Baths | Sqft | Rent | $/sqft | DOM | Units | Dist |
|---|---|---|---|---|---|---|---|---|
| 913 W 12th St Bonham, TX | 3.0 | 2.0 | 1355 | $1,700 | $1.25 | 45d | 1 | 0.19mi |
| 406 W 6th St Bonham, TX | 3.0 | 2.0 | 1198 | $1,350 | $1.13 | 45d | 1 | 0.52mi |
| 317 Jones St Bonham, TX | 3.0 | 2.0 | 1067 | $1,500 | $1.41 | 45d | 1 | 0.58mi |
| 805 S 6th St Unit 1 Bonham, TX | 3.0 | 2.5 | 1229 | $1,450 | $1.18 | 45d | 1 | 0.76mi |
| 406 S 6th St Unit 1 Bonham, TX | 3.0 | 2.0 | 1198 | $1,300 | $1.09 | 45d | 1 | 0.79mi |
| 412 E 7th St Unit 2 Bonham, TX | 3.0 | 2.5 | 1366 | $1,500 | $1.10 | 45d | 1 | 0.89mi |
| 224 E Boyd St Bonham, TX | 3.0 | 1.0 | 1196 | $1,245 | $1.04 | 45d | 1 | 1.03mi |
| 1014 Pine St Bonham, TX | 3.0 | 2.0 | 1200 | $1,475 | $1.23 | 45d | 1 | 1.03mi |
| 613 E 3rd St Bonham, TX | 3.0 | 2.0 | 1197 | $1,299 | $1.09 | 23d | 1 | 1.13mi |
| 608 E 3rd St Unit 2 Bonham, TX | 3.0 | 2.0 | 1197 | $1,295 | $1.08 | 45d | 1 | 1.14mi |
| 229 E Evans Ave Bonham, TX | 3.0 | 2.0 | 1090 | $1,264 | $1.16 | 45d | 1 | 1.16mi |
| 808 E 12th St Bonham, TX | 3.0 | 2.0 | 1234 | $1,595 | $1.29 | 20d | 1 | 1.19mi |
Listing history 50 events
-
2026-06-21days on market $185,000 Active 165 DOM
-
2026-06-19days on market $185,000 Active 163 DOM
-
2026-06-18days on market $185,000 Active 162 DOM
-
2026-06-17days on market $185,000 Active 161 DOM
-
2026-06-16days on market $185,000 Active 160 DOM
-
2026-06-15days on market $185,000 Active 159 DOM
-
2026-06-14days on market $185,000 Active 157 DOM
-
2026-06-12days on market $185,000 Active 156 DOM
-
2026-06-09days on market $185,000 Active 153 DOM
-
2026-06-08days on market $185,000 Active 152 DOM
-
2026-06-07days on market $185,000 Active 151 DOM
-
2026-06-05pricedays on market $185,000 Active 149 DOM
-
2026-06-04days on market $189,700 Active 147 DOM
-
2026-06-02days on market $189,700 Active 146 DOM
-
2026-06-01days on market $189,700 Active 145 DOM
-
2026-05-31days on market $189,700 Active 144 DOM
-
2026-05-31days on market $189,700 Active 143 DOM
-
2026-05-07$1,825
-
2026-05-01historical $1,825
-
2026-03-25$1,825
-
2026-03-25historical $1,825
-
2026-03-14$1,825
-
2026-03-14historical $1,825
-
2026-01-10$1,825
-
2026-01-07$189,700 Active 1541-char remark
Show marketing remark (1541 chars)
Welcome! This freshly renovated 4-bedroom, 3-bathroom home spans 1,669 sq. ft. and is perfect for those seeking space and comfort. Recently updated with a new coat of paint and all-new flooring, this home offers a bright and modern feel throughout while keeping the timeless original details. The cozy living area features a charming brick, wood-burning fireplace, ideal for relaxing evenings. The kitchen provides ample storage and updated appliances, making it both functional and stylish. Situated on a generous 0.4-acre corner lot, this property boasts a massive backyard, ideal for gardening, entertaining, or just enjoying outdoor activities. The full-size storm shelter adds peace of mind, providing safety during severe weather. Additional outdoor amenities include a covered porch perfect for morning coffee, two-car garage, two-car carport and a durable metal roof designed for longevity and low maintenance. Foundation was repaired in September 2024. Located within walking distance to local schools and nearby amenities, this home offers the convenience of small-town living with easy access to shops, parks, and major highways. Whether you are looking for a family home or a quiet retreat, this property provides the perfect blend of comfort, safety, and charm. With its spacious layout and thoughtful updates, home is move-in ready and waiting to welcome its next owners. Don’t miss out on this fantastic opportunity to own a well-maintained and updated home in the heart of Bonham, TX. Schedule your showing today!
-
2025-11-04historical
-
2025-10-16price $194,900
-
2025-07-11price $199,000
-
2025-04-10price $209,000
-
2025-03-20price $218,000
-
2025-01-30price $219,000
-
2025-01-10price $224,000
-
2024-12-20price $225,000
-
2024-10-18$229,000 Active
-
2024-08-12soldstatus
-
2024-08-12soldstatus
-
2018-11-26soldstatus
-
2018-11-21soldstatus Sold
-
2018-11-05status Pending
-
2018-10-14historical Active Option Contract
-
2018-09-14price $114,900
-
2018-09-14status Active
-
2018-09-05historical Active Option Contract
-
2018-08-22price $119,300
-
2018-05-29$124,900 Active
-
2016-10-17soldstatus
-
2016-10-14soldstatus Sold
-
2016-09-07status Pending
-
2016-08-20historical Active Option Contract
-
2016-06-25price $89,900
ⓘ Source: listings_history table (triggers on properties + properties_extension) + one-shot
backfill from property_details.listing_events for pre-trigger history.
Tax reassessment forecast TX · Resets to sale price
- Current annual tax
- $3,866 · $322/mo
- Projected year-2 tax
- $3,866 · $322/mo
- Expected delta
- $0/yr ($0/mo · 0.0%)
ⓘ Screening estimate from a state-policy table — verify with the county assessor before closing.
Climate risk First Street
- Flood 1/10 Low FEMA zone X (unshaded) · 0% chance over 30 yrs
- Wildfire 7/10 Severe
- Heat 7/10 Severe 7 d/yr ≥111°F today · 22 d/yr by 30 yrs out
- Wind 6/10 Major 27% chance of damaging wind over 30 yrs
- Air quality 2/10 Low 1 unhealthy d/yr today · 1 by 30 yrs out
Nearby sold comps map
Loading sold comps map…
Walkable amenities ~0.75 mi
Loading nearby amenities…
Taxation est. · year 1
- Rental income
- $18,978
- − Mortgage interest
- −$10,363
- − Property taxes
- −$3,866
- − Insurance
- −$925
- − Repairs & maintenance
- −$1,518
- − Management
- −$1,518
- − Depreciation
- −$5,382
- Taxable loss
- −$4,595
- Est. tax savings @ 24.0%
- +$1,103
- After-tax cash flow
- $-338/yr
For passive investors: Depreciation is non-cash, so a rental often shows a tax loss while cash-flowing — sheltering income. Rental losses are passive: they offset passive income freely, and up to $25,000/yr can offset ordinary (W-2) income if you actively participate and your MAGI is under $100k (phasing out to $0 by $150k); unused losses carry forward. On sale, claimed depreciation is recaptured at up to 25%, and gains may owe capital-gains tax (a 1031 exchange can defer both). Figures are a year-1 estimate at your 24.0% rate — not tax advice; consult a CPA.
Schools (NCES district)
- District
- Bonham ISD
- NCES district ID
- 4810800
- Math proficiency
- 37% ▼ -1.00%
- Reading proficiency
- 38% ▼ -2.00%
- Median HH income
- $41,740
- Composite
- 31.63/100
- National rank
- #5937
- State rank
- #477 of 826 in TX
Livability — Bonham
- Score
- 64/100
- State rank
- #785
- US rank
- #14360
Category grades
Schools grade is shown separately in the Schools card above.
Census & demographics
- Census place
- Bonham, TX
- County
- Fannin County · 15,155 people
- City population
- 15,155
- Metro
- Bonham, TX
- Population (ZIP)
- 15,155
- Household income
- $68,918
- Rent vs Own
- Severe rent burden
- 281.0
Population outlook (Fannin County) Hauer SSP2
- Today (2025)
- 33,423 people
- By 2030
- 33,035 · -1.2%
- By 2040
- 32,250 · -3.5%
- By 2050
- 31,462 · -5.9%
- By 2075
- 29,447 · -11.9%
- By 2100
- 25,459 · -23.8%
Race, ethnicity, and origin ACS 2023
- Neighborhood character
- Predominantly White (68%)
- Race & ethnicity
- White 68% Hispanic / Latino 17% Black 10% Two or more races 8%
- Hispanic origin (detail)
- Mexican 16%
- Common ancestry
- Lithuanian 3% Slovak 1% Italian 1%
- Foreign-born
- 7% · Canada, Philippines
- Languages at home
- 85% English-only · Spanish 14%
Political lean MEDSL · Fannin
- 2024 margin
- Solid R (+67.4) · D 15.9% · R 83.3%
- 2008→2024 swing
- -27.8pp toward R · 2008: -39.6pp · 2024: -67.4pp
- All cycles
- 2024: R+67.4 2020: R+63.4 2016: R+61.9 2012: R+52.5 2008: R+39.6
Not yet ingested
- Civics
- —
Market trends
- HPI YoY
- ▼ -25.59%
- Current HPI
- 262.7177
- Rent YoY
- —
- Metro
- Bonham, TX
- State GDP YoY
- ▲ 3.95%
- F500 in state
- 110
Industry mix (Fortune 500 HQ in TX)
| Industry | F500 HQs | Revenue |
|---|---|---|
| Energy | 16 | $1,198B |
|
||
| Technology | 5 | $198B |
|
||
| Engineering / Construction | 4 | $72B |
|
||
| Energy Services | 3 | $60B |
|
||
| Utilities | 3 | $41B |
|
||
| Healthcare | 2 | $330B |
|
||
Price history
-98.3% since first listed36 events — show timeline
- 2026-05-07 Listed for Rent $1,825 SHOWMOJO
- 2026-05-01 Rental Removed $1,825 NTREIS
- 2026-03-25 Listed for Rent $1,825 NTREIS
- 2026-03-25 Rental Removed $1,825 SHOWMOJO
- 2026-03-14 Listed for Rent $1,825 SHOWMOJO
- 2026-03-14 Rental Removed $1,825 NTREIS
- 2026-01-10 Listed for Rent $1,825 NTREIS
- 2026-01-07 Listed $189,700 NTREIS
- 2025-11-04 Listing Removed — NTREIS
- 2025-10-16 Price Changed $194,900 NTREIS
- 2025-07-11 Price Changed $199,000 NTREIS
- 2025-04-10 Price Changed $209,000 NTREIS
- 2025-03-20 Price Changed $218,000 NTREIS
- 2025-01-30 Price Changed $219,000 NTREIS
- 2025-01-10 Price Changed $224,000 NTREIS
- 2024-12-20 Price Changed $225,000 NTREIS
- 2024-10-18 Listed $229,000 NTREIS
- 2024-08-12 Sold (Public Records) — Public Records
- 2024-08-12 Sold (Public Records) — Public Records
- 2018-11-26 Sold (Public Records) — Public Records
- 2018-11-21 Sold (MLS) — NTREIS
- 2018-11-05 Pending — NTREIS
- 2018-10-14 Contingent — NTREIS
- 2018-09-14 Price Changed $114,900 NTREIS
- 2018-09-14 Relisted — NTREIS
- 2018-09-05 Contingent — NTREIS
- 2018-08-22 Price Changed $119,300 NTREIS
- 2018-05-29 Listed $124,900 NTREIS
- 2016-10-17 Sold (Public Records) — Public Records
- 2016-10-14 Sold (MLS) — NTREIS
- 2016-09-07 Pending — NTREIS
- 2016-08-20 Contingent — NTREIS
- 2016-06-25 Price Changed $89,900 NTREIS
- 2016-06-02 Price Changed $99,900 NTREIS
- 2016-02-01 Listed $109,900 NTREIS
- 1991-07-09 Sold (Public Records) — Public Records
Property tax history
+6.2%/yrLatest (2025): $3,866 · +20.4% YoY. Source: county tax records.
Cash-flow waterfall
monthlySold comps — $/sqft
last 12 mo · ≤1 miLoading sold comps…