 Duplex
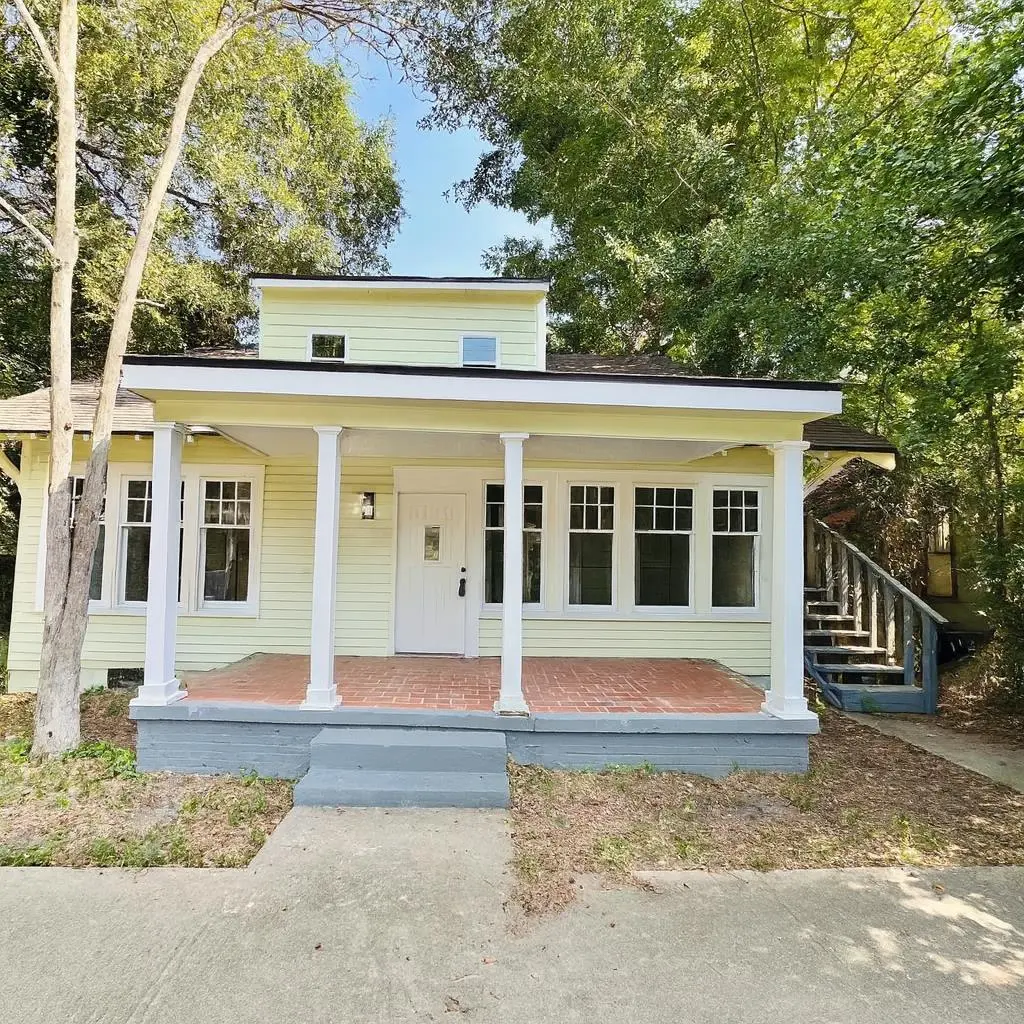
2207 Bell St · Columbus, GA
Flood risk 1/10 · Minimal
- FEMA flood zone
- X (unshaded)
- Chance of flooding over 30 yrs
- 0.0%
- Est. flood insurance / yr
- $507 – $1,088
Fire risk 1/10 · Minimal
- Est. fire insurance / yr
- $963 – $1,789
Heat risk 7/10 · Major
- Hot days now (above 107°F)
- 7 days/yr
- Hot days in 30 yrs
- 19 days/yr
Wind risk 6/10 · Moderate
- Chance of severe wind over 30 yrs
- 76.0%
Air-quality risk 5/10 · Moderate
- Unhealthy air days now
- 7 days/yr
- Unhealthy air days in 30 yrs
- 8 days/yr
Risk factors via First Street. Map © Google.
Why this score? — see what drove the D grade
The composite is a weighted blend of 9 inputs, each scored 0–100. Each bar is that input's sub-score; the figure is the points it added to the 100-point composite (weight × sub-score).
- Cash flow +13.9/30.0
- ARV discount +7.5/15.0
- DSCR +4.2/10.0
- Rent growth +3.7/5.0
- 1% rule +3.3/10.0
- Livability +3.2/5.0
- Condition / age +2.5/5.0
- Schools +2.2/10.0
- Appreciation +0.0/10.0
$204,900
🖨 Deal sheet 📄 Offer letter ✓ Due diligence
Multi-family units
County records classify this as Multi-Family (2-4 Unit). Listing-text estimate: 2 units. confirmed
Listing remarks MLS
Conveniently located close to town. The duplex has 3 bedrooms 1 bath on Main level and exterior access to upstairs Which has 1 bed and one bath with a small kitchen. Email is best communication for listing agent. Thanks
Key facts
- Renovated duplex
- New hvac systems
- New appliances
Tags
Property features AI
Exterior
- Utilities: Public water; Public sewer
- Home design: Duplex (residential income property)
- Exterior features: Level lot
Interior
- Flooring: Hardwood
- Heating & cooling: Central air; Forced air heating
- Interior features: Hardwood flooring; Central air conditioning; Forced air heating
Neighborhood map
What this means for you Summary
Snapshot
- This is a 1×2bd/1ba + 1×1bd/1ba units multifamily listed at $205k.
Deal economics
- At list price, monthly cash flow is $23 ($276/yr) — positive. Per door: $12/mo.
- The deal already cash-flows at list — no discount required.
- To meet the 1% rule (rent ≥ 1% of price), the offer needs to be $171k (16.7% below list).
- Recommended offer: $171k (16.7% below list) — sets the bar for 1% rule.
- Cap rate 6.4% vs local median 4.7% in Columbus — top-decile yield for the area; either an underpriced asset or a hidden risk that comps aren't pricing in. Stress-test before assuming the spread holds.
Location & tenants
- Location reads 64/100 on livability (#254 in GA) — a middle-class / working-renter tenant base. Strengths: cost of living A+, housing A+, health & safety B; Watch: amenities D+, schools F, crime F.
- Muscogee County (urban): math 21% / reading 30% proficiency, ranked #120 of 174 in GA (top 69%) — low school quality limits family demand, transient renter base, plan for 1-2y turnover; 61% free/reduced lunch — lower-income household profile, screen leases tightly.
- Market conditions: Rents rising fast (+4.8%/yr); 118 active listings in the ZIP; 16 comparable units currently listed for rent nearby; rentals at typical pace (median 21d on market — plan ~3-4 weeks tenant-placement turnaround); lower-income renter base — watch delinquency; 291 units permitted in Muscogee County in 2024 (30 in 5+ unit buildings).
- At $1,706/mo this rent would consume 46% of the median local household income ($45k/yr) (locally 1003% of renters already pay >50% of income on rent) — very limited rent-growth headroom before tenants either downsize or default.
Forward outlook
- Local home prices are declining (-3.0%/yr); year-one equity from $1k of loan paydown is wiped out by about $6k of value loss. Plan a longer hold.
- Muscogee County population projected at +15% by 2050 — modest demand growth; plan on rents tracking national, not racing it.
Negotiation context
- Only 14 days on market — expect competitive offers; lowballing is unlikely to land.
- 4 sale attempts since 3y ago with the ask held roughly flat each time — persistent listings suggest the price (not the market) is what's stuck; bring a comps-based counter.
- Current owner paid $65k; list at $205k implies a 215% gain — meaningful room to come down on a strong offer.
Risks & watch-outs
- Watch-outs: built in 1933 — expect roof / HVAC / electrical / plumbing capex.
- Climate carrying-cost: major wind risk, 76% chance of damaging wind over 30y; extreme-heat days projected 7→19/yr by 2055 (HVAC capex compounding) — expect insurance premiums to compound above CPI over the hold.
Questions for the listing agent
- Can we see the unit-by-unit rent roll, current vacancy, and any below-market leases? What's the average tenancy length?
- What capital expenditures (roof, boiler, parking lot, exteriors) have been made in the last 5 years, and what's planned in the next 2?
- Built in 1933 — when were the roof, HVAC, electrical panel, plumbing, and water heater last replaced?
- Is there a deadline driving the sale (1031 exchange, divorce, estate, relocation)? That informs how much negotiation room exists.
- Schools are F-rated, which usually means shorter tenancies and higher turnover. Who's the typical renter profile here, and what's been the actual vacancy rate?
- Crime grade is F in this area — have there been break-ins, vandalism, or insurance claims at this property in the last 3 years? What carrier currently insures it and at what premium?
- The area grade is low — what's the realistic commute time and amenity access for the typical tenant pool here? Any planned neighborhood developments (good or bad) we should know about?
- What's the average days-on-market for RENTAL listings here right now (not sales)? A rising rental-DOM trend means longer vacancies and softer asking-rent achievability than the comps imply.
- What's the recent tenant-quality profile in this submarket — average credit score on applications, eviction rate, late-payment / NSF rate, and stable-employment percentage? A property-management company in the area should have these aggregated.
- How much new apartment / multifamily construction is in the pipeline within 1–3 miles? Heavy new supply (>2% of stock underway) typically softens rents 12–24 months out; light construction supports rent growth.
Investment metrics
- 1% rule
- 0.83% ✗
- Cap rate
- 6.43%
- Cash-on-cash
- 0.48%
- DSCR
- 1.02
- GRM
- 10.0
CMA / ARV
No comps found within radius.
Projected returns pro-forma
-3.0% appreciation · 4.82% rent growth · sell at horizon
- IRR
- -13.7%
- Equity multiple
- 0.50×
- Total profit
- $-28,585
- Equity at exit
- $30,551
- IRR
- -2.3%
- Equity multiple
- 0.83×
- Total profit
- $-9,580
- Equity at exit
- $17,716
Cash invested: $57,372 (down + closing). Projections, not guarantees.
Landlord ↔ Tenant lean methodology
- Overall (STATE)
- 90 Strongly Landlord-Friendly
- State Georgia
- 90 Strongly Landlord-Friendly · R+3
- County
- — inherits STATE
- City
- — inherits STATE
ZIP-level market 31906
- Rents YoY
- 4.8%
- Active inventory
- 118
- Price-to-rent
- 19.5×
Monthly cashflow live
- Estimated rent
- $1,706 high interval (Pro) →
- Mortgage (P&I)
- −$1,075
- Tax from tax record
- −$165 /mo · $1,978/yr
- Insurance
- −$85
- HOA
- −$0
- Vacancy / Maint / Mgmt
- −$358
- Net cashflow
- $23
Break-even live
2-unit breakdown (identical units grouped — click to expand)
| Units | Beds | Baths | Est. rent |
|---|---|---|---|
| 1× unit | 2 | 1 | $877 |
| 1× unit | 1 | 1 | $828 |
| Total (2 units) | $1,706 | ||
UW: 25.0% down · 7.5% · 30yr · 1.5% tax · 5.0% vac · 8.0% maint · 8.0% mgmt
Financing live
Cash to close
- Down payment
- $51,225
- Closing costs
- $6,147
- Reserves months
- —
- Total cash needed
- —
Loan-product check · same deal, 3 products live
Conventional
25% down · 7.5% · 30yr
- Down + closing
- —
- Monthly P&I
- —
- Monthly cashflow
- —
- DSCR
- —
- Eligible?
- —
Personal DTI + credit; lowest rate.
DSCR
20% down · 8.5% · 30yr
- Down + closing
- —
- Monthly P&I
- —
- Monthly cashflow
- —
- DSCR
- —
- Eligible?
- —
No personal income docs; deal must DSCR.
Hard money
10% down · 12.0% · 12mo
- Down + closing
- —
- Monthly P&I
- —
- Monthly cashflow
- —
- DSCR
- —
- Eligible?
- —
Short-term bridge; refi at stabilization.
Rent comps 16 comps
| Address | Beds | Baths | Sqft | Rent | $/sqft | DOM | Units | Dist |
|---|---|---|---|---|---|---|---|---|
| 1111 Henry Ave Columbus, GA | 3.0 | 2.0 | 1407 | $1,200 | $0.85 | 43d | 1 | 0.11mi |
| 2309 Willard St Columbus, GA | 3.0 | 2.0 | 1803 | $1,700 | $0.94 | 13d | 1 | 0.34mi |
| 1192 Munro Ave Columbus, GA | 3.0 | 2.0 | 1711 | $1,750 | $1.02 | 43d | 1 | 0.35mi |
| 2750 Mimosa St Columbus, GA | 3.0 | 1.5 | 1357 | $1,250 | $0.92 | 13d | 1 | 0.63mi |
| 2944 10th St Columbus, GA | 3.0 | 1.0 | 1550 | $925 | $0.60 | 13d | 1 | 0.69mi |
| 2834 Mimosa St Columbus, GA | 3.0 | 1.5 | 1257 | $1,100 | $0.88 | 43d | 1 | 0.71mi |
| 1097 Bolton Ct Columbus, GA | 3.0 | 2.5 | 2127 | $1,350 | $0.63 | 21d | 1 | 0.77mi |
| 564 Chesterfield Ave Columbus, GA | 3.0 | 2.0 | 1230 | $1,100 | $0.89 | 21d | 1 | 0.80mi |
| 1401 Coffee Ct Columbus, GA | 4.0 | 1.0 | 1444 | $1,250 | $0.87 | 21d | 1 | 0.85mi |
| 1706 Wells Dr Columbus, GA | 3.0 | 2.0 | 1990 | $1,850 | $0.93 | 13d | 1 | 0.91mi |
| 3122 Baldwin St Columbus, GA | 5.0 | 2.0 | 1780 | $1,500 | $0.84 | 21d | 1 | 0.92mi |
| 1908 Garrard St Columbus, GA | 4.0 | 2.0 | 1716 | $1,600 | $0.93 | 21d | 1 | 1.14mi |
| 3500 Ruben St Columbus, GA | 4.0 | 3.0 | 2045 | $1,295 | $0.63 | 13d | 1 | 1.19mi |
| 1503 11th Ave Columbus, GA | 3.0 | 2.0 | 1370 | $1,200 | $0.88 | 13d | 1 | 1.22mi |
| 1400 Boxwood Blvd Columbus, GA | 2.0–3.0 | 2.0 | 1262 | $1,355 | $1.07 | 13d | 6 | 1.36mi |
| 2602 Garden Dr Columbus, GA | 3.0 | 2.0 | 1250 | $1,175 | $0.94 | 21d | 1 | 1.36mi |
Listing history 12 events
-
2026-06-18days on market $204,900 Active 14 DOM
-
2026-06-17days on market $204,900 Active 13 DOM
-
2026-06-16days on market $204,900 Active 12 DOM
-
2026-06-15days on market $204,900 Active 11 DOM
-
2026-06-14days on market $204,900 Active 9 DOM
-
2026-06-13days on market $204,900 Active 8 DOM
-
2026-06-10days on market $204,900 Active 6 DOM
-
2026-06-09days on market $204,900 Active 5 DOM
-
2026-06-08days on market $204,900 Active 4 DOM
-
2026-06-07days on market $204,900 Active 3 DOM
-
2026-06-05remarks 641-char remark
-
2026-06-05$204,900 Active 1 DOM
ⓘ Source: listings_history table (triggers on properties + properties_extension) + one-shot
backfill from property_details.listing_events for pre-trigger history.
Tax reassessment forecast GA · Resets to sale price
- Current annual tax
- $1,978 · $165/mo
- Projected year-2 tax
- $1,978 · $165/mo
- Expected delta
- $0/yr ($0/mo · 0.0%)
ⓘ Screening estimate from a state-policy table — verify with the county assessor before closing.
Climate risk First Street
- Flood 1/10 Low FEMA zone X (unshaded) · 0% chance over 30 yrs
- Wildfire 1/10 Low
- Heat 7/10 Severe 7 d/yr ≥107°F today · 19 d/yr by 30 yrs out
- Wind 6/10 Major 76% chance of damaging wind over 30 yrs
- Air quality 5/10 Major 7 unhealthy d/yr today · 8 by 30 yrs out
Nearby sold comps map
Loading sold comps map…
Walkable amenities ~0.75 mi
Loading nearby amenities…
Taxation est. · year 1
- Rental income
- $20,472
- − Mortgage interest
- −$11,478
- − Property taxes
- −$1,978
- − Insurance
- −$1,024
- − Repairs & maintenance
- −$1,638
- − Management
- −$1,638
- − Depreciation
- −$5,961
- Taxable loss
- −$3,244
- Est. tax savings @ 24.0%
- +$779
- After-tax cash flow
- $1,055/yr
For passive investors: Depreciation is non-cash, so a rental often shows a tax loss while cash-flowing — sheltering income. Rental losses are passive: they offset passive income freely, and up to $25,000/yr can offset ordinary (W-2) income if you actively participate and your MAGI is under $100k (phasing out to $0 by $150k); unused losses carry forward. On sale, claimed depreciation is recaptured at up to 25%, and gains may owe capital-gains tax (a 1031 exchange can defer both). Figures are a year-1 estimate at your 24.0% rate — not tax advice; consult a CPA.
Schools (NCES district)
- District
- Muscogee County
- NCES district ID
- 1303870
- Math proficiency
- 21% ▼ -11.00%
- Reading proficiency
- 30% ▼ -7.00%
- Median HH income
- $41,176
- Composite
- 21.6/100
- National rank
- #8297
- State rank
- #120 of 174 in GA
Livability — Columbus
- Score
- 64/100
- State rank
- #254
- US rank
- #14102
Category grades
Schools grade is shown separately in the Schools card above.
Census & demographics
- Census place
- Columbus, GA
- County
- Muscogee County · 180,764 people
- City population
- 180,764
- Metro
- Columbus, GA-AL
- Population (ZIP)
- 20,400
- Household income
- $44,965
- Rent vs Own
- Severe rent burden
- 1003.0
Population outlook (Muscogee County) Hauer SSP2
- Today (2025)
- 216,729 people
- By 2030
- 224,504 · +3.6%
- By 2040
- 238,318 · +10.0%
- By 2050
- 249,027 · +14.9%
- By 2075
- 264,862 · +22.2%
- By 2100
- 254,786 · +17.6%
Race, ethnicity, and origin ACS 2023
- Neighborhood character
- Majority Black (64%)
- Race & ethnicity
- Black 64% White 28% Hispanic / Latino 4% Two or more races 3% Asian 1%
- Common ancestry
- Slovak 1% Lithuanian 1% Hispanic 1%
- Foreign-born
- 3% · Canada
- Languages at home
- 95% English-only · Spanish 3% Other Indo-European 1%
Political lean MEDSL · Muscogee
- 2024 margin
- Strong D (+23.4) · D 61.4% · R 38.0%
- 2008→2024 swing
- +3.7pp toward D · 2008: 19.7pp · 2024: 23.4pp
- All cycles
- 2024: D+23.4 2020: D+24.0 2016: D+18.6 2012: D+21.3 2008: D+19.7
Not yet ingested
- Civics
- —
Market trends
- HPI YoY
- ▼ -122.49%
- Current HPI
- 113.2749
- Rent YoY
- ▲ 4.82%
- Metro
- Columbus, GA-AL
- State GDP YoY
- ▲ 2.66%
- F500 in state
- 28
Industry mix (Fortune 500 HQ in GA)
| Industry | F500 HQs | Revenue |
|---|---|---|
| Paper / Packaging | 2 | $29B |
|
||
| Retail | 1 | $160B |
|
||
| Transportation / Logistics | 1 | $91B |
|
||
| Airlines | 1 | $62B |
|
||
| Consumer Goods | 1 | $47B |
|
||
| Utilities | 1 | $25B |
|
||
Price history
+360.4% since first listed19 events — show timeline
- 2026-06-04 Listed $204,900 CBOR
- 2025-04-19 Sold (MLS) $65,000 CBOR
- 2025-03-01 Pending — CBOR
- 2025-02-13 Listed $66,850 CBOR
- 2023-12-31 Listing Removed — GAMLS
- 2023-10-15 Price Changed $128,000 CBOR
- 2023-10-15 Price Changed $128,000 GAMLS
- 2023-10-11 Price Changed $128,999 GAMLS
- 2023-10-11 Price Changed $128,999 CBOR
- 2023-08-24 Price Changed $130,000 CBOR
- 2023-08-24 Price Changed $130,000 GAMLS
- 2023-08-15 Price Changed $132,000 GAMLS
- 2023-07-26 Price Changed $135,000 CBOR
- 2023-07-26 Price Changed $135,000 GAMLS
- 2023-07-15 Relisted — GAMLS
- 2023-07-14 Pending — GAMLS
- 2023-05-28 Listed $140,000 GAMLS
- 2021-07-07 Sold (Public Records) $55,000 Public Records
- 2021-03-31 Sold (Public Records) $44,500 Public Records
Property tax history
+8.8%/yrLatest (2025): $1,978 · +0.0% YoY. Source: county tax records.
Cash-flow waterfall
monthlySold comps — $/sqft
last 12 mo · ≤1 miLoading sold comps…