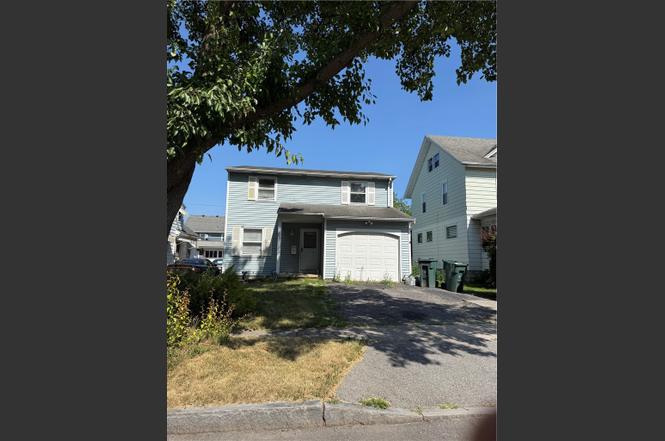
110 Canton St · Rochester, NY
Flood risk 1/10 · Minimal
- FEMA flood zone
- X (unshaded)
- Chance of flooding over 30 yrs
- 0.0%
- Est. flood insurance / yr
- $473 – $860
Fire risk 1/10 · Minimal
- Est. fire insurance / yr
- $691 – $1,283
Heat risk 2/10 · Minimal
- Hot days now (above 96°F)
- 7 days/yr
- Hot days in 30 yrs
- 15 days/yr
Wind risk 1/10 · Minimal
- Chance of severe wind over 30 yrs
- —
Air-quality risk 2/10 · Minimal
- Unhealthy air days now
- 1 days/yr
- Unhealthy air days in 30 yrs
- 2 days/yr
Risk factors via First Street. Map © Google.
Why this score? — see what drove the B+ grade
The composite is a weighted blend of 9 inputs, each scored 0–100. Each bar is that input's sub-score; the figure is the points it added to the 100-point composite (weight × sub-score).
- Cash flow +30.0/30.0
- ARV discount +15.0/15.0
- 1% rule +10.0/10.0
- DSCR +10.0/10.0
- Rent growth +4.1/5.0
- Livability +3.8/5.0
- Condition / age +2.5/5.0
- Schools +1.9/10.0
- Appreciation +0.0/10.0
$100,000
🖨 Deal sheet 📄 Offer letter ✓ Due diligence
Listing remarks
Welcome to a spacious home full of potential, nestled on a quiet street in the heart of the city. This property offers a smart and functional layout with generously sized rooms, natural light throughout, and a great flow for everyday living The interior features a large living room, formal dining area, and a well-proportioned kitchen that can easily be updated to your taste. Upstairs you’ll find well-sized bedrooms and a full bath. The home needs rehab with some work it can truly shine. Whether you’re an investor looking for your next project or a homeowner ready to make it your own, this is a solid home with great bones and a beautiful layout. Don’t miss this opportunity.
Key facts
- 3,848 sq ft lot
- Garage
- Built 1986
Neighborhood map
What this means for you Summary
Snapshot
- This is a 3-bed/1.5-bath single-family listed at $100k.
Deal economics
- At list price, monthly cash flow is $522 ($6k/yr) — positive.
- The deal already cash-flows at list — no discount required.
- Meets the 1% rule at list price ($2k rent vs $100k).
- Cap rate 12.6% vs local median 9.3% in Rochester — top-decile yield for the area; either an underpriced asset or a hidden risk that comps aren't pricing in. Stress-test before assuming the spread holds.
Location & tenants
- Location reads 76/100 on livability (#222 in NY, #3,482 nationally) — a middle-class / working-renter tenant base. Strengths: commute A+, cost of living A+, housing A+; Watch: schools D+, crime F, employment F.
- Rochester City School District (urban): math 21% / reading 26% proficiency, ranked #589 of 590 in NY (top 100%) — low school quality limits family demand, transient renter base, plan for 1-2y turnover; 82% free/reduced lunch — lower-income household profile, screen leases tightly.
- Market conditions: Rents rising fast (+6.3%/yr); 124 active listings in the ZIP; 19 comparable units currently listed for rent nearby; rentals at typical pace (median 19d on market — plan ~3-4 weeks tenant-placement turnaround); 1,169 units permitted in Monroe County in 2024 (591 in 5+ unit buildings).
- This rent runs 32% of the median local income ($56k/yr) — at the standard rent-burdened threshold; future hikes will face affordability resistance.
Forward outlook
- Local home prices are declining (-3.0%/yr); year-one equity from $691 of loan paydown is wiped out by about $3k of value loss. Plan a longer hold.
- Monroe County population projected to shrink 6% by 2050 — rents likely to lag national; underwrite the cash flow, not the appreciation.
- At projected returns (-3.0% appreciation + 6.3% rent growth), your $28k cash investment doubles in ~5 years — after that, you're playing with house money.
Negotiation context
- Only 6 days on market — expect competitive offers; lowballing is unlikely to land.
- 2 sale attempts; this cycle's ask is 11% above the opening price — seller raised mid-cycle; expect resistance to lowballs.
- Current owner paid $73k; 37% above their basis — modest negotiation headroom, anchor on the comps not their cost.
Questions for the listing agent
- Is there a deadline driving the sale (1031 exchange, divorce, estate, relocation)? That informs how much negotiation room exists.
- Schools are D-rated, which usually means shorter tenancies and higher turnover. Who's the typical renter profile here, and what's been the actual vacancy rate?
- Crime grade is F in this area — have there been break-ins, vandalism, or insurance claims at this property in the last 3 years? What carrier currently insures it and at what premium?
- What's the average days-on-market for RENTAL listings here right now (not sales)? A rising rental-DOM trend means longer vacancies and softer asking-rent achievability than the comps imply.
- What's the recent tenant-quality profile in this submarket — average credit score on applications, eviction rate, late-payment / NSF rate, and stable-employment percentage? A property-management company in the area should have these aggregated.
- How much new for-sale + rental construction is in the pipeline within 1–3 miles? Heavy new supply typically softens prices + rents 12–24 months out; constrained supply supports both.
Investment metrics
- 1% rule
- 1.51% ✓
- Cap rate
- 12.55%
- Cash-on-cash
- 22.36%
- DSCR
- 1.99
- GRM
- 5.5
CMA / ARV
- ARV (on-the-fly)
- $122,400
- Comps found
- 12
Show comp detail 12 sales within ~0.75 mi
| Address | Dist | Beds/Ba | Sqft | Sold | Price | $/sf | Match |
|---|---|---|---|---|---|---|---|
| 301 Avery St | 0.23mi | 3/1.0 | 1,296 (-5%) | 1mo | $80,000 | $62 | 78 |
| 46 Rogers Ave | 0.33mi | 3/1.0 | 1,458 (+7%) | 3mo | $81,000 | $56 | 68 |
| 55 Santee St | 0.48mi | 3/1.5 | 1,272 (-6%) | 1mo | $124,900 | $98 | 66 |
| 78 Northampton St | 0.33mi | 2/1.5 (-1) | 1,200 (-12%) | 0mo | $209,000 | $174 | 60 |
| 91 Pool St | 0.45mi | 4/1.0 (+1) | 1,458 (+7%) | 1mo | $162,500 | $111 | 59 |
| 385 Hague St | 0.72mi | 4/1.0 (+1) | 1,365 (+0%) | 1mo | $120,000 | $88 | 58 |
| 64 Cameron St | 0.65mi | 3/1.5 | 1,440 (+6%) | 2mo | $68,000 | $47 | 58 |
| 42 Curtis St | 0.67mi | 3/1.5 | 1,287 (-5%) | 4mo | $85,000 | $66 | 57 |
| 61 Myrtle St | 0.55mi | 3/1.0 | 1,225 (-10%) | 2mo | $110,000 | $90 | 54 |
| 122 Dakota St | 0.53mi | 2/1.0 (-1) | 1,200 (-12%) | 3mo | $120,000 | $100 | 46 |
| 515 Emerson St | 0.59mi | 4/1.5 (+1) | 1,536 (+13%) | 4mo | $129,900 | $85 | 43 |
| 27 Rugraff St | 0.74mi | 3/1.0 | 1,200 (-12%) | 3mo | $123,000 | $103 | 41 |
Match score weights: distance 35% · size 25% · config 20% · recency 20%. Top-matched comps best support the ARV.
Projected returns pro-forma
-3.0% appreciation · 6.28% rent growth · sell at horizon
- IRR
- 18.8%
- Equity multiple
- 1.79×
- Total profit
- $22,171
- Equity at exit
- $14,910
- IRR
- 29.3%
- Equity multiple
- 4.03×
- Total profit
- $84,700
- Equity at exit
- $8,646
Cash invested: $28,000 (down + closing). Projections, not guarantees.
Landlord ↔ Tenant lean methodology
- Overall (STATE)
- 15 Strongly Tenant-Friendly
- State New York
- 15 Strongly Tenant-Friendly · D+10
- County
- — inherits STATE
- City
- — inherits STATE
ZIP-level market 14606
- Home prices YoY
- -17.9%
- Rents YoY
- 6.3%
- Active inventory
- 124
- Price-to-rent
- 5.5×
Monthly cashflow live
- Estimated rent
- $1,509 high interval (Pro) →
- Mortgage (P&I)
- −$524
- Tax from tax record
- −$104 /mo · $1,248/yr
- Insurance
- −$42
- HOA
- −$0
- Vacancy / Maint / Mgmt
- −$317
- Net cashflow
- $522
Break-even live
UW: 25.0% down · 7.5% · 30yr · 1.5% tax · 5.0% vac · 8.0% maint · 8.0% mgmt
Financing live
Cash to close
- Down payment
- $25,000
- Closing costs
- $3,000
- Reserves months
- —
- Total cash needed
- —
Loan-product check · same deal, 3 products live
Conventional
25% down · 7.5% · 30yr
- Down + closing
- —
- Monthly P&I
- —
- Monthly cashflow
- —
- DSCR
- —
- Eligible?
- —
Personal DTI + credit; lowest rate.
DSCR
20% down · 8.5% · 30yr
- Down + closing
- —
- Monthly P&I
- —
- Monthly cashflow
- —
- DSCR
- —
- Eligible?
- —
No personal income docs; deal must DSCR.
Hard money
10% down · 12.0% · 12mo
- Down + closing
- —
- Monthly P&I
- —
- Monthly cashflow
- —
- DSCR
- —
- Eligible?
- —
Short-term bridge; refi at stabilization.
Rent comps 19 comps
| Address | Beds | Baths | Sqft | Rent | $/sqft | DOM | Units | Dist |
|---|---|---|---|---|---|---|---|---|
| 108 Wetmore Park Rochester, NY | 3.0 | 2.0 | 1278 | $1,900 | $1.49 | 10d | 1 | 0.50mi |
| 25 Karnes St Rochester, NY | 2.0 | 1.0 | 1059 | $1,250 | $1.18 | 21d | 1 | 0.52mi |
| 85 Cameron St Unit B Rochester, NY | 3.0 | 1.0 | 1138 | $1,650 | $1.45 | 43d | 1 | 0.62mi |
| 69 Angle St Rochester, NY | 2.0 | 1.0 | 1500 | $1,500 | $1.00 | 14d | 1 | 0.71mi |
| 19 Garland Ave Rochester, NY | 3.0 | 1.0 | 1104 | $1,850 | $1.68 | 2d | 1 | 0.78mi |
| 385 Ames St Rochester, NY | 3.0 | 1.5 | 1738 | $1,500 | $0.86 | 21d | 1 | 0.79mi |
| 710-712 Jay St Unit 3 Rochester, NY | 2.0 | 1.0 | 1252 | $895 | $0.71 | 43d | 1 | 0.85mi |
| 257 Hague St Unit 257 Rochester, NY | 2.0 | 1.5 | 1080 | $1,500 | $1.39 | 43d | 1 | 0.89mi |
| 802 Maple St Rochester, NY | 2.0 | 1.5 | 1080 | $1,800 | $1.67 | 43d | 1 | 0.93mi |
| 629 Jay St Rochester, NY | 3.0 | 1.0 | 1193 | $1,250 | $1.05 | 19d | 1 | 0.96mi |
| 658 Smith St Rochester, NY | 2.0 | 1.0 | 981 | $1,500 | $1.53 | 3d | 1 | 1.12mi |
| 254 Lexington Ave Rochester, NY | 3.0 | 1.0 | 950 | $1,350 | $1.42 | 2d | 1 | 1.12mi |
| 84 Twin Beeches Rochester, NY | 2.0 | 1.5 | 1096 | $1,250 | $1.14 | 23d | 1 | 1.18mi |
| 89 Twin Beeches Rochester, NY | 2.0 | 1.5 | 1096 | $1,250 | $1.14 | 43d | 1 | 1.19mi |
| 48 Thorndale Ter Rochester, NY | 4.0 | 1.5 | 1700 | $1,400 | $0.82 | 14d | 1 | 1.35mi |
| 73 Somerset St Rochester, NY | 4.0 | 1.0 | 1000 | $1,750 | $1.75 | 43d | 1 | 1.39mi |
| 1097 Dewey Ave Unit B Rochester, NY | 2.0 | 1.0 | 1008 | $1,150 | $1.14 | 14d | 1 | 1.40mi |
| 136 Garfield St Rochester, NY | 3.0 | 1.0 | 1152 | $1,200 | $1.04 | 19d | 1 | 1.45mi |
| 161 Fillmore St Rochester, NY | 4.0 | 2.0 | 1612 | $1,400 | $0.87 | 14d | 1 | 1.49mi |
Listing history 8 events
-
2026-03-10status Pending
-
2026-03-09price $100,000
-
2026-03-03$90,000 Active
-
2025-07-31status Pending
-
2025-07-30historical
-
2025-07-23$90,000 Active
-
2006-07-20soldstatus $72,900
-
1998-10-23soldstatus $61,500
ⓘ Source: listings_history table (triggers on properties + properties_extension) + one-shot
backfill from property_details.listing_events for pre-trigger history.
Tax reassessment forecast NY · Partial reset (capped growth)
- Current annual tax
- $1,248 · $104/mo
- Projected year-2 tax
- $1,469 · $122/mo
- Expected delta
- +$221/yr (+$18/mo · 17.7%)
ⓘ Screening estimate from a state-policy table — verify with the county assessor before closing.
Climate risk First Street
- Flood 1/10 Low FEMA zone X (unshaded) · 0% chance over 30 yrs
- Wildfire 1/10 Low
- Heat 2/10 Low 7 d/yr ≥96°F today · 15 d/yr by 30 yrs out
- Wind 1/10 Low
- Air quality 2/10 Low 1 unhealthy d/yr today · 2 by 30 yrs out
Nearby sold comps map
Loading sold comps map…
Walkable amenities ~0.75 mi
Loading nearby amenities…
Taxation est. · year 1
- Rental income
- $18,102
- − Mortgage interest
- −$5,602
- − Property taxes
- −$1,248
- − Insurance
- −$500
- − Repairs & maintenance
- −$1,448
- − Management
- −$1,448
- − Depreciation
- −$2,909
- Taxable income
- $4,947
- Est. tax owed @ 24.0%
- −$1,187
- After-tax cash flow
- $5,072/yr
For passive investors: Depreciation is non-cash, so a rental often shows a tax loss while cash-flowing — sheltering income. Rental losses are passive: they offset passive income freely, and up to $25,000/yr can offset ordinary (W-2) income if you actively participate and your MAGI is under $100k (phasing out to $0 by $150k); unused losses carry forward. On sale, claimed depreciation is recaptured at up to 25%, and gains may owe capital-gains tax (a 1031 exchange can defer both). Figures are a year-1 estimate at your 24.0% rate — not tax advice; consult a CPA.
Schools (NCES district)
- District
- Rochester City School District
- NCES district ID
- 3624750
- Math proficiency
- 21% ▬ 0.00%
- Reading proficiency
- 26% ▲ 4.00%
- Median HH income
- $30,923
- Composite
- 18.98/100
- National rank
- #8850
- State rank
- #589 of 590 in NY
Livability — Rochester
- Score
- 76/100
- State rank
- #222
- US rank
- #3482
Category grades
Schools grade is shown separately in the Schools card above.
Census & demographics
- Census place
- Rochester, NY
- County
- Monroe County · 674,131 people
- City population
- 432,803
- Metro
- Rochester, NY
- Population (ZIP)
- 25,538
- Household income
- $55,807
- Rent vs Own
- Severe rent burden
- 986.0
Population outlook (Monroe County) Hauer SSP2
- Today (2025)
- 759,460 people
- By 2030
- 757,154 · -0.3%
- By 2040
- 740,644 · -2.5%
- By 2050
- 714,443 · -5.9%
- By 2075
- 645,883 · -15.0%
- By 2100
- 547,084 · -28.0%
Race, ethnicity, and origin ACS 2023
- Neighborhood character
- Diverse neighborhood (Simpson 0.64)
- Race & ethnicity
- White 51% Black 26% Hispanic / Latino 17% Two or more races 8% Asian 3%
- Hispanic origin (detail)
- Puerto Rican 12% Cuban 2%
- Common ancestry
- Romanian 3% Lithuanian 1% Iranian 1%
- Foreign-born
- 10% · Canada, Vietnam, Philippines
- Languages at home
- 79% English-only · Spanish 12% Other Indo-European 3% Other Asian/Pacific 2%
Political lean MEDSL · Monroe
- 2024 margin
- D (+19.1) · D 59.5% · R 40.5%
- 2008→2024 swing
- +1.4pp toward D · 2008: 17.7pp · 2024: 19.1pp
- All cycles
- 2024: D+19.1 2020: D+21.0 2016: D+14.1 2012: D+17.4 2008: D+17.7
Not yet ingested
- Civics
- —
Market trends
- HPI YoY
- ▼ -62.59%
- Current HPI
- 287.6868
- Rent YoY
- ▲ 6.28%
- Metro
- Rochester, NY
- State GDP YoY
- ▲ 2.60%
- F500 in state
- 92
Industry mix (Fortune 500 HQ in NY)
| Industry | F500 HQs | Revenue |
|---|---|---|
| Financial Services | 10 | $950B |
|
||
| Consumer Goods | 9 | $162B |
|
||
| Insurance | 4 | $225B |
|
||
| Telecommunications | 2 | $144B |
|
||
| Pharmaceuticals | 2 | $112B |
|
||
| Media / Entertainment | 2 | $69B |
|
||
Price history
+62.6% since first listed8 events — show timeline
- 2026-03-10 Pending — UNYREIS
- 2026-03-09 Price Changed $100,000 UNYREIS
- 2026-03-03 Listed $90,000 UNYREIS
- 2025-07-31 Pending — UNYREIS
- 2025-07-30 Listing Removed — UNYREIS
- 2025-07-23 Listed $90,000 UNYREIS
- 2006-07-20 Sold (Public Records) $72,900 Public Records
- 1998-10-23 Sold (Public Records) $61,500 Public Records
Property tax history
+2.3%/yrLatest (2025): $1,248 · +0.0% YoY. Source: county tax records.
Cash-flow waterfall
monthlySold comps — $/sqft
last 12 mo · ≤1 miLoading sold comps…