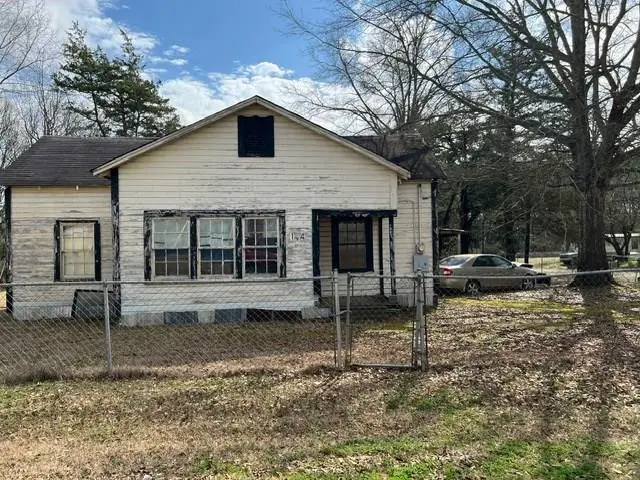
104 Pearl St · Timpson, TX
Flood risk 1/10 · Minimal
- FEMA flood zone
- —
- Chance of flooding over 30 yrs
- 0.0%
- Est. flood insurance / yr
- —
Fire risk 5/10 · Moderate
- Est. fire insurance / yr
- $1,222 – $2,270
Heat risk 7/10 · Major
- Hot days now (above 110°F)
- 7 days/yr
- Hot days in 30 yrs
- 24 days/yr
Wind risk 8/10 · Major
- Chance of severe wind over 30 yrs
- 80.0%
Air-quality risk 1/10 · Minimal
- Unhealthy air days now
- 0 days/yr
- Unhealthy air days in 30 yrs
- 0 days/yr
Risk factors via First Street. Map © Google.
Why this score? — see what drove the B grade
The composite is a weighted blend of 9 inputs, each scored 0–100. Each bar is that input's sub-score; the figure is the points it added to the 100-point composite (weight × sub-score).
- Cash flow +30.0/30.0
- 1% rule +10.0/10.0
- DSCR +10.0/10.0
- ARV discount +7.5/15.0
- Appreciation +4.8/10.0
- Livability +3.0/5.0
- Schools +2.6/10.0
- Rent growth +2.5/5.0
- Condition / age +2.5/5.0
$35,000
🖨 Deal sheet 📄 Offer letter ✓ Due diligence
Listing remarks
REDUCED!! Charming older home looking for family to bring it back to life. 3 bedrooms, 1 bathroom. Screened in porch and open front porch for relaxing after a long day. Fenced yard to keep pets and children safe while they play under the beautiful shade trees.
Key facts
- Screened in porch
- Fenced yard
- Shade trees
Tags
Property features AI
Exterior
- Parking: Attached parking
- Utilities: Public water; Public sewer
- Home design: Single-family residential property
- Construction: Composition roof
- Exterior features: Fenced yard
Interior
- Flooring: Vinyl; Wood
- Bathrooms: 2 full bathrooms
- Heating & cooling: Window Unit(s) for cooling
- Interior features: Vinyl and wood flooring; Window air conditioning units
Neighborhood map
What this means for you Summary
Snapshot
- This is a 3-bed/2.0-bath single-family listed at $35k.
Deal economics
- At list price, monthly cash flow is $537 ($6k/yr) — positive.
- The deal already cash-flows at list — no discount required.
- Meets the 1% rule at list price ($1k rent vs $35k).
Location & tenants
- Location reads 60/100 on livability (#1,064 in TX) — a middle-class / working-renter tenant base. Strengths: cost of living A+, housing A+, crime A-; Watch: schools D, amenities F, commute F.
- Timpson ISD (rural): math 28% / reading 35% proficiency, ranked #614 of 826 in TX (top 74%) — families likely to look elsewhere, expect single-tenant / working-renter base with shorter leases; 63% free/reduced lunch — lower-income household profile, screen leases tightly.
- Market conditions: 67 active listings in the ZIP; 1 units permitted in Shelby County in 2024 (0 in 5+ unit buildings).
Forward outlook
- In year one you build about $92 of equity ($242 loan paydown + $-150 appreciation (-0.4% local appreciation)).
- Shelby County population projected to shrink 4% by 2050 — rents likely to lag national; underwrite the cash flow, not the appreciation.
- At projected returns (-0.4% appreciation + 3.0% rent growth), your $10k cash investment doubles in ~2 years — after that, you're playing with house money.
Negotiation context
- Only 9 days on market — expect competitive offers; lowballing is unlikely to land.
Risks & watch-outs
- Watch-outs: property tax is 2.8% of price; built in 1950 — expect roof / HVAC / electrical / plumbing capex.
- Climate carrying-cost: severe wind risk, 80% chance of damaging wind over 30y; moderate wildfire risk; extreme-heat days projected 7→24/yr by 2055 (HVAC capex compounding) — expect insurance premiums to compound above CPI over the hold.
Questions for the listing agent
- Built in 1950 — when were the roof, HVAC, electrical panel, plumbing, and water heater last replaced?
- Property tax is high relative to price — has the assessment been appealed recently, and will the sale trigger a re-assessment?
- Is there a deadline driving the sale (1031 exchange, divorce, estate, relocation)? That informs how much negotiation room exists.
- Schools are D-rated, which usually means shorter tenancies and higher turnover. Who's the typical renter profile here, and what's been the actual vacancy rate?
- What's the average days-on-market for RENTAL listings here right now (not sales)? A rising rental-DOM trend means longer vacancies and softer asking-rent achievability than the comps imply.
- What's the recent tenant-quality profile in this submarket — average credit score on applications, eviction rate, late-payment / NSF rate, and stable-employment percentage? A property-management company in the area should have these aggregated.
- How much new for-sale + rental construction is in the pipeline within 1–3 miles? Heavy new supply typically softens prices + rents 12–24 months out; constrained supply supports both.
Investment metrics
- 1% rule
- 2.95% ✓
- Cap rate
- 24.69%
- Cash-on-cash
- 65.71%
- DSCR
- 3.92
- GRM
- 2.8
CMA / ARV
No comps found within radius.
Projected returns pro-forma
-0.43% appreciation · 3.0% rent growth · sell at horizon
- IRR
- 67.3%
- Equity multiple
- 4.32×
- Total profit
- $32,495
- Equity at exit
- $9,419
- IRR
- 69.6%
- Equity multiple
- 8.78×
- Total profit
- $76,279
- Equity at exit
- $10,744
Cash invested: $9,800 (down + closing). Projections, not guarantees.
Landlord ↔ Tenant lean methodology
- Overall (STATE)
- 87 Strongly Landlord-Friendly
- State Texas
- 87 Strongly Landlord-Friendly · R+5
- County
- — inherits STATE
- City
- — inherits STATE
ZIP-level market 75975
- Home prices YoY
- -0.3%
- Active inventory
- 67
- Price-to-rent
- 2.8×
Monthly cashflow live
- Estimated rent
- $1,032 medium interval (Pro) →
- Mortgage (P&I)
- −$184
- Tax from tax record
- −$81 /mo · $967/yr
- Insurance
- −$15
- HOA
- −$0
- Vacancy / Maint / Mgmt
- −$217
- Net cashflow
- $537
Break-even live
UW: 25.0% down · 7.5% · 30yr · 1.5% tax · 5.0% vac · 8.0% maint · 8.0% mgmt
Financing live
Cash to close
- Down payment
- $8,750
- Closing costs
- $1,050
- Reserves months
- —
- Total cash needed
- —
Loan-product check · same deal, 3 products live
Conventional
25% down · 7.5% · 30yr
- Down + closing
- —
- Monthly P&I
- —
- Monthly cashflow
- —
- DSCR
- —
- Eligible?
- —
Personal DTI + credit; lowest rate.
DSCR
20% down · 8.5% · 30yr
- Down + closing
- —
- Monthly P&I
- —
- Monthly cashflow
- —
- DSCR
- —
- Eligible?
- —
No personal income docs; deal must DSCR.
Hard money
10% down · 12.0% · 12mo
- Down + closing
- —
- Monthly P&I
- —
- Monthly cashflow
- —
- DSCR
- —
- Eligible?
- —
Short-term bridge; refi at stabilization.
Listing history 9 events
-
2026-06-18days on market $35,000 Active 9 DOM
-
2026-06-17days on market $35,000 Active 8 DOM
-
2026-06-16days on market $35,000 Active 7 DOM
-
2026-06-15days on market $35,000 Active 6 DOM
-
2026-06-15days on market $35,000 Active 5 DOM
-
2026-06-13days on market $35,000 Active 4 DOM
-
2026-06-12days on market $35,000 Active 3 DOM
-
2026-06-10remarks 260-char remark
-
2026-06-10$35,000 Active 1 DOM
ⓘ Source: listings_history table (triggers on properties + properties_extension) + one-shot
backfill from property_details.listing_events for pre-trigger history.
Tax reassessment forecast TX · Resets to sale price
- Current annual tax
- $967 · $81/mo
- Projected year-2 tax
- $967 · $81/mo
- Expected delta
- $0/yr ($0/mo · 0.0%)
ⓘ Screening estimate from a state-policy table — verify with the county assessor before closing.
Climate risk First Street
- Flood 1/10 Low 0% chance over 30 yrs
- Wildfire 5/10 Major
- Heat 7/10 Severe 7 d/yr ≥110°F today · 24 d/yr by 30 yrs out
- Wind 8/10 Severe 80% chance of damaging wind over 30 yrs
- Air quality 1/10 Low 0 unhealthy d/yr today · 0 by 30 yrs out
Nearby sold comps map
Loading sold comps map…
Walkable amenities ~0.75 mi
Loading nearby amenities…
Taxation est. · year 1
- Rental income
- $12,385
- − Mortgage interest
- −$1,961
- − Property taxes
- −$967
- − Insurance
- −$175
- − Repairs & maintenance
- −$991
- − Management
- −$991
- − Depreciation
- −$1,018
- Taxable income
- $6,283
- Est. tax owed @ 24.0%
- −$1,508
- After-tax cash flow
- $4,932/yr
For passive investors: Depreciation is non-cash, so a rental often shows a tax loss while cash-flowing — sheltering income. Rental losses are passive: they offset passive income freely, and up to $25,000/yr can offset ordinary (W-2) income if you actively participate and your MAGI is under $100k (phasing out to $0 by $150k); unused losses carry forward. On sale, claimed depreciation is recaptured at up to 25%, and gains may owe capital-gains tax (a 1031 exchange can defer both). Figures are a year-1 estimate at your 24.0% rate — not tax advice; consult a CPA.
Schools (NCES district)
- District
- Timpson ISD
- NCES district ID
- 4842840
- Math proficiency
- 28% ▼ -22.00%
- Reading proficiency
- 35% ▼ -1.00%
- Median HH income
- $36,041
- Composite
- 26.09/100
- National rank
- #7293
- State rank
- #614 of 826 in TX
Livability — Timpson
- Score
- 60/100
- State rank
- #1064
- US rank
- #18901
Category grades
Schools grade is shown separately in the Schools card above.
Census & demographics
- Census place
- Timpson, TX
- Population (ZIP)
- 3,873
Population outlook (Shelby County) Hauer SSP2
- Today (2025)
- 25,199 people
- By 2030
- 24,986 · -0.8%
- By 2040
- 24,646 · -2.2%
- By 2050
- 24,144 · -4.2%
- By 2075
- 22,328 · -11.4%
- By 2100
- 18,734 · -25.7%
Race, ethnicity, and origin ACS 2023
- Neighborhood character
- Diverse neighborhood (Simpson 0.59)
- Race & ethnicity
- White 61% Two or more races 20% Black 16% Hispanic / Latino 10% Pacific Islander 1%
- Hispanic origin (detail)
- Mexican 8%
- Common ancestry
- Lithuanian 3% Slovak 2% Romanian 1%
- Foreign-born
- 5% · Canada
- Languages at home
- 91% English-only · Spanish 8% Other Asian/Pacific 1%
Political lean MEDSL · Shelby
- 2024 margin
- Solid R (+64.6) · D 17.5% · R 82.1%
- 2008→2024 swing
- -20.3pp toward R · 2008: -44.3pp · 2024: -64.6pp
- All cycles
- 2024: R+64.6 2020: R+58.6 2016: R+59.7 2012: R+49.1 2008: R+44.3
Not yet ingested
- Civics
- —
Market trends
- HPI YoY
- ▼ -0.43%
- Current HPI
- 160.5146
- Rent YoY
- —
- Metro
- —
- State GDP YoY
- ▲ 3.95%
- F500 in state
- 110
Industry mix (Fortune 500 HQ in TX)
| Industry | F500 HQs | Revenue |
|---|---|---|
| Energy | 16 | $1,198B |
|
||
| Technology | 5 | $198B |
|
||
| Engineering / Construction | 4 | $72B |
|
||
| Energy Services | 3 | $60B |
|
||
| Utilities | 3 | $41B |
|
||
| Healthcare | 2 | $330B |
|
||
Price history
1 event — show timeline
- 2025-02-05 Listed $35,000 Deep East Texas MLS
Property tax history
+2.5%/yrLatest (2025): $967 · +5.3% YoY. Source: county tax records.
Cash-flow waterfall
monthlySold comps — $/sqft
last 12 mo · ≤1 miLoading sold comps…