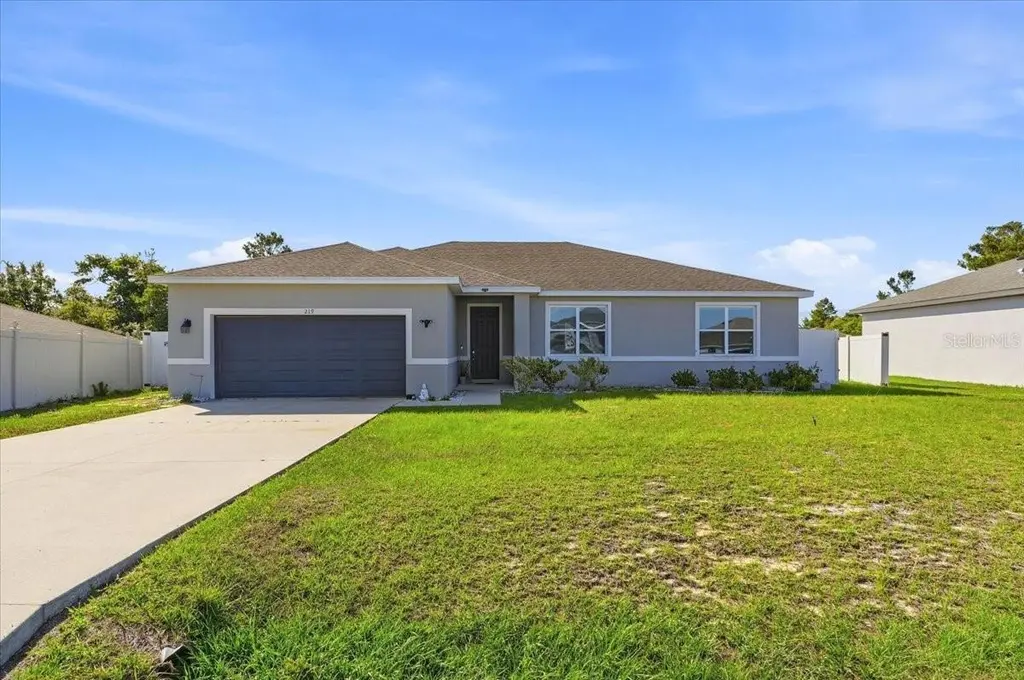
219 Maple Dr · Poinciana, FL
Flood risk 1/10 · Minimal
- FEMA flood zone
- X (unshaded)
- Chance of flooding over 30 yrs
- 0.0%
- Est. flood insurance / yr
- $507 – $1,088
Fire risk 4/10 · Minor
- Est. fire insurance / yr
- $947 – $1,759
Heat risk 8/10 · Major
- Hot days now (above 108°F)
- 7 days/yr
- Hot days in 30 yrs
- 23 days/yr
Wind risk 9/10 · Severe
- Chance of severe wind over 30 yrs
- 99.0%
Air-quality risk 1/10 · Minimal
- Unhealthy air days now
- 0 days/yr
- Unhealthy air days in 30 yrs
- 0 days/yr
Risk factors via First Street. Map © Google.
Why this score? — see what drove the D- grade
The composite is a weighted blend of 9 inputs, each scored 0–100. Each bar is that input's sub-score; the figure is the points it added to the 100-point composite (weight × sub-score).
- Cash flow +9.1/30.0
- ARV discount +7.5/15.0
- Appreciation +4.3/10.0
- Schools +3.5/10.0
- 1% rule +3.2/10.0
- Livability +2.9/5.0
- Rent growth +2.8/5.0
- DSCR +2.5/10.0
- Condition / age +2.5/5.0
$249,999
🖨 Deal sheet (PDF) 📄 Offer letter ✓ Due diligence
Listing remarks MLS
BRAND NEW & UNDER CONSTRUCTION, THIS BEAUTIFUL HOME FEATURES 4 BEDROOMS AND 2 FULL BATHS WITH A 2 CAR GARAGE. AMPLE LANAI, SPACIOUS 9'4" FEET CEILING, 18X18 CERAMIC TILE IN ALL LIVING AREAS, UPGRADED 7LB PADDED CARPET IN BEDROOMS, SOLID WOOD CABINETS AND MUCH MORE! ALL BUYER'S CLOSING COST PAID BY BUILDER WHEN USING BUILDER'S PREFERRED LENDER. OPEN FLOOR PLAN. PROJECTED COMPLETION DATE AUGUST-SEPTEMBER 2018. CALL US TODAY FOR A PRIVATE TOUR! (THIS PROPERTY IS ELEVATION A ON FLOORPLAN)
Key facts
- 8,634 sq ft lot
- 2 garage spots
- Built 2018
Neighborhood map
What this means for you Summary
Snapshot
- This is a 3-bed/2.0-bath single-family listed at $250k.
Deal economics
- At list price, monthly cash flow is $-194 ($-2k/yr) — negative.
- To cash-flow at today's rent, offer at most $216k (13.7% below list).
- To meet the 1% rule (rent ≥ 1% of price), the offer needs to be $204k (18.2% below list).
- Recommended offer: $204k (18.2% below list) — sets the bar for 1% rule.
- Cap rate 5.4% vs local median 4.2% in Poinciana — meaningfully above typical; check what's discounted (condition, days-on-market, listing class) to confirm the premium yield is real.
Location & tenants
- Location reads 57/100 on livability (#859 in FL) — a working-class tenant base; expect higher turnover. Strengths: cost of living A+, housing A+; Watch: employment D+, amenities F, commute F.
- Polk (suburban): math 39% / reading 43% proficiency, ranked #62 of 73 in FL (top 85%) — families likely to look elsewhere, expect single-tenant / working-renter base with shorter leases.
- Zoned schools: Laurel Elementary School (math 26% / reading 34%, grade F, #1,882 of 2,144 statewide, top 88%, 1,058 students, 50% FRL); Lake Marion Creek Middle School (math 22% / reading 27%, grade F, #522 of 571 statewide, top 93%, 1,044 students, 58% FRL); Haines City Senior High School (math 12% / reading 32%, grade F, #544 of 667 statewide, top 82%, 2,700 students, 58% FRL) — zoned schools at 56% FRL track the district average.
- Zoned-school proficiency averages 26% at this address vs 41% district-wide (-16 pts) — the specific schools serving this property underperform the Polk average; the district grade overstates school quality for this exact location.
- Market conditions: Rents rising (+1.1%/yr); 1155 active listings in the ZIP; 40 comparable units currently listed for rent nearby; rentals at typical pace (median 16d on market — plan ~3-4 weeks tenant-placement turnaround); 10,384 units permitted in Polk County in 2024 (1,716 in 5+ unit buildings).
- This rent runs 35% of the median local income ($69k/yr) — at the standard rent-burdened threshold; future hikes will face affordability resistance.
Forward outlook
- Local home prices are declining (-1.5%/yr); year-one equity from $2k of loan paydown is wiped out by about $4k of value loss. Plan a longer hold.
- Polk County population projected at +33% by 2050 — long-run rental-demand tailwind backs the buy-and-hold thesis.
Negotiation context
- Only 2 days on market — expect competitive offers; lowballing is unlikely to land.
- 2 sale attempts since 8y ago with the ask held roughly flat each time — persistent listings suggest the price (not the market) is what's stuck; bring a comps-based counter.
- Current owner paid $200k; 25% above their basis — modest negotiation headroom, anchor on the comps not their cost.
Risks & watch-outs
- Climate carrying-cost: severe wind risk, 99% chance of damaging wind over 30y; extreme-heat days projected 7→23/yr by 2055 (HVAC capex compounding) — expect insurance premiums to compound above CPI over the hold.
Questions for the listing agent
- What do current leases actually rent for vs. the listed asking? Can we see a recent rent roll and the last 12 months of T-12 income?
- What does the HOA fee cover, when was the last increase, and are there any pending special assessments or reserve-fund shortfalls?
- Is there a deadline driving the sale (1031 exchange, divorce, estate, relocation)? That informs how much negotiation room exists.
- Schools are F-rated, which usually means shorter tenancies and higher turnover. Who's the typical renter profile here, and what's been the actual vacancy rate?
- The area grade is low — what's the realistic commute time and amenity access for the typical tenant pool here? Any planned neighborhood developments (good or bad) we should know about?
- What's the average days-on-market for RENTAL listings here right now (not sales)? A rising rental-DOM trend means longer vacancies and softer asking-rent achievability than the comps imply.
- What's the recent tenant-quality profile in this submarket — average credit score on applications, eviction rate, late-payment / NSF rate, and stable-employment percentage? A property-management company in the area should have these aggregated.
- How much new for-sale + rental construction is in the pipeline within 1–3 miles? Heavy new supply typically softens prices + rents 12–24 months out; constrained supply supports both.
Investment metrics
- 1% rule
- 0.82% ✗
- Cap rate
- 5.36%
- Cash-on-cash
- -3.33%
- DSCR
- 0.85
- GRM
- 10.2
CMA / ARV
No comps found within radius.
Projected returns pro-forma
-1.48% appreciation · 1.14% rent growth · sell at horizon
- IRR
- -14.2%
- Equity multiple
- 0.43×
- Total profit
- $-40,222
- Equity at exit
- $54,655
- IRR
- -9.3%
- Equity multiple
- 0.28×
- Total profit
- $-50,509
- Equity at exit
- $52,672
Cash invested: $70,000 (down + closing). Projections, not guarantees.
Landlord ↔ Tenant lean methodology
- Overall (STATE)
- 87 Strongly Landlord-Friendly
- State Florida
- 87 Strongly Landlord-Friendly · R+3
- County
- — inherits STATE
- City
- — inherits STATE
ZIP-level market 34759
- Home prices YoY
- -0.5%
- Rents YoY
- 1.1%
- Active inventory
- 1155
- Price-to-rent
- 10.2×
Monthly cashflow live
- Estimated rent
- $2,044 high interval (Pro) →
- Mortgage (P&I)
- −$1,311
- Tax from tax record
- −$304 /mo · $3,648/yr
- Insurance
- −$104
- HOA
- −$90
- Vacancy / Maint / Mgmt
- −$429
- Net cashflow
- $-194
Break-even live
Sensitivity live
| Price | -10% $-53 | -5% $-124 | +0% $-194 | +5% $-265 | +10% $-336 |
|---|---|---|---|---|---|
| Rent | -10% $-356 | -5% $-275 | +0% $-194 | +5% $-114 | +10% $-33 |
| Rate | -1.0pp $-68 | -0.5pp $-131 | base $-194 | +0.5pp $-259 | +1.0pp $-325 |
UW: 25.0% down · 7.5% · 30yr · 1.5% tax · 5.0% vac · 8.0% maint · 8.0% mgmt
Financing live
Cash to close
- Down payment
- $62,500
- Closing costs
- $7,500
- Reserves months
- —
- Total cash needed
- —
Loan-product check · same deal, 3 products live
Conventional
25% down · 7.5% · 30yr
- Down + closing
- —
- Monthly P&I
- —
- Monthly cashflow
- —
- DSCR
- —
- Eligible?
- —
Personal DTI + credit; lowest rate.
DSCR
20% down · 8.5% · 30yr
- Down + closing
- —
- Monthly P&I
- —
- Monthly cashflow
- —
- DSCR
- —
- Eligible?
- —
No personal income docs; deal must DSCR.
Hard money
10% down · 12.0% · 12mo
- Down + closing
- —
- Monthly P&I
- —
- Monthly cashflow
- —
- DSCR
- —
- Eligible?
- —
Short-term bridge; refi at stabilization.
Rent comps 40 comps
| Address | Beds | Baths | Sqft | Rent | $/sqft | DOM | Units | Dist |
|---|---|---|---|---|---|---|---|---|
| 2006 Maple Ln Kissimmee, FL | 4.0 | 2.0 | 1886 | $2,040 | $1.08 | 5d | 1 | 0.03mi |
| 2005 Maple Ln Kissimmee, FL | 4.0 | 2.0 | 1669 | $1,719 | $1.03 | 5d | 1 | 0.06mi |
| 107 Lily Ln Kissimmee, FL | 4.0 | 2.0 | 1670 | $2,090 | $1.25 | 25d | 1 | 0.12mi |
| 3 Magnolia Blossom Ln Kissimmee, FL | 4.0 | 2.0 | 1670 | $1,995 | $1.19 | 20d | 1 | 0.14mi |
| 105 Zinnia Ln W Kissimmee, FL | 4.0 | 2.0 | 1600 | $2,100 | $1.31 | 5d | 1 | 0.27mi |
| 29 Orchid Ct Kissimmee, FL | 4.0 | 2.0 | 1670 | $1,890 | $1.13 | 5d | 1 | 0.28mi |
| 222 Fig Ct Kissimmee, FL | 4.0 | 2.5 | 1823 | $1,970 | $1.08 | 5d | 1 | 0.34mi |
| 222 Fig Ct Kissimmee, FL | 3.0 | 2.0 | 1852 | $1,970 | $1.06 | 4d | 1 | 0.34mi |
| 216 Fig Ct Kissimmee, FL | 4.0 | 2.5 | 1823 | $2,080 | $1.14 | 16d | 1 | 0.37mi |
| 216 Fig Ct Kissimmee, FL | 3.0 | 2.0 | 1852 | $2,005 | $1.08 | 5d | 1 | 0.37mi |
| 99 Orchid Ln Kissimmee, FL | 3.0 | 2.0 | 1708 | $1,900 | $1.11 | 16d | 1 | 0.39mi |
| 207 Begonia Ln Kissimmee, FL | 4.0 | 2.0 | 1623 | $1,925 | $1.19 | 25d | 1 | 0.41mi |
| 204 Fig Ct Kissimmee, FL | 4.0 | 2.5 | 1823 | $2,080 | $1.14 | 25d | 1 | 0.45mi |
| 210 Goldenrod Ln Kissimmee, FL | 4.0 | 2.0 | 1626 | $1,875 | $1.15 | 25d | 1 | 0.46mi |
| 302 Elderberry Ct Kissimmee, FL | 4.0 | 2.0 | 1670 | $2,200 | $1.32 | 25d | 1 | 0.49mi |
| 302 W Aster Ct Kissimmee, FL | 4.0 | 2.0 | 1670 | $2,240 | $1.34 | 5d | 1 | 0.49mi |
| 207 Gladiola Ct Kissimmee, FL | 4.0 | 2.0 | 1605 | $1,855 | $1.16 | 5d | 1 | 0.49mi |
| 305 Elderberry Ct Kissimmee, FL | 4.0 | 2.0 | 1560 | $2,000 | $1.28 | 5d | 1 | 0.49mi |
| 119 Tulip Ln Kissimmee, FL | 4.0 | 2.0 | 1670 | $2,095 | $1.25 | 25d | 1 | 0.50mi |
| 260 Gladiola Ct Kissimmee, FL | 4.0 | 2.0 | 1670 | $2,065 | $1.24 | 5d | 1 | 0.52mi |
| 333 Daffodil Ln Kissimmee, FL | 4.0 | 2.0 | 1851 | $2,040 | $1.10 | 15d | 1 | 0.53mi |
| 309 Fern Ct Kissimmee, FL | 4.0 | 2.5 | 1767 | $2,150 | $1.22 | 5d | 1 | 0.53mi |
| 108 Tulip Ln Kissimmee, FL | 4.0 | 2.0 | 1612 | $2,000 | $1.24 | 16d | 1 | 0.54mi |
| 263 Gladiola Ct Kissimmee, FL | 4.0 | 2.0 | 1605 | $1,750 | $1.09 | 16d | 1 | 0.54mi |
| 260 Hyacinth Ct Kissimmee, FL | 4.0 | 2.0 | 1400 | $1,765 | $1.26 | 25d | 1 | 0.56mi |
| 316 Fern Ct Kissimmee, FL | 4.0 | 2.0 | 1605 | $1,775 | $1.11 | 5d | 1 | 0.58mi |
| 339 W Aster Ct Kissimmee, FL | 3.0–4.0 | 2.0–3.0 | 1504 | $1,695 | $1.13 | 4d | 1 | 0.63mi |
| 2129 Hibiscus Pl Kissimmee, FL | 4.0 | 2.0 | 1765 | $2,100 | $1.19 | 5d | 1 | 0.69mi |
| 325 Hibiscus Dr Kissimmee, FL | 4.0 | 2.0 | 1605 | $1,995 | $1.24 | 5d | 1 | 0.70mi |
| 319 Erie Dr Kissimmee, FL | 3.0 | 2.0 | 1310 | $1,765 | $1.35 | 15d | 1 | 0.70mi |
| 344 Hibiscus Dr Kissimmee, FL | 4.0 | 2.0 | 1670 | $1,825 | $1.09 | 5d | 1 | 0.75mi |
| 337 Hibiscus Dr Kissimmee, FL | 4.0 | 2.0 | 1670 | $1,980 | $1.19 | 15d | 1 | 0.77mi |
| 439 Caraway Dr Kissimmee, FL | 4.0 | 2.0 | 1791 | $1,800 | $1.01 | 5d | 1 | 0.78mi |
| 1110 Chervil Dr Kissimmee, FL | 3.0 | 2.5 | 2110 | $1,575 | $0.75 | 25d | 1 | 0.79mi |
| 1130 Chervil Dr Kissimmee, FL | 3.0 | 2.5 | 1495 | $1,575 | $1.05 | 25d | 1 | 0.82mi |
| 1282 Clove Dr Kissimmee, FL | 4.0 | 2.5 | 1906 | $1,600 | $0.84 | 5d | 1 | 0.82mi |
| 452 Cinnamon Dr Kissimmee, FL | 4.0 | 2.0 | 1793 | $2,000 | $1.12 | 25d | 1 | 0.82mi |
| 446 Caraway Dr Kissimmee, FL | 3.0 | 2.0 | 1334 | $1,675 | $1.26 | 25d | 1 | 0.85mi |
| 404 Cinnamon Dr Kissimmee, FL | 3.0 | 2.0 | 1321 | $1,775 | $1.34 | 16d | 1 | 0.87mi |
| 922 Centaury Dr Unit 1 Poinciana, FL | 3.0 | 3.0 | 2166 | $1,900 | $0.88 | 16d | 1 | 0.89mi |
HOA detail
- Monthly dues
- $90 · $1,080/yr
Listing history 9 events
-
2026-04-24status Pending
-
2026-04-22$249,999 Active
-
2018-12-05soldstatus $199,900 Sold 500-char remark
Show marketing remark (500 chars)
BRAND NEW & UNDER CONSTRUCTION, THIS BEAUTIFUL HOME FEATURES 4 BEDROOMS AND 2 FULL BATHS WITH A 2 CAR GARAGE. AMPLE LANAI, SPACIOUS 9'4" FEET CEILING, 18X18 CERAMIC TILE IN ALL LIVING AREAS, UPGRADED 7LB PADDED CARPET IN BEDROOMS, SOLID WOOD CABINETS AND MUCH MORE! ALL BUYER'S CLOSING COST PAID BY BUILDER WHEN USING BUILDER'S PREFERRED LENDER. OPEN FLOOR PLAN. PROJECTED COMPLETION DATE AUGUST-SEPTEMBER 2018. CALL US TODAY FOR A PRIVATE TOUR! (THIS PROPERTY IS ELEVATION A ON FLOORPLAN)
-
2018-06-26soldstatus $249,366
-
2018-04-23status Pending 500-char remark
Show marketing remark (500 chars)
BRAND NEW & UNDER CONSTRUCTION, THIS BEAUTIFUL HOME FEATURES 4 BEDROOMS AND 2 FULL BATHS WITH A 2 CAR GARAGE. AMPLE LANAI, SPACIOUS 9'4" FEET CEILING, 18X18 CERAMIC TILE IN ALL LIVING AREAS, UPGRADED 7LB PADDED CARPET IN BEDROOMS, SOLID WOOD CABINETS AND MUCH MORE! ALL BUYER'S CLOSING COST PAID BY BUILDER WHEN USING BUILDER'S PREFERRED LENDER. OPEN FLOOR PLAN. PROJECTED COMPLETION DATE AUGUST-SEPTEMBER 2018. CALL US TODAY FOR A PRIVATE TOUR! (THIS PROPERTY IS ELEVATION A ON FLOORPLAN)
-
2018-04-20$199,990 Active 500-char remark
Show marketing remark (500 chars)
BRAND NEW & UNDER CONSTRUCTION, THIS BEAUTIFUL HOME FEATURES 4 BEDROOMS AND 2 FULL BATHS WITH A 2 CAR GARAGE. AMPLE LANAI, SPACIOUS 9'4" FEET CEILING, 18X18 CERAMIC TILE IN ALL LIVING AREAS, UPGRADED 7LB PADDED CARPET IN BEDROOMS, SOLID WOOD CABINETS AND MUCH MORE! ALL BUYER'S CLOSING COST PAID BY BUILDER WHEN USING BUILDER'S PREFERRED LENDER. OPEN FLOOR PLAN. PROJECTED COMPLETION DATE AUGUST-SEPTEMBER 2018. CALL US TODAY FOR A PRIVATE TOUR! (THIS PROPERTY IS ELEVATION A ON FLOORPLAN)
-
2018-01-24soldstatus $400,000
-
2010-10-27soldstatus $222,000
-
2005-02-18soldstatus $7,000
ⓘ Source: listings_history table (triggers on properties + properties_extension) + one-shot
backfill from property_details.listing_events for pre-trigger history.
Tax reassessment forecast FL · Resets to sale price
- Current annual tax
- $3,648 · $304/mo
- Projected year-2 tax
- $3,648 · $304/mo
- Expected delta
- $0/yr ($0/mo · 0.0%)
ⓘ Screening estimate from a state-policy table — verify with the county assessor before closing.
Climate risk First Street
- Flood 1/10 Low FEMA zone X (unshaded) · 0% chance over 30 yrs
- Wildfire 4/10 Moderate
- Heat 8/10 Severe 7 d/yr ≥108°F today · 23 d/yr by 30 yrs out
- Wind 9/10 Extreme 99% chance of damaging wind over 30 yrs
- Air quality 1/10 Low 0 unhealthy d/yr today · 0 by 30 yrs out
Nearby sold comps map
Loading sold comps map…
Walkable amenities ~0.75 mi
Loading nearby amenities…
Taxation est. · year 1
- Rental income
- $24,531
- − Mortgage interest
- −$14,004
- − Property taxes
- −$3,648
- − Insurance
- −$1,250
- − Repairs & maintenance
- −$1,962
- − Management
- −$1,962
- − HOA
- −$1,080
- − Depreciation
- −$7,273
- Taxable loss
- −$6,649
- Est. tax savings @ 24.0%
- +$1,596
- After-tax cash flow
- $-736/yr
For passive investors: Depreciation is non-cash, so a rental often shows a tax loss while cash-flowing — sheltering income. Rental losses are passive: they offset passive income freely, and up to $25,000/yr can offset ordinary (W-2) income if you actively participate and your MAGI is under $100k (phasing out to $0 by $150k); unused losses carry forward. On sale, claimed depreciation is recaptured at up to 25%, and gains may owe capital-gains tax (a 1031 exchange can defer both). Figures are a year-1 estimate at your 24.0% rate — not tax advice; consult a CPA.
Schools (NCES district)
- District
- Polk
- NCES district ID
- 1201590
- Math proficiency
- 39% ▼ -11.00%
- Reading proficiency
- 43% ▼ -4.00%
- Median HH income
- $43,979
- Composite
- 34.74/100
- National rank
- #5132
- State rank
- #62 of 73 in FL
Livability — Poinciana
- Score
- 57/100
- State rank
- #859
- US rank
- #21760
Category grades
Schools grade is shown separately in the Schools card above.
Census & demographics
- Census place
- Poinciana, FL
- County
- Polk County · 740,051 people
- City population
- 91,336
- Metro
- Lakeland-Winter Haven, FL
- Population (ZIP)
- 44,568
- Household income
- $69,373
- Rent vs Own
- Severe rent burden
- 1186.0
Population outlook (Polk County) Hauer SSP2
- Today (2025)
- 752,975 people
- By 2030
- 804,621 · +6.9%
- By 2040
- 906,117 · +20.3%
- By 2050
- 1,000,476 · +32.9%
- By 2075
- 1,197,520 · +59.0%
- By 2100
- 1,271,518 · +68.9%
Race, ethnicity, and origin ACS 2023
- Neighborhood character
- Diverse neighborhood (Simpson 0.62)
- Race & ethnicity
- Hispanic / Latino 55% White 21% Two or more races 20% Black 19%
- Hispanic origin (detail)
- Mexican 2% Puerto Rican 38% Cuban 6% Dominican 3%
- Common ancestry
- Hispanic 3% Romanian 2% Scotch-Irish 1%
- Foreign-born
- 17% · Canada, Jamaica
- Languages at home
- 49% English-only · Spanish 48% French/Haitian/Cajun 2%
Political lean MEDSL · Polk
- 2024 margin
- Strong R (+20.7) · D 39.2% · R 59.9%
- 2008→2024 swing
- -14.6pp toward R · 2008: -6.1pp · 2024: -20.7pp
- All cycles
- 2024: R+20.7 2020: R+14.4 2016: R+14.1 2012: R+6.8 2008: R+6.1
Not yet ingested
- Civics
- —
Market trends
- HPI YoY
- ▼ -1.48%
- Current HPI
- 276.6861
- Rent YoY
- ▲ 1.14%
- Metro
- Lakeland-Winter Haven, FL
- State GDP YoY
- ▲ 3.28%
- F500 in state
- 36
Industry mix (Fortune 500 HQ in FL)
| Industry | F500 HQs | Revenue |
|---|---|---|
| Industrial Technology | 2 | $29B |
|
||
| Insurance | 2 | $17B |
|
||
| Retail | 1 | $60B |
|
||
| Technology Distribution | 1 | $58B |
|
||
| Homebuilding | 1 | $35B |
|
||
| Technology Manufacturing | 1 | $35B |
|
||
Price history
+3471.4% since first listed9 events — show timeline
- 2026-04-24 Pending — Stellar MLS as Distributed by MLS Grid
- 2026-04-22 Listed $249,999 Stellar MLS as Distributed by MLS Grid
- 2018-12-05 Sold (MLS) $199,900 Stellar MLS as Distributed by MLS Grid
- 2018-06-26 Sold (Public Records) $249,366 Public Records
- 2018-04-23 Pending — Stellar MLS as Distributed by MLS Grid
- 2018-04-20 Listed $199,990 Stellar MLS as Distributed by MLS Grid
- 2018-01-24 Sold (Public Records) $400,000 Public Records
- 2010-10-27 Sold (Public Records) $222,000 Public Records
- 2005-02-18 Sold (Public Records) $7,000 Public Records
Property tax history
+44.4%/yrLatest (2025): $3,648 · +0.4% YoY. Source: county tax records.
Cash-flow waterfall
monthlySold comps — $/sqft
last 12 mo · ≤1 miLoading sold comps…