201 S 12th St · Tonkawa, OK
Flood risk 1/10 · Minimal
- FEMA flood zone
- X (unshaded)
- Chance of flooding over 30 yrs
- 0.0%
- Est. flood insurance / yr
- $507 – $1,088
Fire risk 1/10 · Minimal
- Est. fire insurance / yr
- $2,463 – $4,575
Heat risk 6/10 · Moderate
- Hot days now (above 109°F)
- 7 days/yr
- Hot days in 30 yrs
- 18 days/yr
Wind risk 2/10 · Minimal
- Chance of severe wind over 30 yrs
- 2.0%
Air-quality risk 2/10 · Minimal
- Unhealthy air days now
- 1 days/yr
- Unhealthy air days in 30 yrs
- 1 days/yr
Risk factors via First Street. Map © Google.
Why this score? — see what drove the B grade
The composite is a weighted blend of 9 inputs, each scored 0–100. Each bar is that input's sub-score; the figure is the points it added to the 100-point composite (weight × sub-score).
- Cash flow +30.0/30.0
- 1% rule +10.0/10.0
- DSCR +10.0/10.0
- ARV discount +7.5/15.0
- Appreciation +4.4/10.0
- Livability +3.4/5.0
- Rent growth +2.5/5.0
- Schools +1.6/10.0
- Condition / age +1.0/5.0
$34,000
🖨 Deal sheet 📄 Offer letter ✓ Due diligence
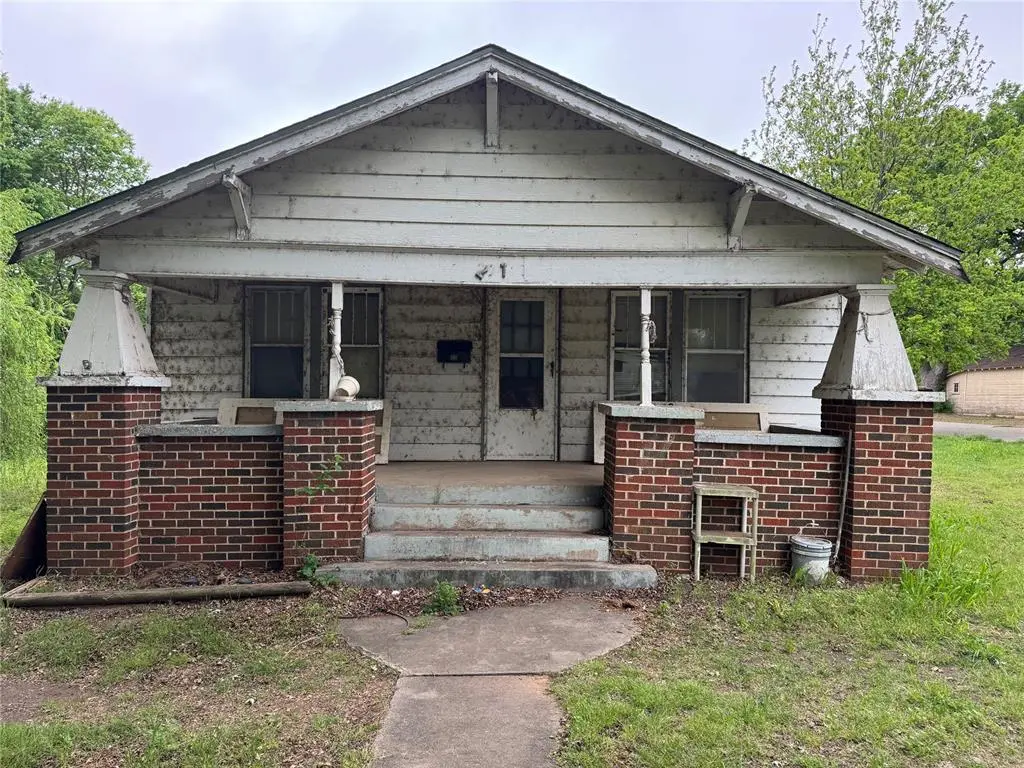
Listing remarks
Nestled in the heart of Tonkawa, this charming 3-bedroom, 1-bath home spans approximately 1,208 square feet on a generous 0.30-acre lot. With an estimated value of around $74,700, this property offers both comfort and potential. Built decades ago and lovingly maintained, it features a classic layout that’s ready for your personal touch. This property is a total of 8 lots, 4 are vacant land directly behind the house. The low annual taxes—just $160 in 2025—make it an affordable option for homeowners or investors alike. With an estimated rental income of $864 per month, it presents a compelling opportunity for steady returns. This home enjoys convenient access to trusted loca
Key facts
- 0.3 acre lot
- Built 1925
- Listed 52 days
Property features AI
Finance
- Other: Property status: Existing; Occupied by owner; Handicap accessible
- Financial info: Assumable: No; Loan qualification: Unknown
- HOA & community: No mandatory association dues
Exterior
- Home design: Single family residence; One level; East-facing
- Construction: Frame construction; Composition roof; Slab foundation
- Exterior features: Corner lot; Chain link fencing; No additional exterior features listed; Below-ground storm shelter
Interior
- Kitchen: Free‑standing gas range/oven; Refrigerator
- Bedrooms: 3 bedrooms
- Flooring: Wood floors
- Bathrooms: 1 full bathroom
- Heating & cooling: Electric heating
- Interior features: Accessible approach with ramp; Basement; Bonus room; Masonry fireplace
Neighborhood map
What this means for you Summary
Snapshot
- This is a 3-bed/1.0-bath other listed at $34k. Condition is rated poor.
Deal economics
- At list price, monthly cash flow is $619 ($7k/yr) — positive.
- The deal already cash-flows at list — no discount required.
- Meets the 1% rule at list price ($1k rent vs $34k).
- Recommended offer: $33k (3.0% below list) — sets the bar for market timing.
Location & tenants
- Location reads 67/100 on livability (#99 in OK) — a middle-class / working-renter tenant base. Strengths: cost of living A+, housing A+; Watch: employment D+, amenities F, commute F.
- Tonkawa (town): math 16% / reading 22% proficiency, ranked #179 of 270 in OK (top 66%) — low school quality limits family demand, transient renter base, plan for 1-2y turnover.
- Zoned schools: Tonkawa Es (math 22% / reading 27%, grade F, #354 of 845 statewide, top 47%, 462 students, 0% FRL); Tonkawa Hs (math 24% / reading 34%, grade F, #96 of 447 statewide, top 26%, 216 students, 0% FRL) — zoned schools average 0% FRL vs 53% district-wide (53 pts lower); this property's tenant base skews higher-income than the district average.
- Market conditions: 17 active listings in the ZIP; 11 units permitted in Kay County in 2024 (0 in 5+ unit buildings).
Forward outlook
- Local home prices are declining (-1.3%/yr); year-one equity from $235 of loan paydown is wiped out by about $438 of value loss. Plan a longer hold.
- Kay County population projected at -12% by 2050 — secular population decline; favor cash flow + early exit over multi-decade hold.
- At projected returns (-1.3% appreciation + 3.0% rent growth), your $10k cash investment doubles in ~2 years — after that, you're playing with house money.
Negotiation context
- It's been on market 53 days — a 3% lower offer ($33k) is reasonable based on typical stale-listing flexibility.
Risks & watch-outs
- Watch-outs: built in 1925 — expect roof / HVAC / electrical / plumbing capex.
- Climate carrying-cost: extreme-heat days projected 7→18/yr by 2055 (HVAC capex compounding) — expect insurance premiums to compound above CPI over the hold.
Questions for the listing agent
- It's been on market 53 days. Have you received any prior offers? Is the seller open to a 3% concession, seller financing, or rate buy-down credit?
- Have any recent inspections been done? Can we get a copy of the seller's disclosures and any deferred-maintenance estimates?
- Built in 1925 — when were the roof, HVAC, electrical panel, plumbing, and water heater last replaced?
- Is there a deadline driving the sale (1031 exchange, divorce, estate, relocation)? That informs how much negotiation room exists.
- Schools are F-rated, which usually means shorter tenancies and higher turnover. Who's the typical renter profile here, and what's been the actual vacancy rate?
- What's the average days-on-market for RENTAL listings here right now (not sales)? A rising rental-DOM trend means longer vacancies and softer asking-rent achievability than the comps imply.
- What's the recent tenant-quality profile in this submarket — average credit score on applications, eviction rate, late-payment / NSF rate, and stable-employment percentage? A property-management company in the area should have these aggregated.
- How much new for-sale + rental construction is in the pipeline within 1–3 miles? Heavy new supply typically softens prices + rents 12–24 months out; constrained supply supports both.
Investment metrics
- 1% rule
- 3.18% ✓
- Cap rate
- 28.12%
- Cash-on-cash
- 77.97%
- DSCR
- 4.47
- GRM
- 2.6
CMA / ARV
No comps found within radius.
Projected returns pro-forma
-1.29% appreciation · 3.0% rent growth · sell at horizon
- IRR
- 79.2%
- Equity multiple
- 4.82×
- Total profit
- $36,411
- Equity at exit
- $7,739
- IRR
- 81.7%
- Equity multiple
- 9.91×
- Total profit
- $84,821
- Equity at exit
- $7,734
Cash invested: $9,520 (down + closing). Projections, not guarantees.
Landlord ↔ Tenant lean methodology
- Overall (STATE)
- 83 Strongly Landlord-Friendly
- State Oklahoma
- 83 Strongly Landlord-Friendly · R+20
- County
- — inherits STATE
- City
- — inherits STATE
ZIP-level market 74653
- Home prices YoY
- -0.5%
- Active inventory
- 17
- Price-to-rent
- 2.6×
Monthly cashflow live
- Estimated rent
- $1,080 medium interval (Pro) →
- Mortgage (P&I)
- −$178
- Tax est. 1.5%
- −$42 /mo · $510/yr
- Insurance
- −$14
- HOA
- −$0
- Vacancy / Maint / Mgmt
- −$227
- Net cashflow
- $619
Break-even live
UW: 25.0% down · 7.5% · 30yr · 1.5% tax · 5.0% vac · 8.0% maint · 8.0% mgmt
Financing live
Cash to close
- Down payment
- $8,500
- Closing costs
- $1,020
- Reserves months
- —
- Total cash needed
- —
Loan-product check · same deal, 3 products live
Conventional
25% down · 7.5% · 30yr
- Down + closing
- —
- Monthly P&I
- —
- Monthly cashflow
- —
- DSCR
- —
- Eligible?
- —
Personal DTI + credit; lowest rate.
DSCR
20% down · 8.5% · 30yr
- Down + closing
- —
- Monthly P&I
- —
- Monthly cashflow
- —
- DSCR
- —
- Eligible?
- —
No personal income docs; deal must DSCR.
Hard money
10% down · 12.0% · 12mo
- Down + closing
- —
- Monthly P&I
- —
- Monthly cashflow
- —
- DSCR
- —
- Eligible?
- —
Short-term bridge; refi at stabilization.
Listing history 18 events
-
2026-06-19days on market $34,000 Active 53 DOM
-
2026-06-18days on market $34,000 Active 52 DOM
-
2026-06-17days on market $34,000 Active 51 DOM
-
2026-06-16days on market $34,000 Active 50 DOM
-
2026-06-15days on market $34,000 Active 49 DOM
-
2026-06-14days on market $34,000 Active 47 DOM
-
2026-06-12days on market $34,000 Active 46 DOM
-
2026-06-09days on market $34,000 Active 43 DOM
-
2026-06-08days on market $34,000 Active 42 DOM
-
2026-06-07days on market $34,000 Active 41 DOM
-
2026-06-05days on market $34,000 Active 39 DOM
-
2026-06-04pricedays on market $34,000 Active 37 DOM
-
2026-06-02days on market $44,900 Active 36 DOM
-
2026-06-01days on market $44,900 Active 35 DOM
-
2026-05-31days on market $44,900 Active 34 DOM
-
2026-05-31days on market $44,900 Active 33 DOM
-
2026-05-07price $49,900
-
2026-04-24$55,000 Active
ⓘ Source: listings_history table (triggers on properties + properties_extension) + one-shot
backfill from property_details.listing_events for pre-trigger history.
Climate risk First Street
- Flood 1/10 Low FEMA zone X (unshaded) · 0% chance over 30 yrs
- Wildfire 1/10 Low
- Heat 6/10 Major 7 d/yr ≥109°F today · 18 d/yr by 30 yrs out
- Wind 2/10 Low 2% chance of damaging wind over 30 yrs
- Air quality 2/10 Low 1 unhealthy d/yr today · 1 by 30 yrs out
Nearby sold comps map
Loading sold comps map…
Walkable amenities ~0.75 mi
Loading nearby amenities…
Taxation est. · year 1
- Rental income
- $12,965
- − Mortgage interest
- −$1,905
- − Property taxes
- −$510
- − Insurance
- −$170
- − Repairs & maintenance
- −$1,037
- − Management
- −$1,037
- − Depreciation
- −$989
- Taxable income
- $7,317
- Est. tax owed @ 24.0%
- −$1,756
- After-tax cash flow
- $5,666/yr
For passive investors: Depreciation is non-cash, so a rental often shows a tax loss while cash-flowing — sheltering income. Rental losses are passive: they offset passive income freely, and up to $25,000/yr can offset ordinary (W-2) income if you actively participate and your MAGI is under $100k (phasing out to $0 by $150k); unused losses carry forward. On sale, claimed depreciation is recaptured at up to 25%, and gains may owe capital-gains tax (a 1031 exchange can defer both). Figures are a year-1 estimate at your 24.0% rate — not tax advice; consult a CPA.
Condition & rehab AI · 12 photos
This property requires extensive repairs and updates to improve its condition and value. Significant work is needed to address the deteriorating exterior, interior, and HVAC systems.
Repairs flagged
- Major Paint — Peeling paint on exterior and interior
- Major Siding — Damaged siding
- Major Windows — Dirty, broken glass
- Major Flooring — Worn-out carpet
- Major HVAC — Old, inefficient water heater
Value-add opportunities
- Both Paint job — Improves curb appeal and interior aesthetics
- Both New siding — Enhances exterior appearance and durability
- Both New windows — Improves energy efficiency and curb appeal
- Both New flooring — Enhances interior aesthetics and comfort
- Both HVAC upgrade — Improves comfort and energy efficiency
Renovation cost estimate screening
| Repair item | Severity | Est. cost |
|---|---|---|
| Paint · Peeling paint on exterior and interior | Major | $15,000–50,000 |
| Siding · Damaged siding | Major | $15,000–50,000 |
| Windows · Dirty, broken glass | Major | $15,000–50,000 |
| Flooring · Worn-out carpet | Major | $15,000–50,000 |
| HVAC · Old, inefficient water heater | Major | $15,000–50,000 |
| Total estimated repair cost · 5 items | $75,000–250,000 |
Value-add ROI direction
- Both Paint job — Improves curb appeal and interior aesthetics ↑
- Both New siding — Enhances exterior appearance and durability ↑
- Both New windows — Improves energy efficiency and curb appeal ↑
- Both New flooring — Enhances interior aesthetics and comfort ↑
- Both HVAC upgrade — Improves comfort and energy efficiency ↑
ⓘ Cost ranges are severity-bucket heuristics (US national rule-of-thumb). Get contractor quotes + a written scope before underwriting a rehab budget.
Schools (NCES district)
- District
- Tonkawa
- NCES district ID
- 4030120
- Math proficiency
- 16% ▼ -17.00%
- Reading proficiency
- 22% ▼ -10.00%
- Median HH income
- $42,371
- Composite
- 16.33/100
- National rank
- #9207
- State rank
- #179 of 270 in OK
Livability — Tonkawa
- Score
- 67/100
- State rank
- #99
- US rank
- #11096
Category grades
Schools grade is shown separately in the Schools card above.
Census & demographics
- Census place
- Tonkawa, OK
- City population
- 3,689
- Population (ZIP)
- 3,689
Population outlook (Kay County) Hauer SSP2
- Today (2025)
- 43,389 people
- By 2030
- 42,222 · -2.7%
- By 2040
- 40,108 · -7.6%
- By 2050
- 38,231 · -11.9%
- By 2075
- 34,119 · -21.4%
- By 2100
- 28,526 · -34.3%
Race, ethnicity, and origin ACS 2023
- Neighborhood character
- Predominantly White (70%)
- Race & ethnicity
- White 70% Two or more races 12% Native American 11% Hispanic / Latino 8%
- Hispanic origin (detail)
- Mexican 7%
- Common ancestry
- Lithuanian 2% Slovak 2% Iranian 1%
- Foreign-born
- 3% · Canada
- Languages at home
- 94% English-only · Spanish 4%
Political lean MEDSL · Kay
- 2024 margin
- Solid R (+49.4) · D 24.4% · R 73.8% · Other 1.7%
- 2008→2024 swing
- -7.8pp toward R · 2008: -41.6pp · 2024: -49.4pp
- All cycles
- 2024: R+49.4 2020: R+51.0 2016: R+50.2 2012: R+42.6 2008: R+41.6
Not yet ingested
- Civics
- —
Market trends
- HPI YoY
- ▼ -1.29%
- Current HPI
- 241.0167
- Rent YoY
- —
- Metro
- —
- State GDP YoY
- ▲ 1.55%
- F500 in state
- 6
Industry mix (Fortune 500 HQ in OK)
| Industry | F500 HQs | Revenue |
|---|---|---|
| Energy | 3 | $48B |
|
||
Price history
-9.3% since first listed2 events — show timeline
- 2026-05-07 Price Changed $49,900 MLSOK
- 2026-04-24 Listed $55,000 MLSOK
Property tax history
+1.4%/yrLatest (2025): $49 · +4.3% YoY. Source: county tax records.
Cash-flow waterfall
monthlySold comps — $/sqft
last 12 mo · ≤1 miLoading sold comps…