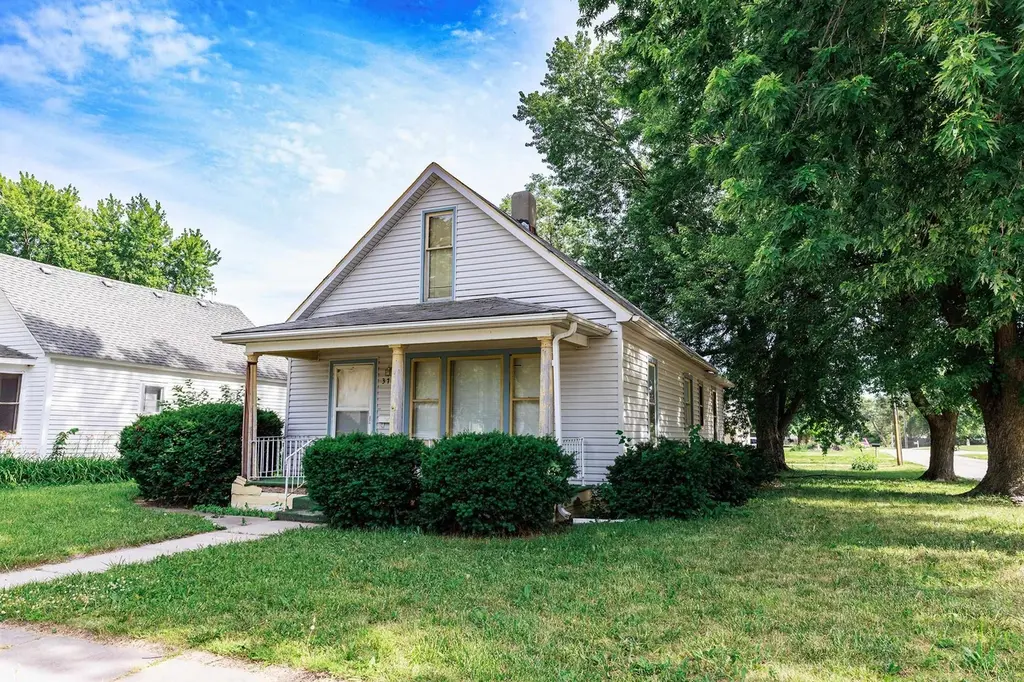
3721 13th St · Columbus, NE
Flood risk 1/10 · Minimal
- FEMA flood zone
- X
- Chance of flooding over 30 yrs
- 0.0%
- Est. flood insurance / yr
- $473 – $860
Fire risk 2/10 · Minimal
- Est. fire insurance / yr
- $1,161 – $2,155
Heat risk 3/10 · Minor
- Hot days now (above 103°F)
- 7 days/yr
- Hot days in 30 yrs
- 16 days/yr
Wind risk 2/10 · Minimal
- Chance of severe wind over 30 yrs
- —
Air-quality risk 1/10 · Minimal
- Unhealthy air days now
- 0 days/yr
- Unhealthy air days in 30 yrs
- 0 days/yr
Risk factors via First Street. Map © Google.
Why this score? — see what drove the C+ grade
The composite is a weighted blend of 9 inputs, each scored 0–100. Each bar is that input's sub-score; the figure is the points it added to the 100-point composite (weight × sub-score).
- Cash flow +23.3/30.0
- ARV discount +15.0/15.0
- DSCR +7.5/10.0
- 1% rule +5.4/10.0
- Livability +4.0/5.0
- Schools +3.5/10.0
- Rent growth +2.5/5.0
- Condition / age +2.5/5.0
- Appreciation +0.0/10.0
$139,000
🖨 Deal sheet 📄 Offer letter ✓ Due diligence
Listing remarks
If you're looking for an affordable home with plenty of space, this 4-bedroom, 1-bath property is worth a look. The exterior features newer vinyl siding and soffits. Inside, you'll find two bedrooms located on the main floor and two additional bedrooms upstairs. The kitchen offers a gas range and a newer refrigerator, while the laundry room is located just off the kitchen for added convenience. With a functional layout and 4 beds this home could be used for a family or for a potential investment.
Key facts
- Newer vinyl siding
- Laundry room
- Newer refrigerator
Tags
Property features AI
Exterior
- Parking: No designated off-street parking; alley access
- Utilities: Public water; Public sewer; Natural gas available
- Home design: Single-family residence; 1 story
- Construction: Frame construction with vinyl siding; Asphalt roof
- Exterior features: Storm door(s); Shed(s) / exterior storage
Interior
- Kitchen: Gas range; Refrigerator; Gas water heater; Water softener
- Bedrooms: 2 bedrooms on the main level
- Heating & cooling: Forced air heating (natural gas); Central air conditioning
- Interior features: Window coverings; Partial basement
- Laundry & utility: Laundry on the main level
Neighborhood map
What this means for you Summary
Snapshot
- This is a 2-bed/1.0-bath single-family listed at $139k.
Deal economics
- At list price, monthly cash flow is $253 ($3k/yr) — positive.
- The deal already cash-flows at list — no discount required.
- Meets the 1% rule at list price ($1k rent vs $139k).
- Cap rate 8.5% vs local median 3.3% in Columbus — top-decile yield for the area; either an underpriced asset or a hidden risk that comps aren't pricing in. Stress-test before assuming the spread holds.
Location & tenants
- Location reads 80/100 on livability (#20 in NE, #1,633 nationally) — a professional / high-income tenant draw. Strengths: crime A+, cost of living A+, housing A+; Watch: amenities D-, commute F.
- Columbus Public Schools (town): math 39% / reading 43% proficiency, ranked #93 of 111 in NE (top 84%) — families likely to look elsewhere, expect single-tenant / working-renter base with shorter leases.
- Zoned schools: West Park Elementary (math 27% / reading 42%, grade F, #390 of 502 statewide, top 80%, 262 students, 50% FRL).
- Market conditions: 301 active listings in the ZIP; 15 comparable units currently listed for rent nearby; rentals lingering (median 44d on market — plan ~5-8 weeks vacancy on turnover, expect pricing pressure); 100% of comp listings sitting > 30 days — soft ceiling on asking rent; 98 units permitted in Platte County in 2024 (17 in 5+ unit buildings).
Forward outlook
- Local home prices are declining (-3.0%/yr); year-one equity from $961 of loan paydown is wiped out by about $4k of value loss. Plan a longer hold.
- Platte County population projected at +13% by 2050 — modest demand growth; plan on rents tracking national, not racing it.
Negotiation context
- Only 1 days on market — expect competitive offers; lowballing is unlikely to land.
- Current owner paid $51k; list at $139k implies a 173% gain — meaningful room to come down on a strong offer.
Risks & watch-outs
- Watch-outs: built in 1900 — expect roof / HVAC / electrical / plumbing capex.
Questions for the listing agent
- Built in 1900 — when were the roof, HVAC, electrical panel, plumbing, and water heater last replaced?
- Is there a deadline driving the sale (1031 exchange, divorce, estate, relocation)? That informs how much negotiation room exists.
- What's the average days-on-market for RENTAL listings here right now (not sales)? A rising rental-DOM trend means longer vacancies and softer asking-rent achievability than the comps imply.
- What's the recent tenant-quality profile in this submarket — average credit score on applications, eviction rate, late-payment / NSF rate, and stable-employment percentage? A property-management company in the area should have these aggregated.
- How much new for-sale + rental construction is in the pipeline within 1–3 miles? Heavy new supply typically softens prices + rents 12–24 months out; constrained supply supports both.
Investment metrics
- 1% rule
- 1.04% ✓
- Cap rate
- 8.48%
- Cash-on-cash
- 7.81%
- DSCR
- 1.35
- GRM
- 8.0
CMA / ARV
- ARV (on-the-fly)
- $184,140
- Comps found
- 8
Show comp detail 8 sales within ~0.75 mi
| Address | Dist | Beds/Ba | Sqft | Sold | Price | $/sf | Match |
|---|---|---|---|---|---|---|---|
| 3507 15th St | 0.19mi | 2/1.0 | 956 (-3%) | 11mo | $170,000 | $178 | 76 |
| 3810 13th St | 0.06mi | 3/2.0 (+1) | 1,080 (+9%) | 3mo | $218,500 | $202 | 71 |
| 3511 15th St | 0.18mi | 2/2.0 | 912 (-8%) | 5mo | $170,000 | $186 | 70 |
| 1458 45th Ave | 0.44mi | 3/1.0 (+1) | 1,034 (+4%) | 10mo | $182,500 | $176 | 59 |
| 3715 18th St | 0.31mi | 3/1.0 (+1) | 864 (-13%) | 16mo | $185,000 | $214 | 46 |
| 3009 21 St | 0.71mi | 2/2.0 | 998 (+1%) | 23mo | $93,000 | $93 | 42 |
| 3409 19th St | 0.42mi | 2/2.0 | 864 (-13%) | 17mo | $160,000 | $185 | 41 |
| 4237 Bray Dr | 0.64mi | 3/2.0 (+1) | 1,092 (+10%) | 9mo | $235,000 | $215 | 37 |
Match score weights: distance 35% · size 25% · config 20% · recency 20%. Top-matched comps best support the ARV.
Projected returns pro-forma
-3.0% appreciation · 3.0% rent growth · sell at horizon
- IRR
- -4.4%
- Equity multiple
- 0.84×
- Total profit
- $-6,421
- Equity at exit
- $20,725
- IRR
- 5.2%
- Equity multiple
- 1.39×
- Total profit
- $15,074
- Equity at exit
- $12,018
Cash invested: $38,920 (down + closing). Projections, not guarantees.
Landlord ↔ Tenant lean methodology
- Overall (STATE)
- 83 Strongly Landlord-Friendly
- State Nebraska
- 83 Strongly Landlord-Friendly · R+13
- County
- — inherits STATE
- City
- — inherits STATE
ZIP-level market 68601
- Home prices YoY
- -22.4%
- Active inventory
- 301
- Price-to-rent
- 8.0×
Monthly cashflow live
- Estimated rent
- $1,440 high interval (Pro) →
- Mortgage (P&I)
- −$729
- Tax from tax record
- −$98 /mo · $1,174/yr
- Insurance
- −$58
- HOA
- −$0
- Vacancy / Maint / Mgmt
- −$302
- Net cashflow
- $253
Break-even live
UW: 25.0% down · 7.5% · 30yr · 1.5% tax · 5.0% vac · 8.0% maint · 8.0% mgmt
Financing live
Cash to close
- Down payment
- $34,750
- Closing costs
- $4,170
- Reserves months
- —
- Total cash needed
- —
Loan-product check · same deal, 3 products live
Conventional
25% down · 7.5% · 30yr
- Down + closing
- —
- Monthly P&I
- —
- Monthly cashflow
- —
- DSCR
- —
- Eligible?
- —
Personal DTI + credit; lowest rate.
DSCR
20% down · 8.5% · 30yr
- Down + closing
- —
- Monthly P&I
- —
- Monthly cashflow
- —
- DSCR
- —
- Eligible?
- —
No personal income docs; deal must DSCR.
Hard money
10% down · 12.0% · 12mo
- Down + closing
- —
- Monthly P&I
- —
- Monthly cashflow
- —
- DSCR
- —
- Eligible?
- —
Short-term bridge; refi at stabilization.
Rent comps 15 comps
| Address | Beds | Baths | Sqft | Rent | $/sqft | DOM | Units | Dist |
|---|---|---|---|---|---|---|---|---|
| 3516 25th St Columbus, NE | 1.0 | 1.0 | 550 | $995 | $1.81 | 43d | 1 | 0.83mi |
| 3539 43rd Ave Unit 208 Columbus, NE | 2.0 | 2.0 | 1053 | $1,650 | $1.57 | 43d | 1 | 1.40mi |
| 3539 43rd Ave Unit 304 Columbus, NE | 2.0 | 2.0 | 1051 | $1,595 | $1.52 | 43d | 1 | 1.40mi |
| 3539 43rd Ave Unit 102 Columbus, NE | 2.0 | 2.0 | 1051 | $1,850 | $1.76 | 43d | 1 | 1.40mi |
| 3539 43rd Ave Unit 202 Columbus, NE | 2.0 | 2.0 | 973 | $1,525 | $1.57 | 43d | 1 | 1.40mi |
| 3539 43rd Ave Unit 105 Columbus, NE | 1.0 | 1.0 | 775 | $1,475 | $1.90 | 43d | 1 | 1.40mi |
| 3539 43rd Ave Unit 104 Columbus, NE | 1.0 | 1.0 | 716 | $1,395 | $1.95 | 43d | 1 | 1.40mi |
| 3539 43rd Ave Unit 305 Columbus, NE | 1.0 | 1.0 | 775 | $1,325 | $1.71 | 43d | 1 | 1.40mi |
| 3539 43rd Ave Unit 101 Columbus, NE | 1.0 | 1.0 | 658 | $1,300 | $1.98 | 43d | 1 | 1.40mi |
| 3539 43rd Ave Unit 203 Columbus, NE | 1.0 | 1.0 | 726 | $1,275 | $1.76 | 43d | 1 | 1.40mi |
| 3539 43rd Ave Unit 306 Columbus, NE | 1.0 | 1.0 | 716 | $1,225 | $1.71 | 43d | 1 | 1.40mi |
| 3539 43rd Ave Unit 106 Columbus, NE | 2.0 | 2.0 | 1053 | $1,750 | $1.66 | 43d | 1 | 1.40mi |
| 3539 43rd Ave Unit 307 Columbus, NE | 2.0 | 1.0 | 903 | $1,425 | $1.58 | 43d | 1 | 1.40mi |
| 3539 43rd Ave Unit 103 Columbus, NE | 1.0 | 1.0 | 726 | $1,425 | $1.96 | 43d | 1 | 1.40mi |
| 3539 43rd Ave Unit 201 Columbus, NE | 1.0 | 1.0 | 658 | $1,150 | $1.75 | 43d | 1 | 1.40mi |
Listing history 2 events
-
2026-06-18remarks 501-char remark
-
2026-06-18$139,000 Active 1 DOM
ⓘ Source: listings_history table (triggers on properties + properties_extension) + one-shot
backfill from property_details.listing_events for pre-trigger history.
Tax reassessment forecast NE · Resets to sale price
- Current annual tax
- $1,174 · $98/mo
- Projected year-2 tax
- $2,405 · $200/mo
- Expected delta
- +$1,230/yr (+$103/mo · 104.8%)
ⓘ Screening estimate from a state-policy table — verify with the county assessor before closing.
Climate risk First Street
- Flood 1/10 Low FEMA zone X · 0% chance over 30 yrs
- Wildfire 2/10 Low
- Heat 3/10 Moderate 7 d/yr ≥103°F today · 16 d/yr by 30 yrs out
- Wind 2/10 Low
- Air quality 1/10 Low 0 unhealthy d/yr today · 0 by 30 yrs out
Nearby sold comps map
Loading sold comps map…
Walkable amenities ~0.75 mi
Loading nearby amenities…
Taxation est. · year 1
- Rental income
- $17,285
- − Mortgage interest
- −$7,786
- − Property taxes
- −$1,174
- − Insurance
- −$695
- − Repairs & maintenance
- −$1,383
- − Management
- −$1,383
- − Depreciation
- −$4,044
- Taxable income
- $820
- Est. tax owed @ 24.0%
- −$197
- After-tax cash flow
- $2,842/yr
For passive investors: Depreciation is non-cash, so a rental often shows a tax loss while cash-flowing — sheltering income. Rental losses are passive: they offset passive income freely, and up to $25,000/yr can offset ordinary (W-2) income if you actively participate and your MAGI is under $100k (phasing out to $0 by $150k); unused losses carry forward. On sale, claimed depreciation is recaptured at up to 25%, and gains may owe capital-gains tax (a 1031 exchange can defer both). Figures are a year-1 estimate at your 24.0% rate — not tax advice; consult a CPA.
Schools (NCES district)
- District
- Columbus Public Schools
- NCES district ID
- 3105340
- Math proficiency
- 39% ▼ -10.00%
- Reading proficiency
- 43% ▼ -3.00%
- Median HH income
- $51,074
- Composite
- 35.41/100
- National rank
- #4942
- State rank
- #93 of 111 in NE
Livability — Columbus
- Score
- 80/100
- State rank
- #20
- US rank
- #1633
Category grades
Schools grade is shown separately in the Schools card above.
Census & demographics
- Census place
- Columbus, NE
- City population
- 30,619
- Population (ZIP)
- 30,619
Population outlook (Platte County) Hauer SSP2
- Today (2025)
- 34,130 people
- By 2030
- 34,778 · +1.9%
- By 2040
- 36,436 · +6.8%
- By 2050
- 38,648 · +13.2%
- By 2075
- 47,293 · +38.6%
- By 2100
- 57,020 · +67.1%
Race, ethnicity, and origin ACS 2023
- Neighborhood character
- Predominantly White (71%)
- Race & ethnicity
- White 71% Hispanic / Latino 25% Two or more races 14%
- Hispanic origin (detail)
- Mexican 14% Cuban 2%
- Common ancestry
- Romanian 7% Portuguese 2% Lithuanian 1%
- Foreign-born
- 14% · Canada
- Languages at home
- 79% English-only · Spanish 20%
Political lean MEDSL · Platte
- 2024 margin
- Solid R (+58.3) · D 20.4% · R 78.7%
- 2008→2024 swing
- -16.8pp toward R · 2008: -41.5pp · 2024: -58.3pp
- All cycles
- 2024: R+58.3 2020: R+56.8 2016: R+58.8 2012: R+51.8 2008: R+41.5
Not yet ingested
- Civics
- —
Market trends
- HPI YoY
- ▼ -100.37%
- Current HPI
- 347.5063
- Rent YoY
- —
- Metro
- —
- State GDP YoY
- ▲ 0.68%
- F500 in state
- 2
Industry mix (Fortune 500 HQ in NE)
| Industry | F500 HQs | Revenue |
|---|---|---|
| Conglomerate | 1 | $371B |
|
||
Price history
+172.5% since first listed2 events — show timeline
- 2026-06-16 Listed $139,000 CBOR
- 1998-01-25 Sold (Public Records) $51,000 Public Records
Property tax history
+1.8%/yrLatest (2025): $1,174 · +6.2% YoY. Source: county tax records.
Cash-flow waterfall
monthlySold comps — $/sqft
last 12 mo · ≤1 miLoading sold comps…