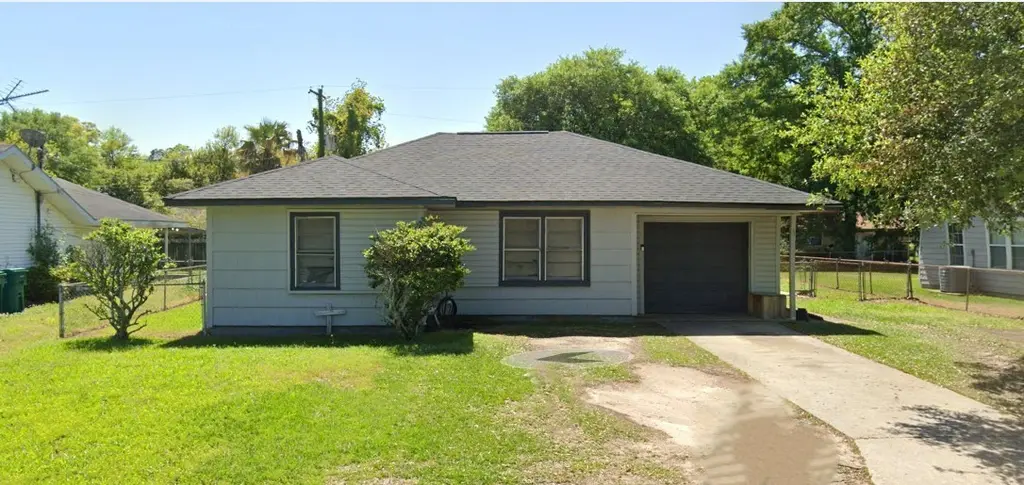
409 Bridal Wreath Ave · Orange, TX
Flood risk 5/10 · Moderate
- FEMA flood zone
- X (unshaded)
- Chance of flooding over 30 yrs
- 0.28%
- Est. flood insurance / yr
- $507 – $1,088
Fire risk 2/10 · Minimal
- Est. fire insurance / yr
- $1,222 – $2,270
Heat risk 9/10 · Severe
- Hot days now (above 109°F)
- 7 days/yr
- Hot days in 30 yrs
- 22 days/yr
Wind risk 9/10 · Severe
- Chance of severe wind over 30 yrs
- 99.0%
Air-quality risk 2/10 · Minimal
- Unhealthy air days now
- 1 days/yr
- Unhealthy air days in 30 yrs
- 1 days/yr
Risk factors via First Street. Map © Google.
Why this score? — see what drove the C- grade
The composite is a weighted blend of 9 inputs, each scored 0–100. Each bar is that input's sub-score; the figure is the points it added to the 100-point composite (weight × sub-score).
- Cash flow +21.0/30.0
- DSCR +6.7/10.0
- 1% rule +5.9/10.0
- Appreciation +5.5/10.0
- Rent growth +3.9/5.0
- Livability +3.6/5.0
- Condition / age +2.5/5.0
- Schools +1.6/10.0
- ARV discount +0.0/15.0
$125,000
🖨 Deal sheet 📄 Offer letter ✓ Due diligence
Listing remarks MLS
Welcome to 409 Bridal Wreath, a property with endless potential! This home features a spacious layout and sits in an established neighborhood, offering both charm and convenience. While it may need some updates and TLC, it provides the perfect opportunity for buyers to create their dream home or for investors looking for their next project. With its great location near schools, shopping, and major highways, 409 Bridal Wreath is more than just a house—it’s a chance to build value and make it your own. Don’t miss out on this diamond in the rough!
Key facts
- 8,407 sq ft lot
- Garage
- Built 1955
Tags
Neighborhood map
What this means for you Summary
Snapshot
- This is a 3-bed/1.0-bath single-family listed at $125k.
Deal economics
- At list price, monthly cash flow is $177 ($2k/yr) — positive.
- The deal already cash-flows at list — no discount required.
- Meets the 1% rule at list price ($1k rent vs $125k).
- Recommended offer: $110k (12.0% below list) — sets the bar for market timing.
- Cap rate 8.0% vs local median 3.9% in Orange — top-decile yield for the area; either an underpriced asset or a hidden risk that comps aren't pricing in. Stress-test before assuming the spread holds.
Location & tenants
- Location reads 71/100 on livability (#286 in TX) — a middle-class / working-renter tenant base. Strengths: cost of living A+, housing A+, health & safety A+; Watch: crime D+, employment D+, schools D-.
- West Orange-Cove CISD (suburban): math 17% / reading 21% proficiency, ranked #784 of 826 in TX (top 95%) — low school quality limits family demand, transient renter base, plan for 1-2y turnover; 79% free/reduced lunch — lower-income household profile, screen leases tightly.
- Market conditions: Rents rising fast (+5.7%/yr); 337 active listings in the ZIP; 28 comparable units currently listed for rent nearby; rentals lingering (median 44d on market — plan ~5-8 weeks vacancy on turnover, expect pricing pressure); 50% of comp listings sitting > 30 days — soft ceiling on asking rent; 235 units permitted in Orange County in 2024 (50 in 5+ unit buildings).
Forward outlook
- In year one you build about $2k of equity ($864 loan paydown + $1k appreciation (1.0% local appreciation)).
- Orange County population projected at +6% by 2050 — modest demand growth; plan on rents tracking national, not racing it.
- At projected returns (1.0% appreciation + 5.7% rent growth), your $35k cash investment doubles in ~6 years — after that, you're playing with house money.
Negotiation context
- It's been on market 146 days — a 12% lower offer ($110k) is reasonable based on typical stale-listing flexibility.
- 3 sale attempts since 11y ago with the ask held roughly flat each time — persistent listings suggest the price (not the market) is what's stuck; bring a comps-based counter.
Risks & watch-outs
- Watch-outs: built in 1955 — expect roof / HVAC / electrical / plumbing capex.
- Climate carrying-cost: moderate flood risk; severe wind risk, 99% chance of damaging wind over 30y; extreme-heat days projected 7→22/yr by 2055 (HVAC capex compounding) — expect insurance premiums to compound above CPI over the hold.
Questions for the listing agent
- It's been on market 146 days. Have you received any prior offers? Is the seller open to a 12% concession, seller financing, or rate buy-down credit?
- Built in 1955 — when were the roof, HVAC, electrical panel, plumbing, and water heater last replaced?
- Why hasn't it sold? Are there any deal-killer items the seller is aware of (foundation, flood, title, zoning, code violations)?
- Is there a deadline driving the sale (1031 exchange, divorce, estate, relocation)? That informs how much negotiation room exists.
- Schools are D-rated, which usually means shorter tenancies and higher turnover. Who's the typical renter profile here, and what's been the actual vacancy rate?
- Crime grade is D in this area — have there been break-ins, vandalism, or insurance claims at this property in the last 3 years? What carrier currently insures it and at what premium?
- What's the average days-on-market for RENTAL listings here right now (not sales)? A rising rental-DOM trend means longer vacancies and softer asking-rent achievability than the comps imply.
- What's the recent tenant-quality profile in this submarket — average credit score on applications, eviction rate, late-payment / NSF rate, and stable-employment percentage? A property-management company in the area should have these aggregated.
- How much new for-sale + rental construction is in the pipeline within 1–3 miles? Heavy new supply typically softens prices + rents 12–24 months out; constrained supply supports both.
Investment metrics
- 1% rule
- 1.09% ✓
- Cap rate
- 7.99%
- Cash-on-cash
- 6.08%
- DSCR
- 1.27
- GRM
- 7.7
CMA / ARV
- ARV (median comp)
- $103,089
- List price
- $125,000
- Delta
- 21.25%
- Verdict
- OVERPRICED
- Comps
- 20 within 1.0 mi
Show comp detail 7 sales within ~0.75 mi
| Address | Dist | Beds/Ba | Sqft | Sold | Price | $/sf | Match |
|---|---|---|---|---|---|---|---|
| 413 Gardenia Ave | 0.17mi | 3/1.0 | 1,246 (+4%) | 1mo | $124,990 | $100 | 85 |
| 504 Azalea Ave | 0.09mi | 3/1.0 | 1,225 (+2%) | 17mo | $105,000 | $86 | 79 |
| 3415 Bowling Ln | 0.24mi | 3/1.0 | 1,060 (-12%) | 4mo | $90,000 | $85 | 65 |
| 6 Circle Q St | 0.23mi | 3/1.0 | 1,090 (-10%) | 11mo | $105,000 | $96 | 64 |
| 10 Circle S | 0.23mi | 3/2.0 | 1,128 (-6%) | 13mo | $105,000 | $93 | 64 |
| 3627 Bowling Ln | 0.31mi | 3/1.0 | 1,135 (-6%) | 15mo | $65,000 | $57 | 64 |
| 3656 Hemlock St | 0.43mi | 3/1.0 | 1,034 (-14%) | 2mo | $69,900 | $68 | 54 |
Match score weights: distance 35% · size 25% · config 20% · recency 20%. Top-matched comps best support the ARV.
Projected returns pro-forma
1.01% appreciation · 5.71% rent growth · sell at horizon
- IRR
- 9.7%
- Equity multiple
- 1.50×
- Total profit
- $17,528
- Equity at exit
- $42,737
- IRR
- 15.3%
- Equity multiple
- 3.00×
- Total profit
- $70,005
- Equity at exit
- $56,844
Cash invested: $35,000 (down + closing). Projections, not guarantees.
Landlord ↔ Tenant lean methodology
- Overall (STATE)
- 87 Strongly Landlord-Friendly
- State Texas
- 87 Strongly Landlord-Friendly · R+5
- County
- — inherits STATE
- City
- — inherits STATE
ZIP-level market 77630
- Home prices YoY
- 0.4%
- Rents YoY
- 5.7%
- Active inventory
- 337
- Price-to-rent
- 7.7×
Monthly cashflow live
- Estimated rent
- $1,358 high interval (Pro) →
- Mortgage (P&I)
- −$656
- Tax from tax record
- −$188 /mo · $2,256/yr
- Insurance
- −$52
- HOA
- −$0
- Vacancy / Maint / Mgmt
- −$285
- Net cashflow
- $177
Break-even live
UW: 25.0% down · 7.5% · 30yr · 1.5% tax · 5.0% vac · 8.0% maint · 8.0% mgmt
Financing live
Cash to close
- Down payment
- $31,250
- Closing costs
- $3,750
- Reserves months
- —
- Total cash needed
- —
Loan-product check · same deal, 3 products live
Conventional
25% down · 7.5% · 30yr
- Down + closing
- —
- Monthly P&I
- —
- Monthly cashflow
- —
- DSCR
- —
- Eligible?
- —
Personal DTI + credit; lowest rate.
DSCR
20% down · 8.5% · 30yr
- Down + closing
- —
- Monthly P&I
- —
- Monthly cashflow
- —
- DSCR
- —
- Eligible?
- —
No personal income docs; deal must DSCR.
Hard money
10% down · 12.0% · 12mo
- Down + closing
- —
- Monthly P&I
- —
- Monthly cashflow
- —
- DSCR
- —
- Eligible?
- —
Short-term bridge; refi at stabilization.
Rent comps 28 comps
| Address | Beds | Baths | Sqft | Rent | $/sqft | DOM | Units | Dist |
|---|---|---|---|---|---|---|---|---|
| 107 Dahlia St Orange, TX | 3.0 | 1.0 | 1149 | $1,300 | $1.13 | 13d | 1 | 0.13mi |
| 310 Camellia Ave Orange, TX | 3.0 | 1.0 | 988 | $1,295 | $1.31 | 21d | 1 | 0.14mi |
| 403 Bluebonnet Dr Orange, TX | 3.0 | 1.0 | 1196 | $1,300 | $1.09 | 43d | 1 | 0.17mi |
| 302 Bridal Wreath Ave Orange, TX | 3.0 | 1.0 | 1182 | $1,195 | $1.01 | 43d | 1 | 0.17mi |
| 101 Azalea Ave Unit A Orange, TX | 3.0 | 1.0 | 1200 | $2,000 | $1.67 | 43d | 1 | 0.27mi |
| 3726 Bowling Ln Orange, TX | 3.0 | 1.0 | 1045 | $1,150 | $1.10 | 43d | 1 | 0.33mi |
| 3333 Ridgemont Dr Unit 203 Orange, TX | 2.0 | 1.0 | 1000 | $1,084 | $1.08 | 13d | 1 | 0.42mi |
| 3615 Ridgemont Dr Orange, TX | 3.0 | 1.0 | 1266 | $1,275 | $1.01 | 43d | 1 | 0.45mi |
| 3333 Ridgemont Dr Unit 315TWNHME Orange, TX | 2.0 | 1.5 | 1216 | $1,040 | $0.86 | 21d | 1 | 0.48mi |
| 3333 Ridgemont Dr Apt 105 Orange, TX | 2.0 | 1.0 | 952 | $1,255 | $1.32 | 21d | 1 | 0.48mi |
| 3333 Ridgemont Dr Unit 408 Orange, TX | 2.0 | 1.0 | 1000 | $1,059 | $1.06 | 43d | 1 | 0.48mi |
| 3333 Ridgemont Dr Unit 107 Orange, TX | 2.0 | 1.0 | 952 | $1,255 | $1.32 | 43d | 1 | 0.48mi |
| 3333 Ridgemont Dr Unit 404 Orange, TX | 2.0 | 1.0 | 1000 | $1,254 | $1.25 | 43d | 1 | 0.48mi |
| 3000 MacArthur Dr Orange, TX | 3.0 | 1.0–2.0 | 791 | $1,330 | $1.68 | 13d | 12 | 0.52mi |
| 3714 Ridgemont Dr Orange, TX | 3.0 | 1.0 | 1020 | $1,450 | $1.42 | 13d | 1 | 0.53mi |
| 316 Old Timers Rd Unit 316 Orange, TX | 3.0 | 2.0 | 1200 | $1,595 | $1.33 | 43d | 1 | 0.62mi |
| 7b Concord St Orange, TX | 2.0 | 1.5 | 1206 | $1,450 | $1.20 | 13d | 1 | 0.66mi |
| 1120 28th St Orange, TX | 3.0 | 1.0 | 1308 | $1,500 | $1.15 | 43d | 1 | 0.71mi |
| 205 Gloria St West Orange, TX | 3.0 | 2.0 | 1225 | $1,300 | $1.06 | 43d | 1 | 0.80mi |
| 2602 Tanglewood St West Orange, TX | 4.0 | 2.0 | 1306 | $1,250 | $0.96 | 13d | 1 | 0.80mi |
| 309 Quincy St West Orange, TX | 3.0 | 1.5 | 1113 | $1,200 | $1.08 | 13d | 1 | 0.83mi |
| 210 Florence St Orange, TX | 3.0 | 1.0 | 1064 | $1,425 | $1.34 | 43d | 1 | 0.90mi |
| 206 Florence St Orange, TX | 2.0 | 1.0 | 1216 | $1,425 | $1.17 | 43d | 1 | 0.91mi |
| 1543 Alamo St West Orange, TX | 3.0 | 1.0 | 1170 | $1,200 | $1.03 | 13d | 1 | 0.99mi |
| 3345 W Park Ave Orange, TX | 1.0–2.0 | 1.0–1.5 | 999 | $1,182 | $1.18 | 13d | 7 | 1.06mi |
| 406 Dayton St West Orange, TX | 2.0 | 1.0 | 1350 | $1,200 | $0.89 | 43d | 1 | 1.32mi |
| 1010 Highway 87 S Orange, TX | 1.0–3.0 | 1.0–2.0 | 880 | $1,425 | $1.62 | 13d | 13 | 1.32mi |
| 2801 W Sunset Dr Orange, TX | 1.0–3.0 | 1.0–2.0 | 1113 | $1,400 | $1.26 | 13d | 27 | 1.37mi |
Listing history 7 events
-
2026-05-31days on market $125,000 Active 146 DOM
-
2026-05-30days on market $125,000 Active 145 DOM
-
2026-01-05$125,000 Active 569-char remark
Show marketing remark (569 chars)
Welcome to 409 Bridal Wreath, a property with endless potential! This home features a spacious layout and sits in an established neighborhood, offering both charm and convenience. While it may need some updates and TLC, it provides the perfect opportunity for buyers to create their dream home or for investors looking for their next project. With its great location near schools, shopping, and major highways, 409 Bridal Wreath is more than just a house—it’s a chance to build value and make it your own. Don’t miss out on this diamond in the rough!
-
2025-12-31historical
-
2025-10-02$125,000 Active
-
2015-11-05soldstatus
-
2015-09-24$49,900
ⓘ Source: listings_history table (triggers on properties + properties_extension) + one-shot
backfill from property_details.listing_events for pre-trigger history.
Tax reassessment forecast TX · Resets to sale price
- Current annual tax
- $2,256 · $188/mo
- Projected year-2 tax
- $2,288 · $191/mo
- Expected delta
- +$32/yr (+$3/mo · 1.4%)
ⓘ Screening estimate from a state-policy table — verify with the county assessor before closing.
Climate risk First Street
- Flood 5/10 Major FEMA zone X (unshaded) · 28% chance over 30 yrs
- Wildfire 2/10 Low
- Heat 9/10 Extreme 7 d/yr ≥109°F today · 22 d/yr by 30 yrs out
- Wind 9/10 Extreme 99% chance of damaging wind over 30 yrs
- Air quality 2/10 Low 1 unhealthy d/yr today · 1 by 30 yrs out
Nearby sold comps map
Loading sold comps map…
Walkable amenities ~0.75 mi
Loading nearby amenities…
Taxation est. · year 1
- Rental income
- $16,295
- − Mortgage interest
- −$7,002
- − Property taxes
- −$2,256
- − Insurance
- −$625
- − Repairs & maintenance
- −$1,304
- − Management
- −$1,304
- − Depreciation
- −$3,636
- Taxable income
- $169
- Est. tax owed @ 24.0%
- −$41
- After-tax cash flow
- $2,086/yr
For passive investors: Depreciation is non-cash, so a rental often shows a tax loss while cash-flowing — sheltering income. Rental losses are passive: they offset passive income freely, and up to $25,000/yr can offset ordinary (W-2) income if you actively participate and your MAGI is under $100k (phasing out to $0 by $150k); unused losses carry forward. On sale, claimed depreciation is recaptured at up to 25%, and gains may owe capital-gains tax (a 1031 exchange can defer both). Figures are a year-1 estimate at your 24.0% rate — not tax advice; consult a CPA.
Schools (NCES district)
- District
- West Orange-Cove CISD
- NCES district ID
- 4845090
- Math proficiency
- 17% ▼ -7.00%
- Reading proficiency
- 21% ▼ -2.00%
- Median HH income
- $37,329
- Composite
- 15.86/100
- National rank
- #9260
- State rank
- #784 of 826 in TX
Livability — Orange
- Score
- 71/100
- State rank
- #286
- US rank
- #6456
Category grades
Schools grade is shown separately in the Schools card above.
Census & demographics
- Census place
- Orange, TX
- County
- Orange County · 87,112 people
- City population
- 22,976
- Metro
- Beaumont-Port Arthur, TX
- Population (ZIP)
- 28,983
- Household income
- $64,373
- Rent vs Own
- Severe rent burden
- 1018.0
Population outlook (Orange County) Hauer SSP2
- Today (2025)
- 88,065 people
- By 2030
- 89,591 · +1.7%
- By 2040
- 91,982 · +4.4%
- By 2050
- 93,023 · +5.6%
- By 2075
- 94,871 · +7.7%
- By 2100
- 88,155 · +0.1%
Race, ethnicity, and origin ACS 2023
- Neighborhood character
- Majority White (64%)
- Race & ethnicity
- White 64% Black 21% Hispanic / Latino 11% Two or more races 9%
- Hispanic origin (detail)
- Mexican 7%
- Common ancestry
- Lithuanian 13% Italian 1% Slovak 1%
- Foreign-born
- 5% · Canada
- Languages at home
- 91% English-only · Spanish 7% French/Haitian/Cajun 1% Other Asian/Pacific 1%
Political lean MEDSL · Orange
- 2024 margin
- Solid R (+66.8) · D 16.4% · R 83.1%
- 2008→2024 swing
- -19.6pp toward R · 2008: -47.1pp · 2024: -66.8pp
- All cycles
- 2024: R+66.8 2020: R+63.4 2016: R+61.9 2012: R+54.3 2008: R+47.1
Not yet ingested
- Civics
- —
Market trends
- HPI YoY
- ▲ 1.01%
- Current HPI
- 264.14
- Rent YoY
- ▲ 5.71%
- Metro
- Beaumont-Port Arthur, TX
- State GDP YoY
- ▲ 3.95%
- F500 in state
- 110
Industry mix (Fortune 500 HQ in TX)
| Industry | F500 HQs | Revenue |
|---|---|---|
| Energy | 16 | $1,198B |
|
||
| Technology | 5 | $198B |
|
||
| Engineering / Construction | 4 | $72B |
|
||
| Energy Services | 3 | $60B |
|
||
| Utilities | 3 | $41B |
|
||
| Healthcare | 2 | $330B |
|
||
Price history
+150.5% since first listed5 events — show timeline
- 2026-01-05 Listed $125,000 HARMLS
- 2025-12-31 Listing Removed — HARMLS
- 2025-10-02 Listed $125,000 HARMLS
- 2015-11-05 Sold (MLS) — BBOR
- 2015-09-24 Listed $49,900 BBOR
Property tax history
+4.1%/yrLatest (2025): $2,256 · +5.3% YoY. Source: county tax records.
Cash-flow waterfall
monthlySold comps — $/sqft
last 12 mo · ≤1 miLoading sold comps…